ELK学习笔记
ELK企业级日志分析系统
在运维工作中,日志分析是定位故障、优化性能的核心手段。传统分散式日志管理效率低下,而 ELK(Elasticsearch+Logstash+Kibana)作为开源日志分析解决方案,能实现日志的集中收集、存储、检索与可视化。本文将详细讲解 ELK 集群的部署过程,以及如何监控 Apache 服务器日志,适合运维工程师入门学习。
ELK 组件简介
ELK 由三个核心组件组成,各司其职形成完整的日志处理链路:
-
Elasticsearch:分布式搜索引擎,负责日志的索引、存储和快速查询,支持水平扩展和高可用;
-
Logstash:日志采集与处理工具,支持多数据源输入,可对日志过滤、格式化后输出到 Elasticsearch;
-
Kibana:可视化分析平台,提供 Web 界面实现日志的可视化查询、报表生成和实时监控。
环境准备
服务器规划
| 主机名 | IP 地址 | 操作系统 | 角色 | 核心软件 |
|---|---|---|---|---|
| node1 | 192.168.100.41 | CentOS 7.4 | Elasticsearch 节点、Kibana | Elasticsearch 5.5.0、Kibana 5.5.1 |
| node2 | 192.168.100.42 | CentOS 7.4 | Elasticsearch 节点 | Elasticsearch 5.5.0 |
| apache | 192.168.100.43 | CentOS 7.4 | Logstash+Apache 服务器 | Logstash 5.5.1、Apache httpd |
基础环境配置(所有节点必做)
设置主机名
# node1节点
hostnamectl set-hostname node1
# node2节点
hostnamectl set-hostname node2
# apache节点
hostnamectl set-hostname apache
配置域名解析
编辑/etc/hosts文件,添加以下内容(node1、node2节点一致):
192.168.100.41   node1
192.168.100.42   node2
安装 Java 环境
ELK 依赖 Java 1.8+,验证并安装:
# 验证Java版本
java -version
# 若未安装,执行以下命令
yum -y install java-1.8.0-openjdk-devel
关闭防火墙和 SELinux
# 关闭防火墙
systemctl stop firewalld && systemctl disable firewalld
# 临时关闭SELinux
setenforce 0
# 永久关闭SELinux(需重启)
sed -i 's/SELINUX=enforcing/SELINUX=disabled/' /etc/selinux/config
Elasticsearch 集群部署(node1、node2)
lasticsearch(简称 ES)是一个开源的分布式搜索和分析引擎,基于 Lucene 库构建,专为高性能、高可用、可扩展的全文检索和数据分析能力,广泛应用于日志分析、全文搜索、实时数据分析等场景。
安装 Elasticsearch
# 上传安装包到~目录,执行安装
cd ~
rpm -ivh elasticsearch-5.5.0.rpm
# 加载系统服务并设置开机自启
systemctl daemon-reload
systemctl enable elasticsearch.service
核心配置
备份并编辑配置文件/etc/elasticsearch/elasticsearch.yml:
# 备份配置文件
cp /etc/elasticsearch/elasticsearch.yml /etc/elasticsearch/elasticsearch.yml.bak
# 编辑配置(node2节点仅需修改node.name为node2)
vim /etc/elasticsearch/elasticsearch.yml
配置内容(保留关键配置,删除注释):
[root@node1 ~]#  grep -v "^#" /etc/elasticsearch/elasticsearch.yml
cluster.name: my-elk-cluster       # 集群名称(所有节点必须一致)
node.name: node1                   # 节点名称(node2节点改为node2)
path.data: /data/elk_data          # 数据存储路径(建议单独挂载磁盘)
path.logs: /var/log/elasticsearch/ # 日志存储路径
bootstrap.memory_lock: false       # 不锁定内存(生产环境建议开启,需配合系统参数优化)
network.host: 0.0.0.0              # 监听所有IP(允许外部访问)
http.port: 9200                    # 服务端口(默认9200)
discovery.zen.ping.unicast.hosts: ["node1", "node2"] # 集群节点发现(单播模式)
创建数据目录并授权
# 创建数据目录
mkdir -p /data/elk_data
# 授权给elasticsearch用户(服务运行用户)
chown elasticsearch:elasticsearch /data/elk_data/
启动并验证
# 启动服务
systemctl start elasticsearch.service
# 验证端口(9200为HTTP端口,9300为集群通信端口)
netstat -antp | grep 9200
netstat -antp | grep 9300
浏览器验证(真机访问)
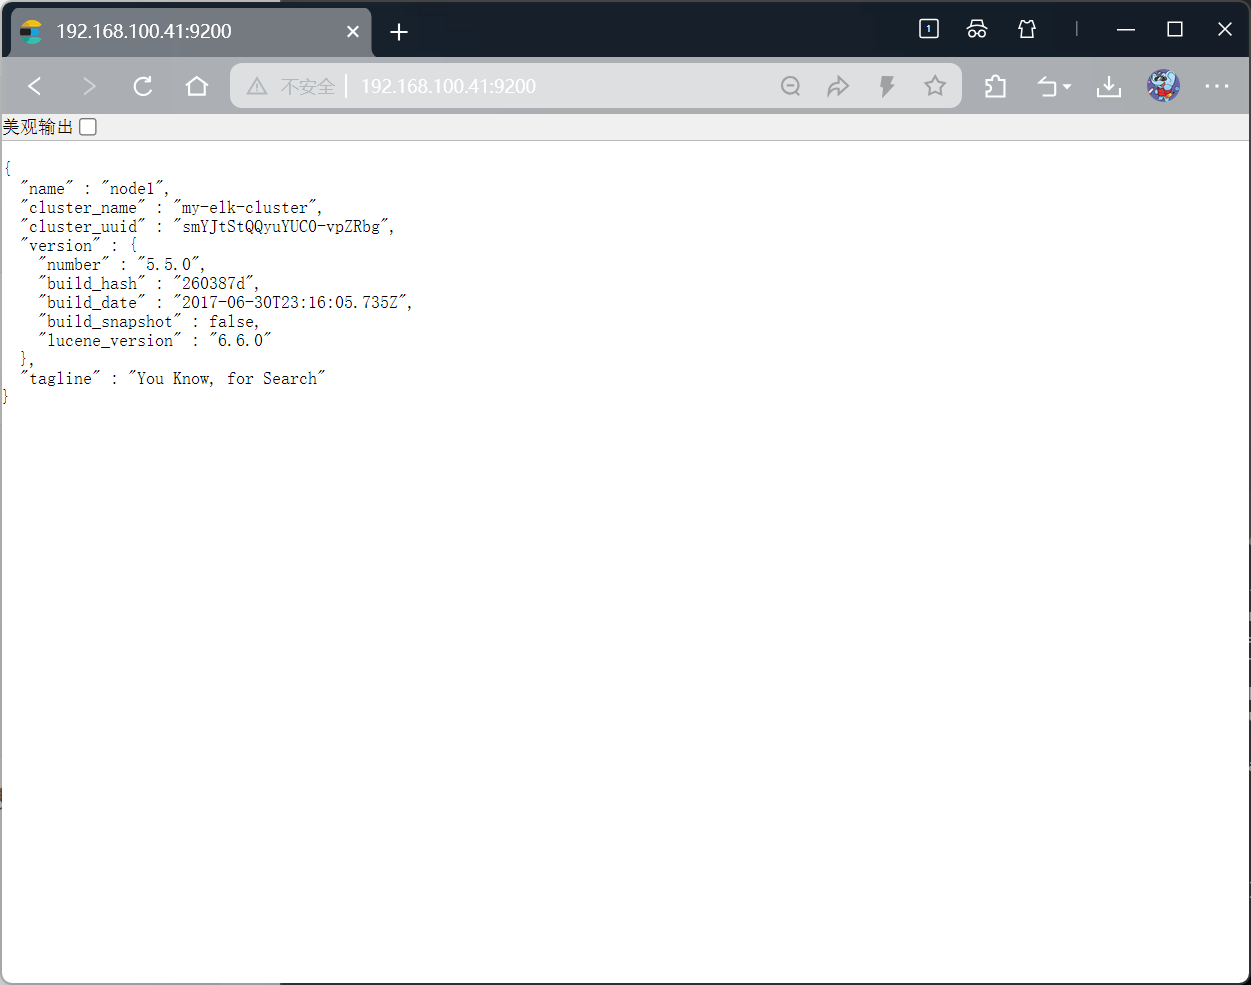
- 节点信息:http://192.168.100.41:9200,返回以下内容说明节点正常:
{"name" : "node1","cluster_name" : "my-elk-cluster","cluster_uuid" : "smYJtStQQyuYUC0-vpZRbg","version" : {"number" : "5.5.0","build_hash" : "260387d","build_date" : "2017-06-30T23:16:05.735Z","build_snapshot" : false,"lucene_version" : "6.6.0"},"tagline" : "You Know, for Search"
}
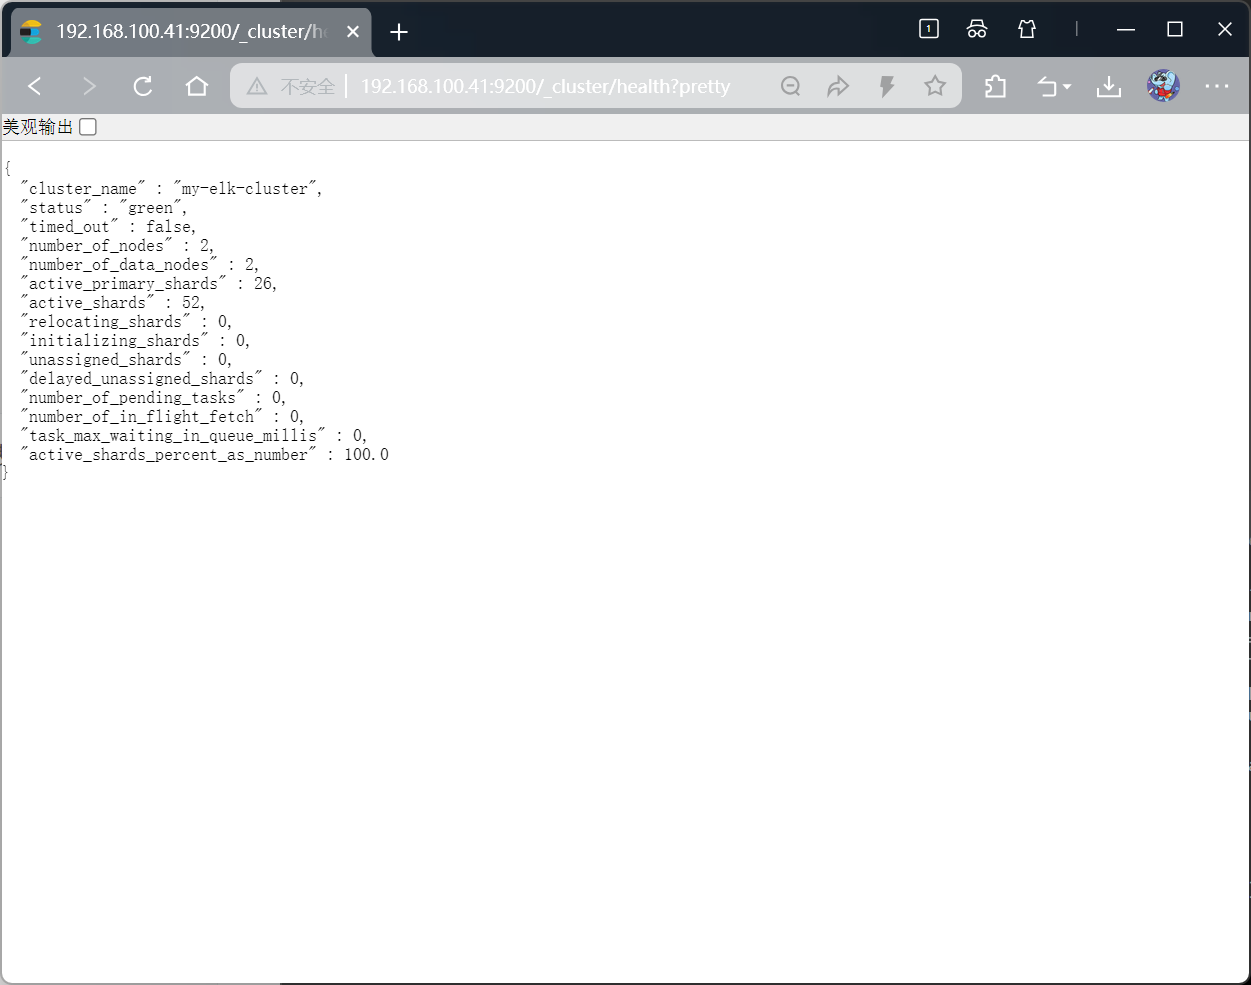
- 集群健康状态:http://192.168.100.41:9200/_cluster/health?pretty,status: "green"表示集群健康:
{"cluster_name" : "my-elk-cluster","status" : "green","timed_out" : false,"number_of_nodes" : 2,"number_of_data_nodes" : 2,"active_primary_shards" : 26,"active_shards" : 52,"relocating_shards" : 0,"initializing_shards" : 0,"unassigned_shards" : 0,"delayed_unassigned_shards" : 0,"number_of_pending_tasks" : 0,"number_of_in_flight_fetch" : 0,"task_max_waiting_in_queue_millis" : 0,"active_shards_percent_as_number" : 100.0
}

安装 Elasticsearch-head 插件(可视化集群)
head 插件用于可视化管理 Elasticsearch 集群,支持索引查看、分片分布等功能,仅需在 node1 节点安装即可。
安装依赖环境
# 安装编译工具
yum install -y gcc gcc-c++ make
# 安装Node.js(head插件基于Node.js开发)
cd ~
tar xzvf node-v8.2.1.tar.gz
cd node-v8.2.1
./configure
make -j4  # 多线程编译(根据CPU核心数调整,耗时较长)
make install
安装 phantomjs(前端框架)
# 上传安装包到~
cd ~
tar xjvf phantomjs-2.1.1-linux-x86_64.tar.bz2
# 复制可执行文件到系统PATH
cp phantomjs-2.1.1-linux-x86_64/bin/phantomjs /usr/local/bin/
# 验证
phantomjs -v
安装并启动 head 插件
# 上传安装包到~
cd ~
tar xzvf elasticsearch-head.tar.gz
cd elasticsearch-head
# 安装依赖包
npm install#修改主配置文件
cd ~
vim /etc/elasticsearch/elasticsearch.yml
#下面配置文件,插末尾
http.cors.enabled: true     ##开启跨域访问支持,默认为false
http.cors.allow-origin: "*"  ## 跨域访问允许的域名地址systemctl restart elasticsearchcd /usr/local/src/elasticsearch-head/
# 后台启动(&表示后台运行)
npm run start &
# 验证端口
netstat -lnupt | grep 9100
netstat -lnupt |grep 9200
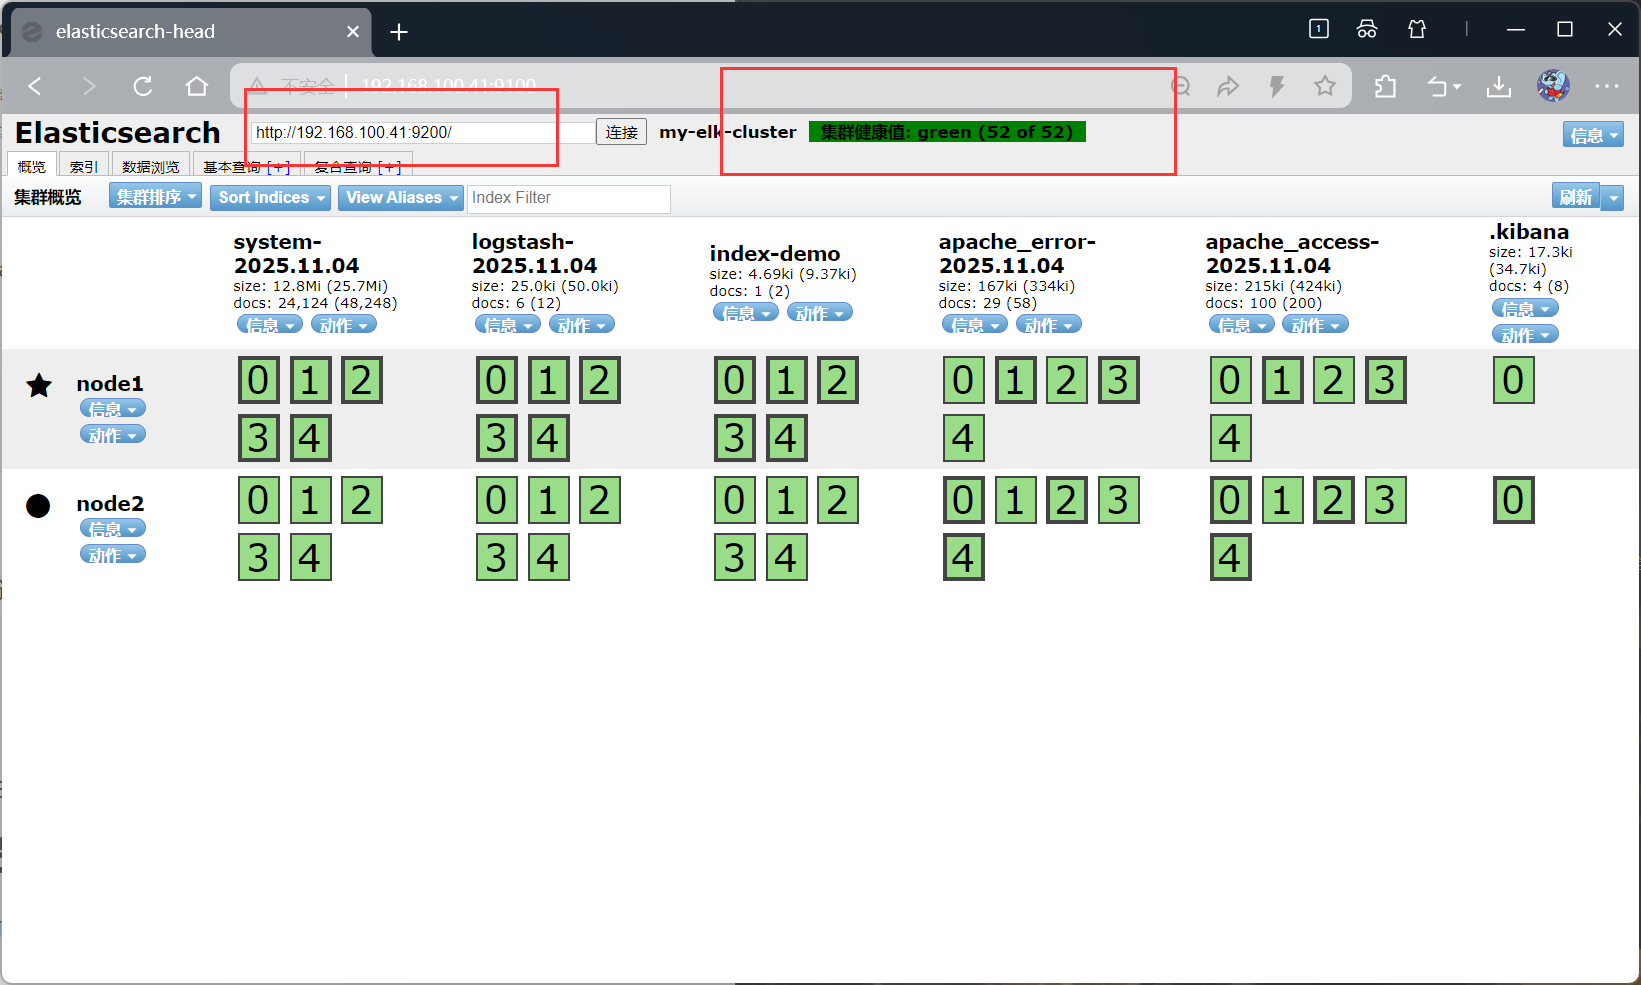
访问 head 插件
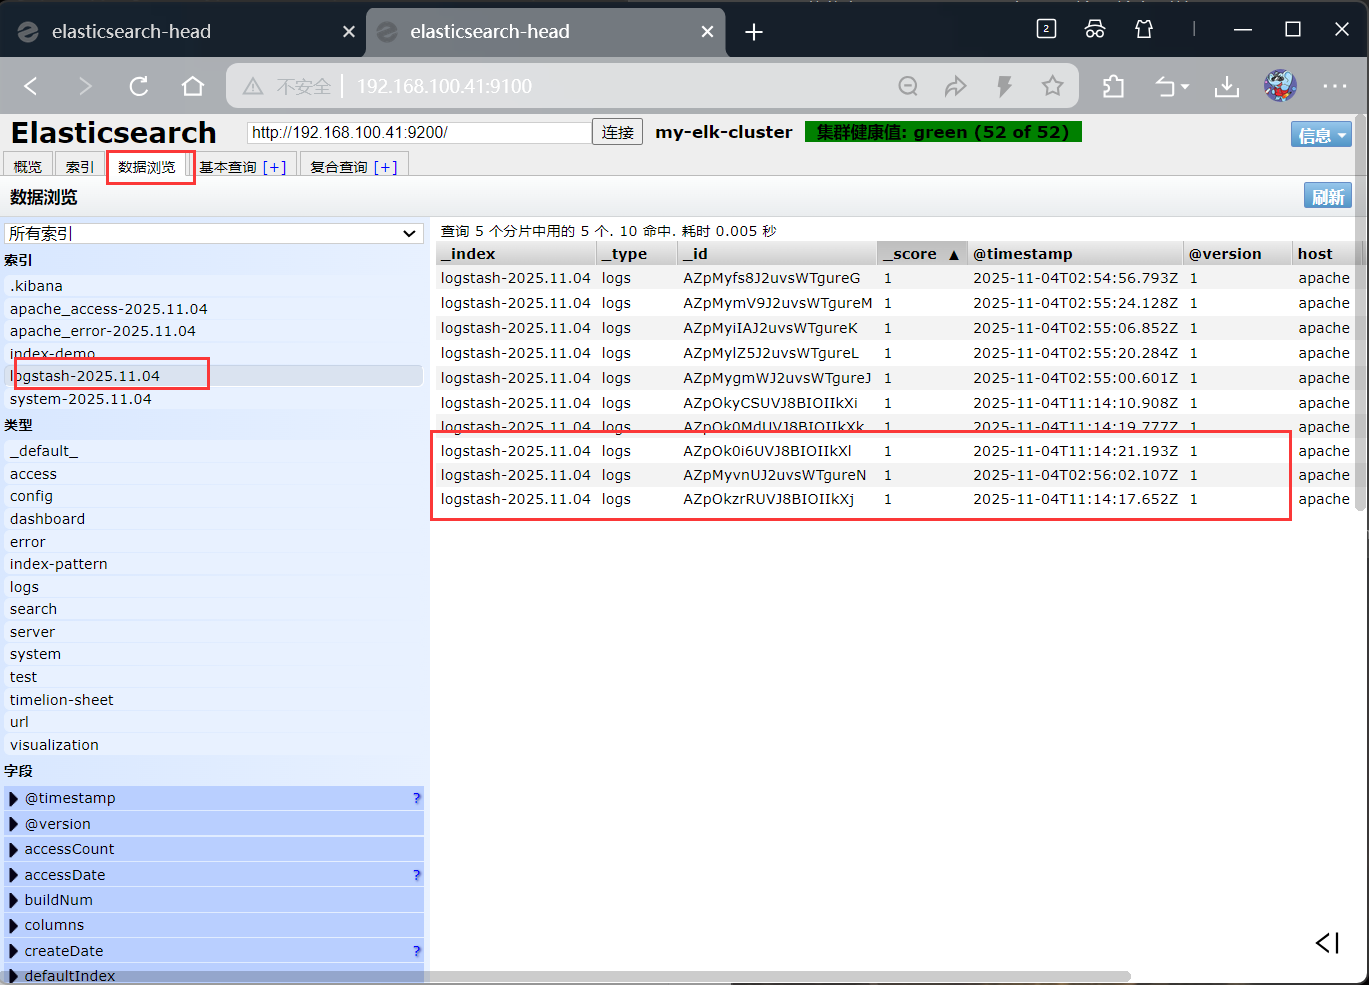
浏览器输入:http://192.168.100.41:9100,在 “连接地址” 输入http://192.168.100.41:9200,点击 “连接”,即可看到集群状态:
-
集群健康值:green
-
节点数量:2 个(node1、node2)
-
索引信息:默认无索引(后续 Logstash 会生成)
Logstash 部署(apache 节点)
Logstash 负责采集 Apache 日志和系统日志,输出到 Elasticsearch 集群。
安装 Logstash
yum -y install httpd
systemctl start httpd# 上传安装包到~目录
cd ~
rpm -ivh logstash-5.5.1.rpm
# 启动并设置开机自启
systemctl start logstash.service
systemctl enable logstash.service
# 建立软连接(方便命令行调用)
ln -s /usr/share/logstash/bin/logstash /usr/local/bin/
基础功能测试(验证输入输出)
Logstash 通过配置文件定义 “输入 - 过滤 - 输出” 流程,先通过命令行测试基础功能:
标准输入→标准输出
logstash -e 'input { stdin{} } output { stdout{} }'
# 输入任意内容(如www.baidu.com),会输出带时间戳的日志
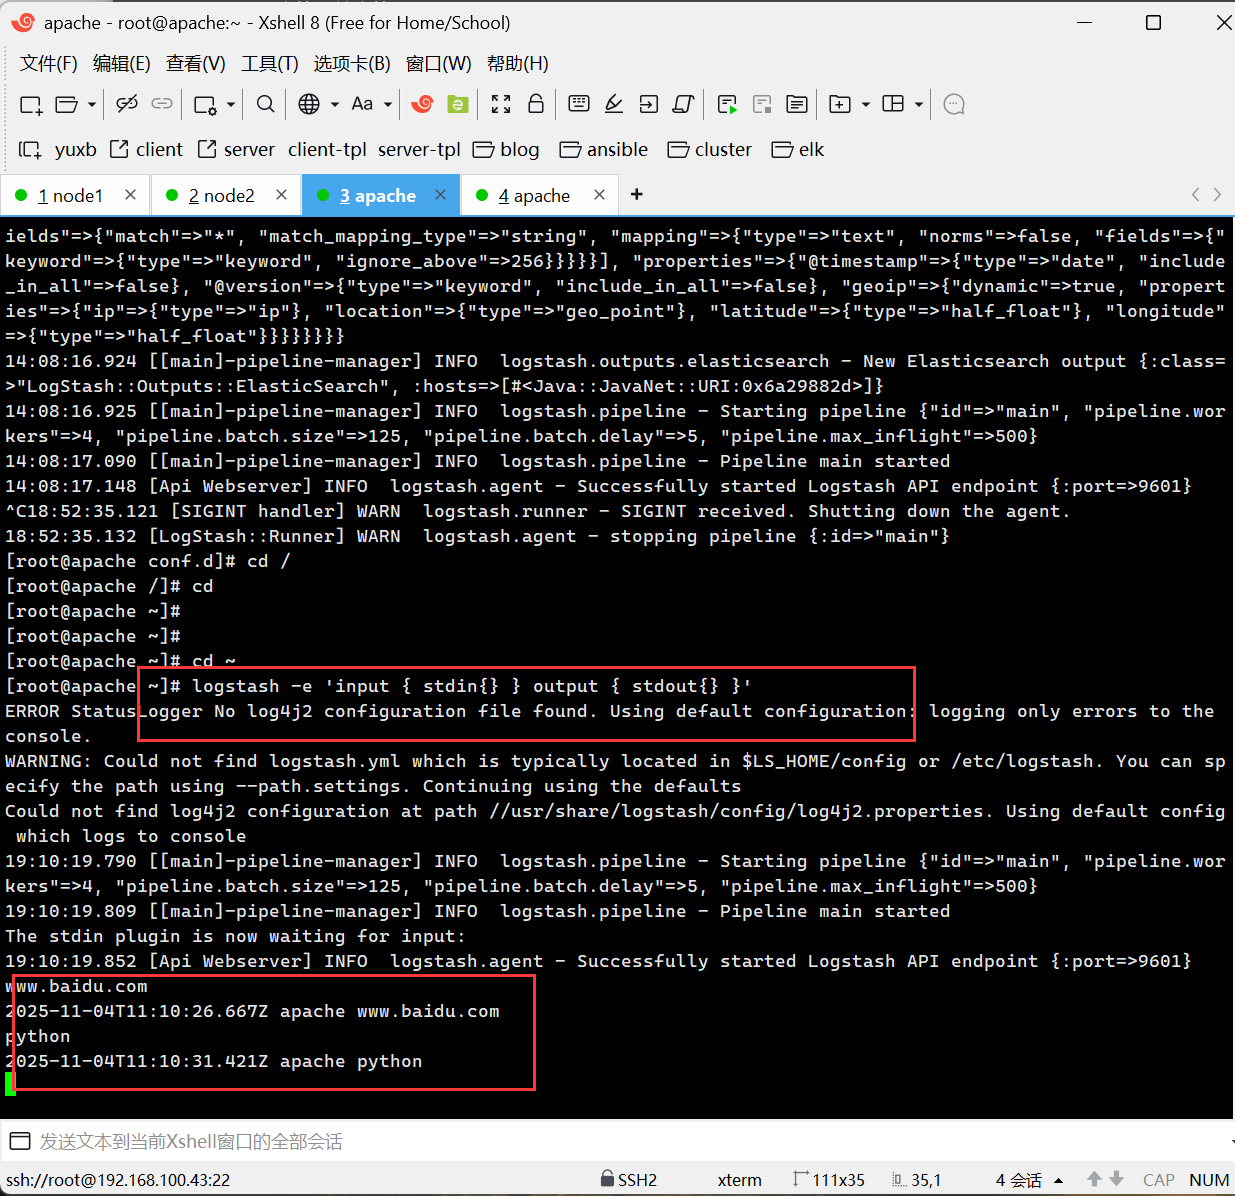
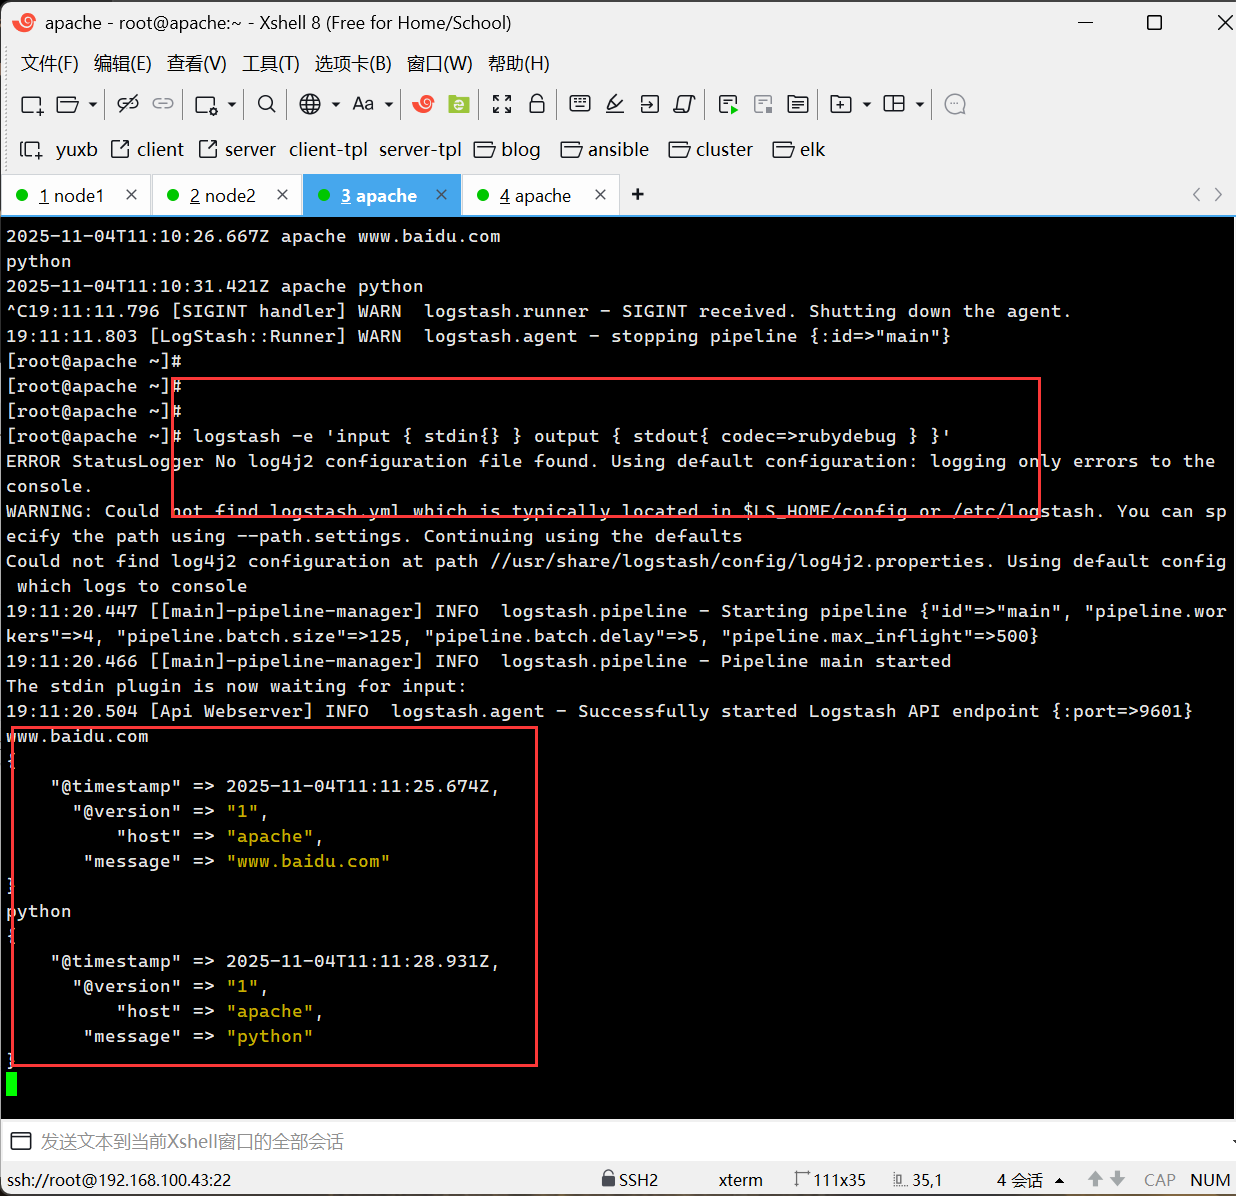
#使用rubydebug显示详细输出,codec为一种编解码器
[root@apache ~]# logstash -e 'input { stdin{} } output { stdout{ codec=>rubydebug } }'
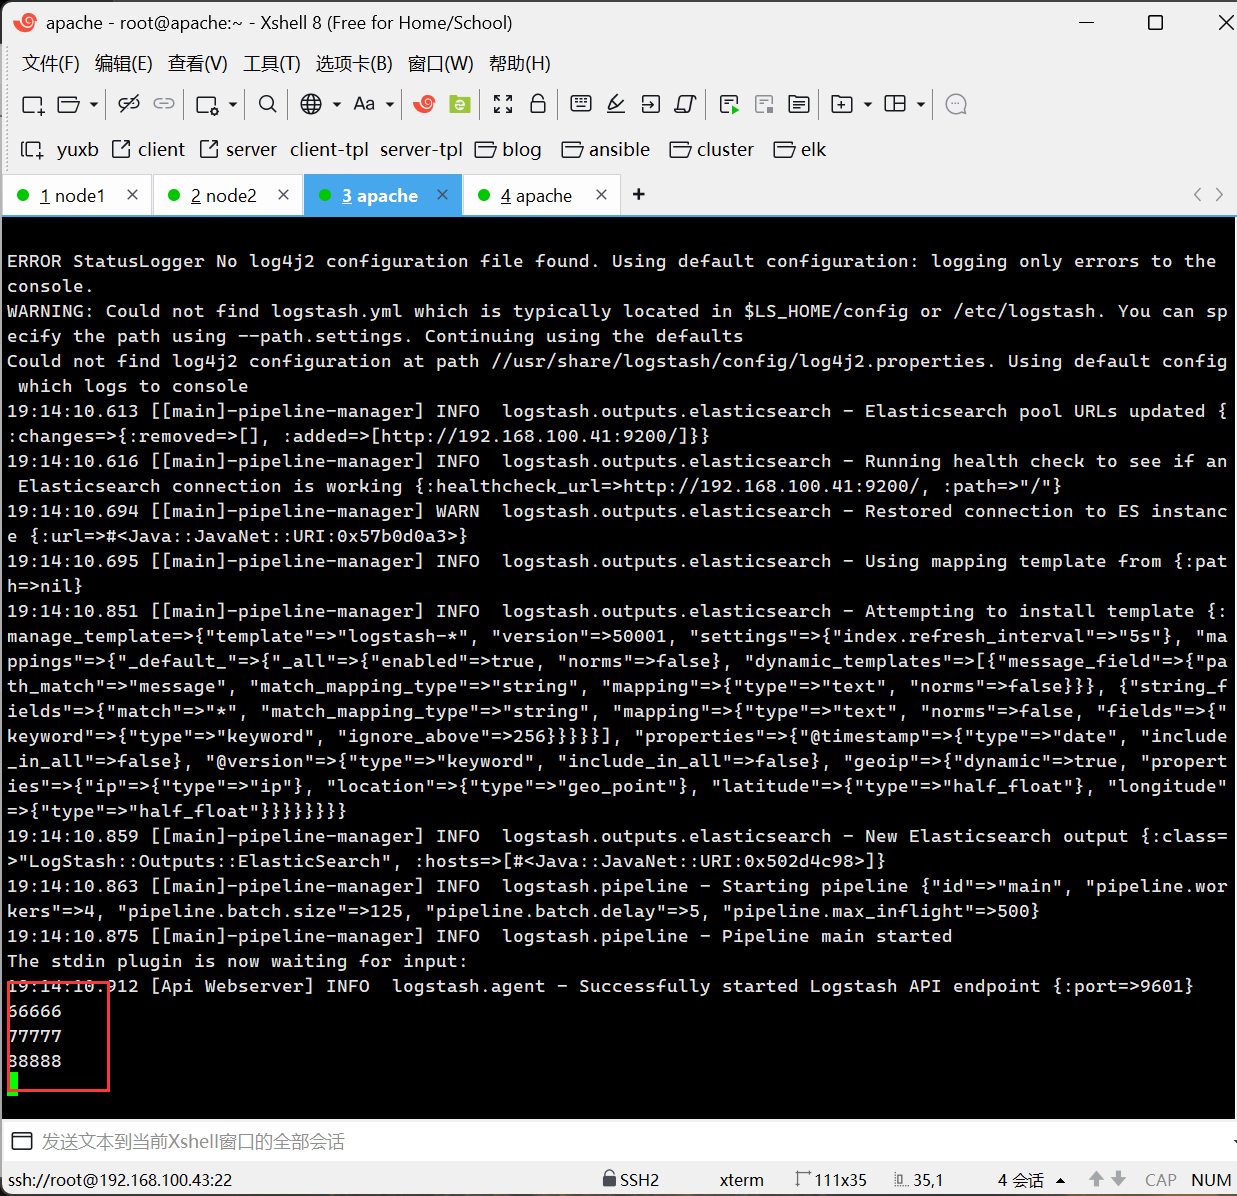
标准输入→Elasticsearch 输出
logstash -e 'input { stdin{} } output { elasticsearch { hosts=>["192.168.100.41:9200"] } }'
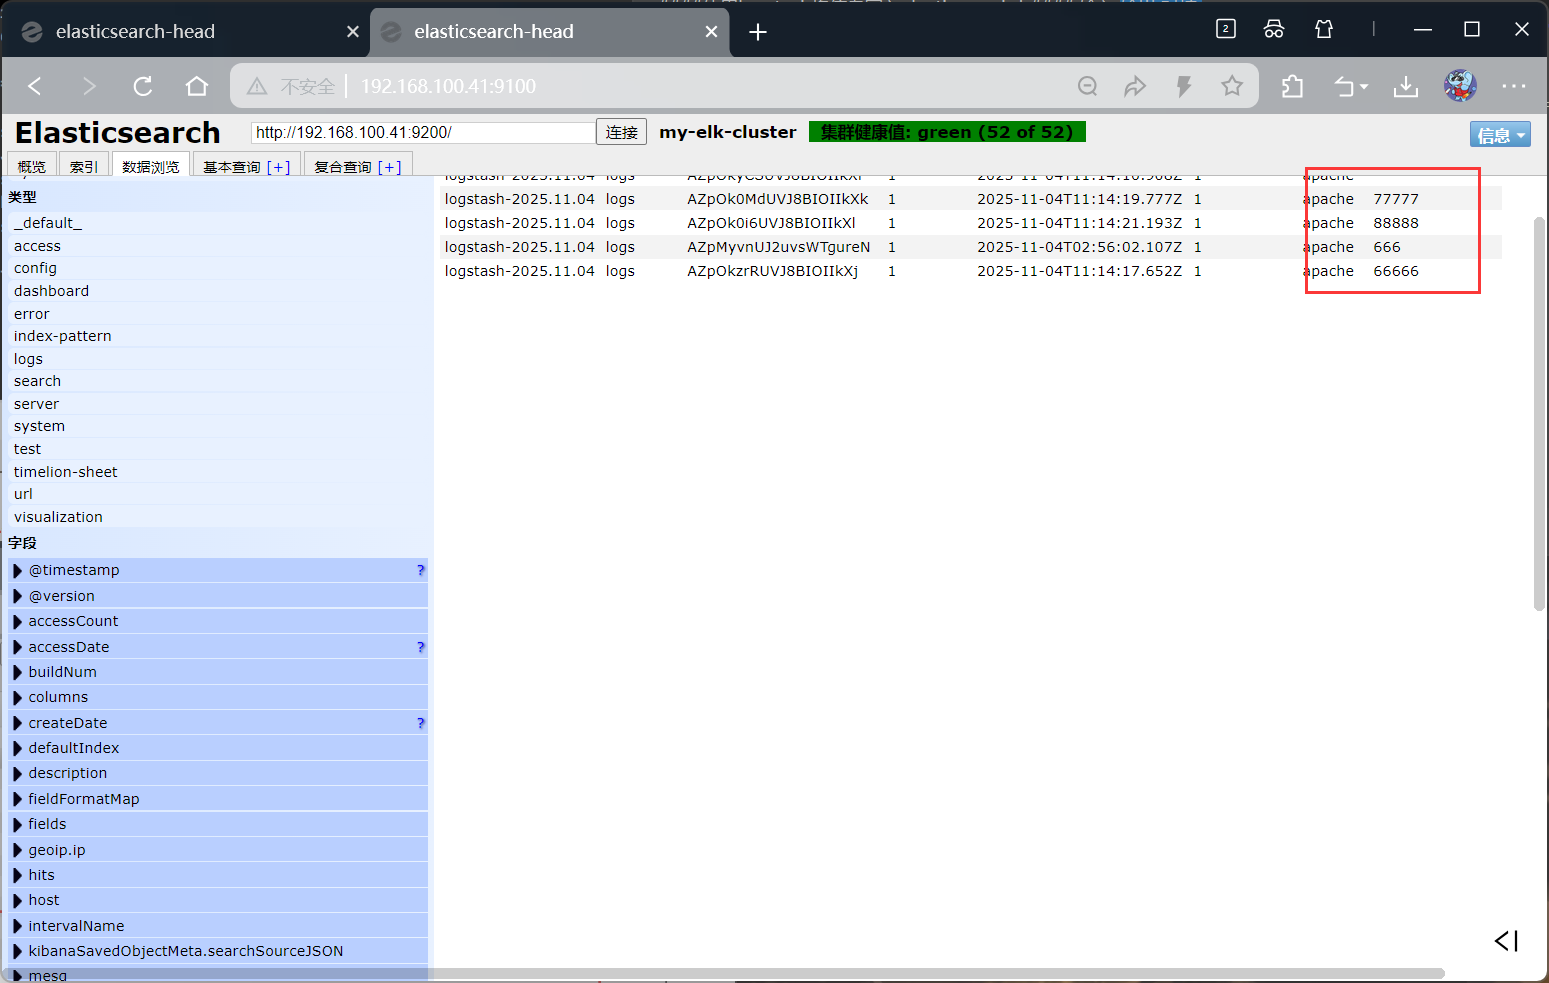
# 输入测试内容(如test elk),在head插件中可看到生成的logstash-*索引
配置日志采集(核心步骤)
Logstash 配置文件放在/etc/logstash/conf.d/目录,支持多配置文件(按日志类型区分)。
[root@apache ~]# chmod o+r /var/log/messages
[root@apache ~]# ll /var/log/messages
-rw----r--. 1 root root 2431054 Nov  4 19:17 /var/log/messages
采集系统日志(/var/log/messages)
创建配置文件/etc/logstash/conf.d/system.conf:
vim /etc/logstash/conf.d/system.conf
配置内容:
input {file{path => "/var/log/messages"type => "system"start_position => "beginning"}}
output {elasticsearch {hosts => ["192.168.100.41:9200"]index => "system-%{+YYYY.MM.dd}"}}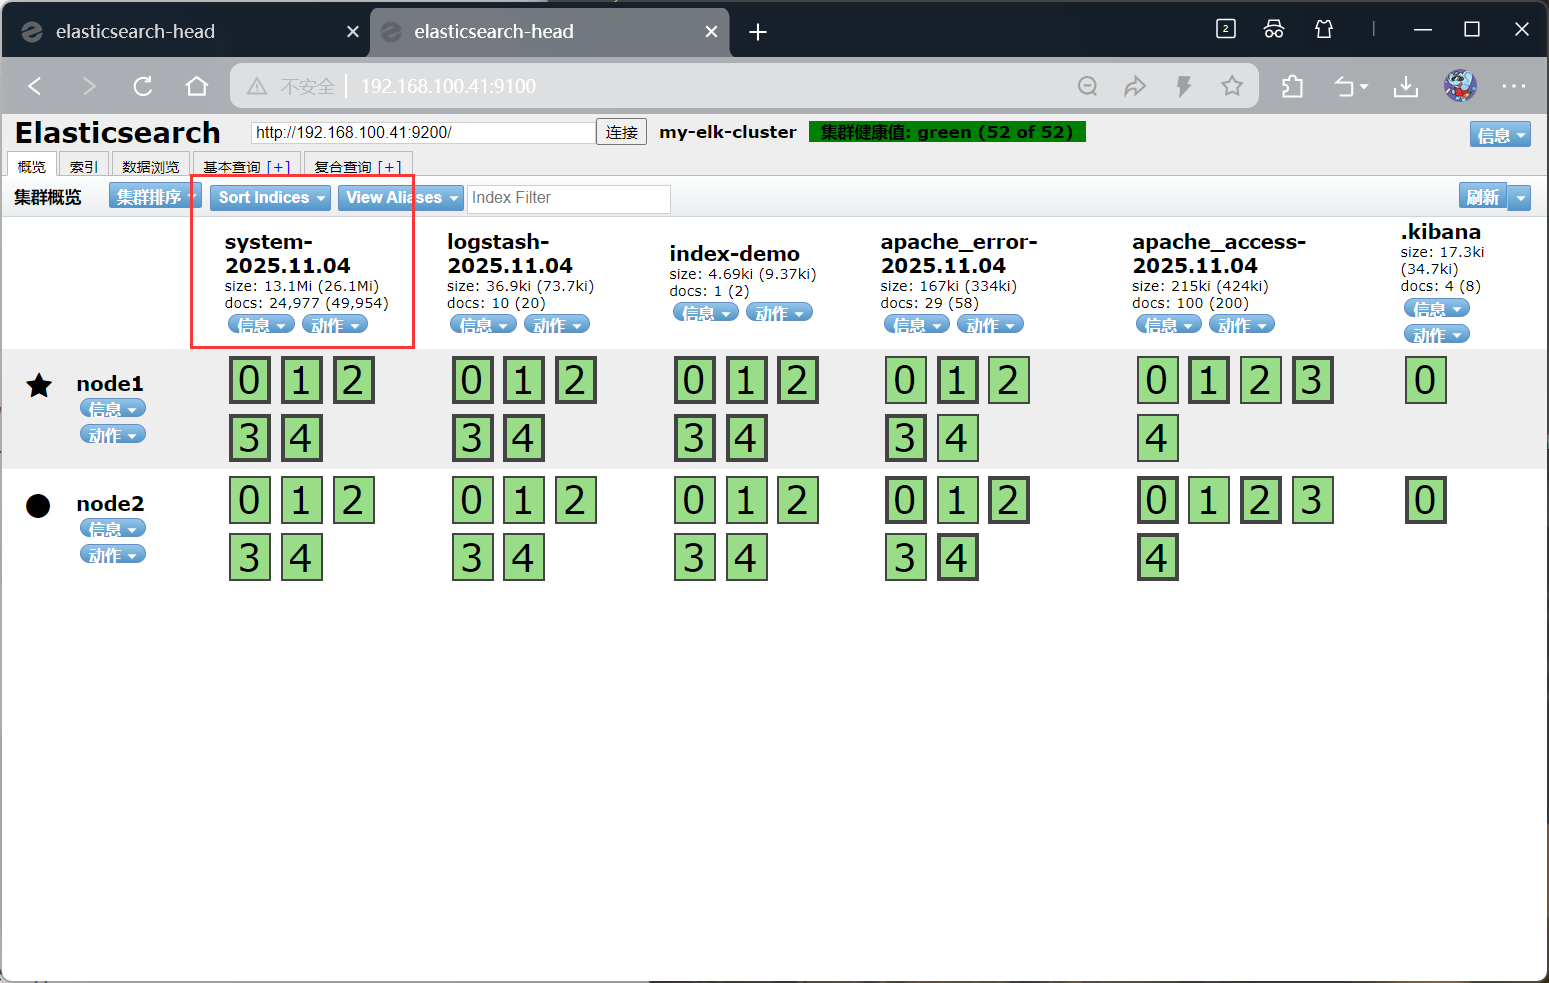
采集 Apache 日志(访问日志 + 错误日志)
创建 Apache 日志采集配置/etc/logstash/conf.d/apache_log.conf:
vim /etc/logstash/conf.d/apache_log.conf
配置内容:
input {file{path => "/var/log/httpd/access_log"type => "access"start_position => "beginning"}file{path => "/var/log/httpd/error_log"type => "error"start_position => "beginning"}}
output {if [type] == "access" {elasticsearch {hosts => ["192.168.100.41:9200"]index => "apache_access-%{+YYYY.MM.dd}"}}if [type] == "error" {elasticsearch {hosts => ["192.168.100.41:9200"]index => "apache_error-%{+YYYY.MM.dd}"}}}
授权日志文件并重启 Logstash
# 重启Logstash(加载新配置)
systemctl restart logstash.service
#启动
[root@apache conf.d]# /usr/share/logstash/bin/logstash -f apache_log.conf
验证日志采集
在 head 插件中查看索引,会生成以下索引(按日期命名):
-
system-202X.MM.dd(系统日志)
-
apache_access-202X.MM.dd(Apache 访问日志)
-
apache_error-202X.MM.dd(Apache 错误日志)
Kibana 部署(node1 节点)
Kibana 用于可视化展示 Elasticsearch 中的日志数据,操作简单无需编码。
安装 Kibana
# 上传安装包到~
cd ~
rpm -ivh kibana-5.5.1-x86_64.rpm
核心配置
备份并编辑配置文件/etc/kibana/kibana.yml:
cp /etc/kibana/kibana.yml /etc/kibana/kibana.yml.bak
vim /etc/kibana/kibana.yml
配置内容:
server.port: 5601                  # Kibana端口(默认5601)
server.host: "0.0.0.0"             # 监听所有IP(允许外部访问)
elasticsearch.url: "http://192.168.100.41:9200" # 连接Elasticsearch
kibana.index: ".kibana"            # Kibana自身数据存储索引
启动并验证
# 启动Kibana并设置开机自启
systemctl start kibana.service
systemctl enable kibana.service
# 验证端口
netstat -lnupt | grep 5601
访问 Kibana 并配置索引
首次访问
浏览器输入:http://192.168.100.41:5601,首次登录需创建 “索引模式”(匹配 Elasticsearch 中的索引)。
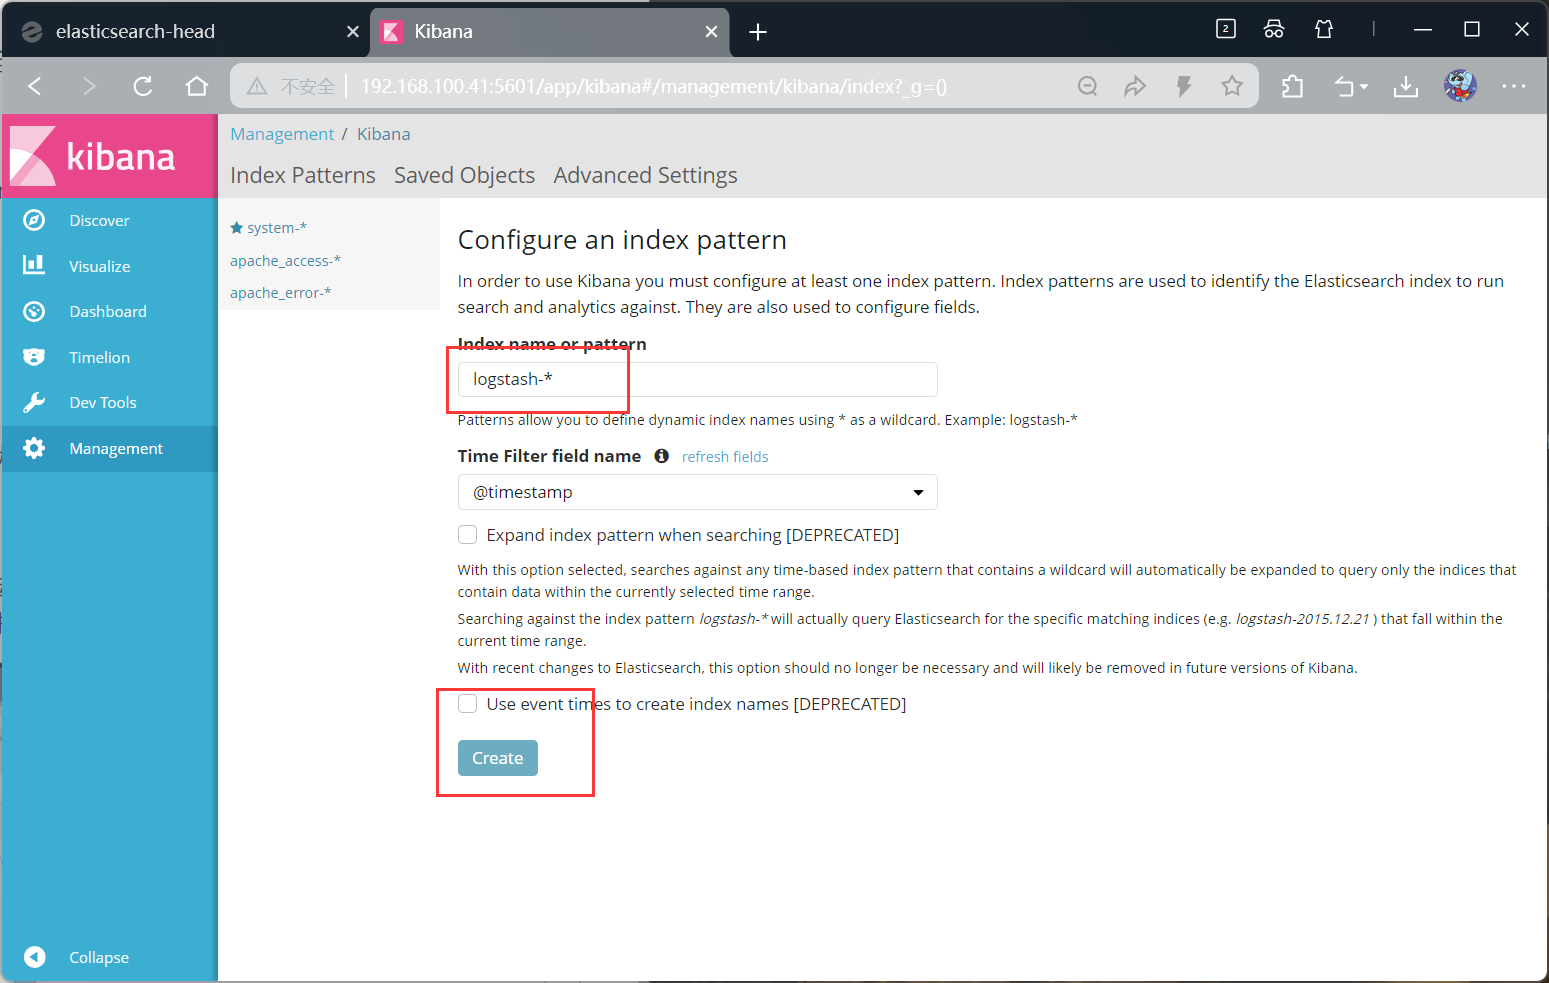
创建索引模式
-
点击左侧菜单栏【Management】→【Index Patterns】→【Create index pattern】
-
输入索引模式(支持通配符):
-
系统日志:system-*
-
Apache 访问日志:apache_access-*
-
Apache 错误日志:apache_error-*
- 点击【Next step】,时间字段选择@timestamp(默认),点击【Create index pattern】。
查看日志数据
点击左侧菜单栏【Discover】,在顶部索引模式下拉框选择对应索引(如apache_access-*),即可看到 Apache 访问日志的详细信息,支持按字段筛选、搜索等操作。

icsearch 中的索引)。
创建索引模式
-
点击左侧菜单栏【Management】→【Index Patterns】→【Create index pattern】
-
输入索引模式(支持通配符):
-
系统日志:system-*
-
Apache 访问日志:apache_access-*
-
Apache 错误日志:apache_error-*
- 点击【Next step】,时间字段选择@timestamp(默认),点击【Create index pattern】。
查看日志数据
点击左侧菜单栏【Discover】,在顶部索引模式下拉框选择对应索引(如apache_access-*),即可看到 Apache 访问日志的详细信息,支持按字段筛选、搜索等操作。
[外链图片转存中…(img-v9KvodHa-1762255481986)]
[外链图片转存中…(img-V3eKUdSS-1762255481986)]