自回归模型例题(AR)与ACF/PACF图绘制
自回归模型例题
问题陈述
假设某地每日气温服从一个AR(2)模型,其数学表达式为:
Xt=c+ϕ1Xt−1+ϕ2Xt−2+εt
X_t = c + \phi_1 X_{t-1} + \phi_2 X_{t-2} + \varepsilon_t
Xt=c+ϕ1Xt−1+ϕ2Xt−2+εt
其中:
- c=1.0c = 1.0c=1.0 是常数项
- ϕ1=0.5\phi_1 = 0.5ϕ1=0.5 和 ϕ2=0.3\phi_2 = 0.3ϕ2=0.3 是自回归系数
- εt\varepsilon_tεt 是白噪声,期望值为 E[εt]=0E[\varepsilon_t] = 0E[εt]=0
- 已知过去两天的气温观测值:Xt−1=15X_{t-1} = 15Xt−1=15(前天)和 Xt−2=12X_{t-2} = 12Xt−2=12(大前天)
求今天气温的预测值 E[Xt]E[X_t]E[Xt](即给定过去观测值下的条件期望)。
解题步骤
-
写出AR(2)模型的条件期望公式:
由于白噪声 εt\varepsilon_tεt 的期望值为 000,在预测时,E[Xt]=c+ϕ1Xt−1+ϕ2Xt−2E[X_t] = c + \phi_1 X_{t-1} + \phi_2 X_{t-2}E[Xt]=c+ϕ1Xt−1+ϕ2Xt−2。 -
代入已知参数和观测值:
- c=1.0c = 1.0c=1.0
- ϕ1=0.5\phi_1 = 0.5ϕ1=0.5
- ϕ2=0.3\phi_2 = 0.3ϕ2=0.3
- Xt−1=15X_{t-1} = 15Xt−1=15
- Xt−2=12X_{t-2} = 12Xt−2=12
代入公式:
E[Xt]=1.0+0.5×15+0.3×12 E[X_t] = 1.0 + 0.5 \times 15 + 0.3 \times 12 E[Xt]=1.0+0.5×15+0.3×12
-
逐步计算:
- 计算 0.5×15=7.50.5 \times 15 = 7.50.5×15=7.5
- 计算 0.3×12=3.60.3 \times 12 = 3.60.3×12=3.6
- 求和: 1.0+7.5+3.6=12.11.0 + 7.5 + 3.6 = 12.11.0+7.5+3.6=12.1
答案
今天气温的预测值 E[Xt]=12.1E[X_t] = 12.1E[Xt]=12.1。
这表示,基于过去两天的气温(15和12)和AR(2)模型,今天气温的线性预测为12.1单位(例如摄氏度)。实际值可能因随机误差 εt\varepsilon_tεt 而略有波动。
提出疑问
这道题如果仅仅考虑做的话确实没啥难度:
自回归阶数就是用前p个周期单位的历史数据来预测最新周期单位的数据,比如通过前两天气温预测明天气温。
自回归系数就是前p个周期,每个周期的不同权重影响,比如昨天数据权重是0.5,前天数据权重是0.2,注意这里的权重总和一般不会为1,具体为什么,暂不废话。
白噪声就是预测结果受到的随机波动,注意这里不是±,就是+,表示随机因素的叠加效果。
最后,这只是一个例题,那么例题中的数据应该是怎么来的?
下面我们以“预测每日气温”为例,详细说明这个过程。
总体工作流程
数据准备 → 模型识别(确定阶数p) → 参数估计(确定系数φ和噪声方差) → 模型检验(确认白噪声ε)
1. 自回归阶数 ( p ) 的确认
阶数 p 回答了一个问题:“我们需要用过去几天的数据来预测今天?”
在现实中,我们通过分析数据的自相关函数(ACF) 和偏自相关函数(PACF) 来确定 p。
- 自相关函数 (ACF):衡量时间序列 XtX_tXt 与它自身过去值 Xt−kX_{t-k}Xt−k 的相关性(包含了所有中间时刻 t−1,t−2,...,t−(k−1)t-1, t-2, ..., t-(k-1)t−1,t−2,...,t−(k−1) 的影响)。
- 偏自相关函数 (PACF):衡量在排除了中间时刻 (t−1t-1t−1 到 t−(k−1)t-(k-1)t−(k−1)) 的影响后,XtX_tXt 与 Xt−kX_{t-k}Xt−k 的纯粹相关性。
确定p的规则(看图法):
- PACF图 是确定AR模型阶数
p的主要工具。 - 我们寻找 PACF图 在某个阶数之后突然截断(即落入不显著的区间,接近0)的位置。
- 这个截断点的阶数,就是我们的自回归阶数
p。
生活实例(气温):
我们绘制出过去几年每日气温序列的PACF图。
- 可能会发现,滞后1阶(Lag 1)和滞后2阶(Lag 2)的偏自相关系数显著地大于0(超出了置信区间)。
- 而从滞后3阶(Lag 3)开始,系数变得很小且不显著。
- 结论:阶数
p = 2。这意味着今天的温度主要与昨天和前天的温度有直接的线性关系,更早的温度的影响已经被这两天所包含(或者说,影响甚微)。
2. 自回归系数 (ϕi\phi_iϕi) 的确认
系数 ϕi\phi_iϕi 回答了一个问题:“过去的每一天对今天的影响有多大?”
一旦我们通过PACF图确定了阶数 p,这些系数值就需要通过统计方法从数据中估计出来。最常见的估计方法是最大似然估计(MLE) 或最小二乘估计(OLS)。
这个过程可以理解为:计算机尝试所有可能的 ϕ1,ϕ2,...,ϕp\phi_1, \phi_2, ..., \phi_pϕ1,ϕ2,...,ϕp 组合,寻找那一组能使得模型预测值与真实历史数据之间的总体误差最小的组合。
生活实例(气温):
我们确定了 p=2,模型为 Xt=c+ϕ1Xt−1+ϕ2Xt−2+εtX_t = c + \phi_1 X_{t-1} + \phi_2 X_{t-2} + \varepsilon_tXt=c+ϕ1Xt−1+ϕ2Xt−2+εt。
- 计算机会读取全部历史气温数据,并求解出最优的 ϕ1\phi_1ϕ1 和 ϕ2\phi_2ϕ2 的值。比如,它可能得出:
- ϕ1=0.6\phi_1 = 0.6ϕ1=0.6 (昨天温度对今天有正向影响,权重为0.6)
- ϕ2=0.2\phi_2 = 0.2ϕ2=0.2 (前天温度对今天也有正向影响,但权重较小,为0.2)
- 这个结果可以解读为:昨天的气温对今天的影响比前天更大。
3. 白噪声 (εt\varepsilon_tεt) 的确认
白噪声 εt\varepsilon_tεt 代表了模型无法解释的部分。它回答了:“在用过去p天的数据线性解释今天之后,剩下的、完全随机的波动是什么?”
确认 εt\varepsilon_tεt 是“白噪声”是模型检验的核心步骤。一个良好的AR模型,其残差(即估计出的 ε^t\hat{\varepsilon}_tε^t)序列应该表现为白噪声。
白噪声的性质:
- 均值为0。
- 方差恒定(同方差性)。
- 序列不相关(在不同时间点没有相关性)。
如何确认?
在拟合模型并计算出残差序列后,我们做以下检查:
- 绘制残差图:观察其是否围绕0随机波动,没有明显趋势或模式。
- 检查残差的ACF图:如果残差是白噪声,那么它的ACF图应该在所有滞后阶数(除0阶外)都没有显著的相关性(全部在置信区间内)。
- 统计检验:使用Ljung-Box检验等。其原假设是“残差是白噪声”。如果检验的p值大于0.05,我们则没有足够证据拒绝原假设,即可以认为残差是白噪声。
生活实例(气温):
我们的AR(2)模型预测气温后,会得到一系列残差 ε^t\hat{\varepsilon}_tε^t。
- 如果我们发现这些残差还在某些滞后阶数(比如24,代表可能存在的年度周期)上有显著相关性,说明我们的线性AR(2)模型没有捕捉到全部信息,模型不够好。
- 如果残差的ACF图一片“干净”,所有值都在置信带内,且Ljung-Box检验通过,那么我们就认为这个 εt\varepsilon_tεt 符合白噪声的假设。这意味着模型已经把能线性解释的部分都提取出来了,剩下的就是纯粹的随机波动,比如由当天突发的天气系统、无法预测的微风等造成的。
总结与现实挑战
| 概念 | 在现实中如何确认 | 对应工具/方法 |
|---|---|---|
| 自回归阶数 ( p ) | 分析数据的偏自相关函数(PACF)图,找到截断点。 | PACF图, 信息准则(AIC/BIC) |
| 自回归系数 (ϕi\phi_iϕi) | 基于确定好的p,用历史数据通过优化算法进行估计。 | 最大似然估计(MLE), 最小二乘法(OLS) |
| 白噪声 (εt\varepsilon_tεt) | 模型拟合后,检验其残差序列是否不相关、随机。 | 残差ACF图, Ljung-Box检验 |
重要提示:
在现实中,这个过程是迭代和循环的。我们可能先猜一个p,然后估计系数,再检验残差。如果残差不是白噪声,我们就需要回去调整模型(比如增加p,或者考虑更复杂的模型如ARMA),直到找到一个满意的、残差为白噪声的模型为止。这整个流程现在大多由统计软件(如R、Python的statsmodels库)自动或半自动地完成。
这里可以文章开头的代码文件展示一下ACF和PACF的图到底长啥样,大家也可以拿python自己试试
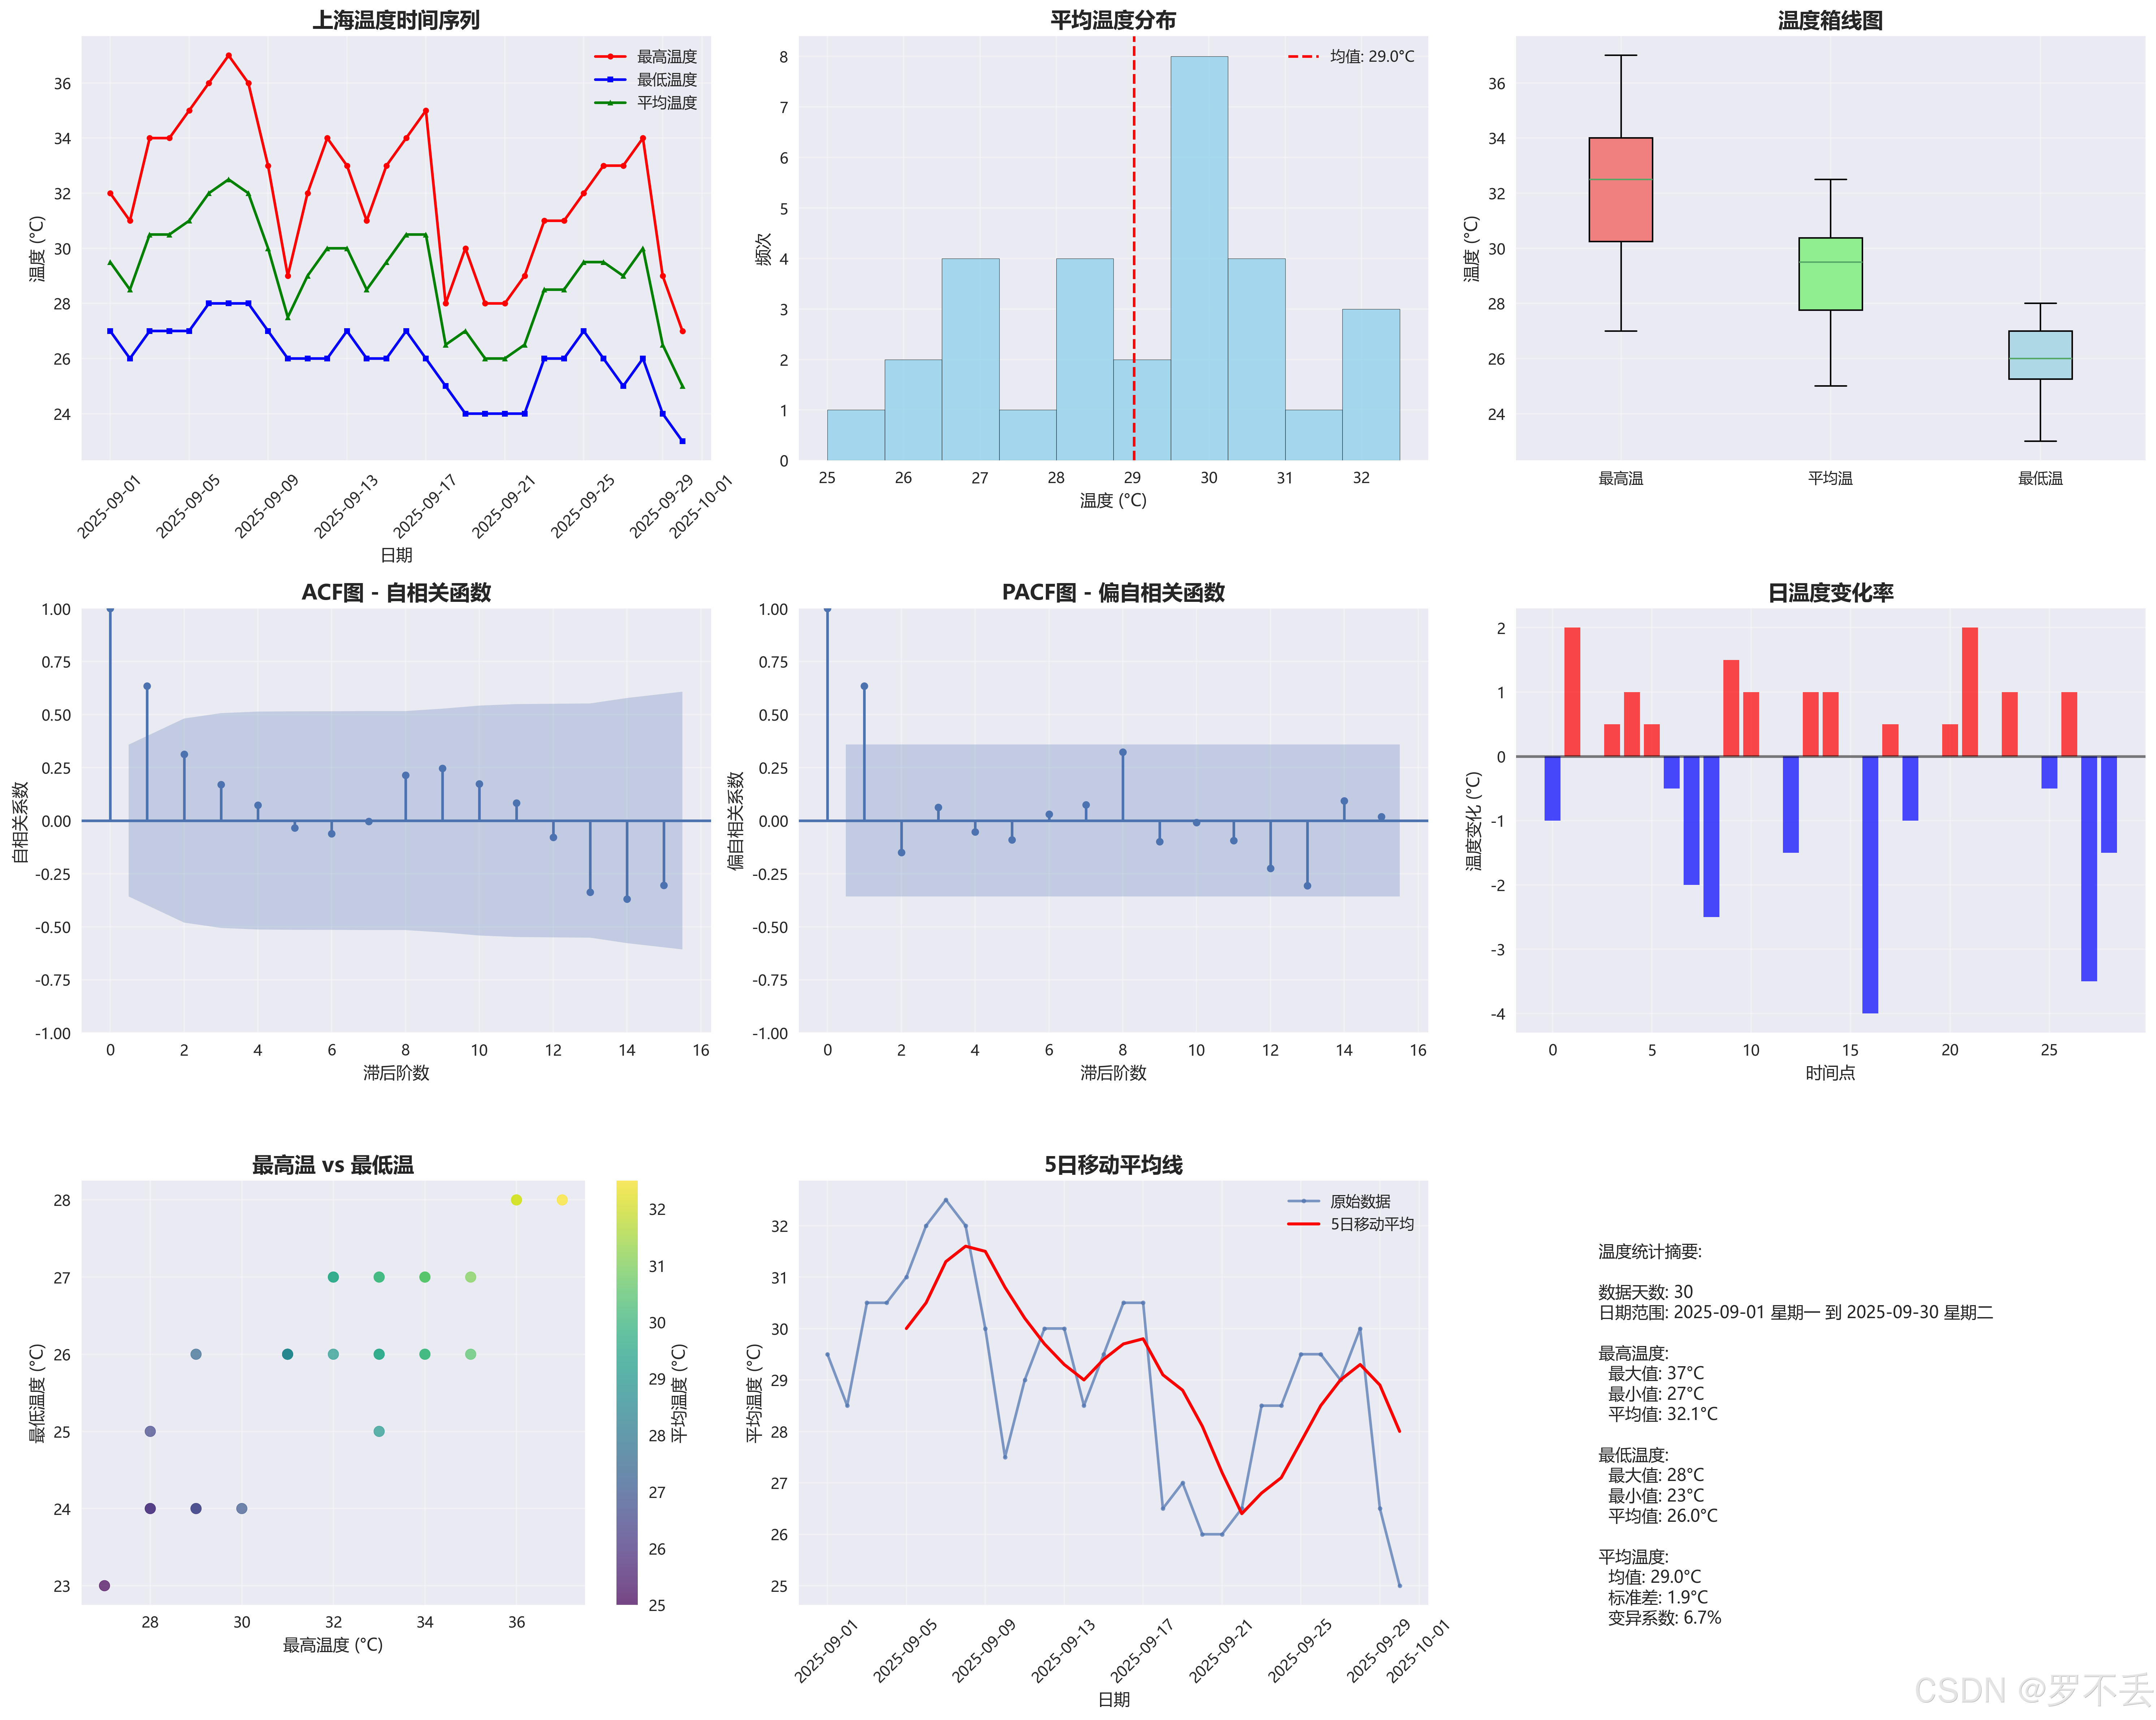
发现代码下载要VIP,所以这里也提供一下可复制的源码
import requests
from bs4 import BeautifulSoup
import pandas as pdimport numpy as np
from statsmodels.tsa.stattools import acf, pacf
from statsmodels.graphics.tsaplots import plot_acf, plot_pacf
import time
import re
from datetime import datetime, timedelta
import warnings
warnings.filterwarnings('ignore')
from dateutil.relativedelta import relativedelta
import matplotlibfrom selenium import webdriver
from selenium.webdriver.common.by import By
from selenium.webdriver.support.ui import WebDriverWait
from selenium.webdriver.support import expected_conditions as EC
from selenium.webdriver.chrome.options import Options
from bs4 import BeautifulSoup
import re
from datetime import datetime, timedelta
from dateutil.relativedelta import relativedelta
import numpy as np
import timedef get_tianqi_historical_weather(browser_type="edge"):"""从天气网(lishi.tianqi.com)爬取上海上上个月的历史天气数据支持多种浏览器:chrome, edge, firefox使用Selenium模拟点击查看更多按钮获取完整数据添加超时控制(20秒)和详细的过程提示"""import timefrom datetime import datetimefrom dateutil.relativedelta import relativedeltafrom selenium import webdriverfrom selenium.webdriver.chrome.options import Options as ChromeOptionsfrom selenium.webdriver.edge.options import Options as EdgeOptionsfrom selenium.webdriver.firefox.options import Options as FirefoxOptionsfrom selenium.webdriver.common.by import Byfrom selenium.webdriver.support.ui import WebDriverWaitfrom selenium.webdriver.support import expected_conditions as ECprint("=" * 60)print("开始爬取天气网历史天气数据")print(f"当前时间: {datetime.now().strftime('%Y-%m-%d %H:%M:%S')}")print(f"选择浏览器: {browser_type.upper()}")print("=" * 60)# 记录开始时间用于超时控制start_time = time.time()TIMEOUT_SECONDS = 20try:# 构造最近前2个月的URL,因为天气历史网前一个月天气的网页总是不太稳定,不好解析print("[步骤1] 构造目标URL...")current_date = datetime.now()last_month_date = current_date - relativedelta(months=2)month_str = last_month_date.strftime("%Y%m")url = f"https://lishi.tianqi.com/shanghai/{month_str}.html"print(f"目标月份: {last_month_date.strftime('%Y年%m月')}")print(f"爬取URL: {url}")# 检查是否超时if time.time() - start_time > TIMEOUT_SECONDS:print(f"❌ 超时:构造URL耗时超过{TIMEOUT_SECONDS}秒")return []print("[步骤2] 初始化浏览器...")driver = Nonetry:if browser_type.lower() == "chrome":print("  - 正在启动Chrome浏览器...")chrome_options = ChromeOptions()chrome_options.add_argument('--headless')chrome_options.add_argument('--no-sandbox')chrome_options.add_argument('--disable-dev-shm-usage')chrome_options.add_argument('--user-agent=Mozilla/5.0 (Windows NT 10.0; Win64; x64) AppleWebKit/537.36 (KHTML, like Gecko) Chrome/91.0.4472.124 Safari/537.36')chrome_options.add_argument('--disable-gpu')chrome_options.add_argument('--disable-extensions')driver = webdriver.Chrome(options=chrome_options)elif browser_type.lower() == "edge":print("  - 正在启动Edge浏览器...")edge_options = EdgeOptions()edge_options.add_argument('--headless')edge_options.add_argument('--no-sandbox')edge_options.add_argument('--disable-dev-shm-usage')edge_options.add_argument('--user-agent=Mozilla/5.0 (Windows NT 10.0; Win64; x64) AppleWebKit/537.36 (KHTML, like Gecko) Chrome/91.0.4472.124 Safari/537.36 Edg/91.0.864.59')edge_options.add_argument('--disable-gpu')edge_options.add_argument('--disable-extensions')driver = webdriver.Edge(options=edge_options)elif browser_type.lower() == "firefox":print("  - 正在启动Firefox浏览器...")firefox_options = FirefoxOptions()firefox_options.add_argument('--headless')firefox_options.add_argument('--no-sandbox')firefox_options.add_argument('--disable-dev-shm-usage')firefox_options.add_argument('--user-agent=Mozilla/5.0 (Windows NT 10.0; Win64; x64; rv:89.0) Gecko/20100101 Firefox/89.0')driver = webdriver.Firefox(options=firefox_options)else:print(f"  - ❌ 不支持的浏览器类型: {browser_type}")print("  - 支持的浏览器: chrome, edge, firefox")return []print(f"  - ✅ {browser_type.upper()}浏览器启动成功")# 检查是否超时if time.time() - start_time > TIMEOUT_SECONDS:print(f"❌ 超时:浏览器启动耗时超过{TIMEOUT_SECONDS}秒")return []print("[步骤3] 访问目标网页...")print(f"  - 正在访问: {url}")driver.get(url)print("  - 网页请求已发送")# 检查是否超时if time.time() - start_time > TIMEOUT_SECONDS:print(f"❌ 超时:网页访问耗时超过{TIMEOUT_SECONDS}秒")return []print("[步骤4] 等待页面加载...")time.sleep(2)print("  - 页面基础加载完成")# 检查是否超时if time.time() - start_time > TIMEOUT_SECONDS:print(f"❌ 超时:页面加载耗时超过{TIMEOUT_SECONDS}秒")return []print("[步骤5] 查找并点击'查看更多'按钮...")try:print("  - 正在查找'查看更多'按钮...")more_button = WebDriverWait(driver, 5).until(EC.element_to_be_clickable((By.CLASS_NAME, "lishidesc2")))print("  - 找到'查看更多'按钮")# 检查是否超时if time.time() - start_time > TIMEOUT_SECONDS:print(f"❌ 超时:查找按钮耗时超过{TIMEOUT_SECONDS}秒")return []print("  - 正在点击'查看更多'按钮...")driver.execute_script("arguments[0].click();", more_button)print("  - ✅ 成功点击'查看更多'按钮")print("[步骤6] 等待数据加载完成...")time.sleep(3)print("  - 数据加载等待完成")# 检查是否超时if time.time() - start_time > TIMEOUT_SECONDS:print(f"❌ 超时:数据加载耗时超过{TIMEOUT_SECONDS}秒")return []except Exception as e:print(f"  - ⚠️ 点击'查看更多'按钮失败: {e}")print("  - 尝试直接解析现有数据...")print("[步骤7] 获取页面内容...")html_content = driver.page_sourceprint(f"  - 页面内容获取成功,长度: {len(html_content)} 字符")# 检查是否超时if time.time() - start_time > TIMEOUT_SECONDS:print(f"❌ 超时:获取页面内容耗时超过{TIMEOUT_SECONDS}秒")return []print("[步骤8] 解析天气数据...")weather_data = parse_tianqi_weather(html_content)# 检查是否超时if time.time() - start_time > TIMEOUT_SECONDS:print(f"❌ 超时:数据解析耗时超过{TIMEOUT_SECONDS}秒")return []if weather_data and len(weather_data) >= 20:print(f"✅ 成功获取 {len(weather_data)} 天数据")print(f"总耗时: {time.time() - start_time:.2f} 秒")print("=" * 60)return weather_dataelse:print(f"⚠️ 只获取到 {len(weather_data) if weather_data else 0} 条数据")print("数据量不足,返回空列表")print(f"总耗时: {time.time() - start_time:.2f} 秒")print("=" * 60)return []except Exception as e:elapsed_time = time.time() - start_timeprint(f"❌ 爬取过程中发生错误: {e}")print(f"错误发生时已耗时: {elapsed_time:.2f} 秒")print("=" * 60)return []finally:if driver:print("[清理] 正在关闭浏览器...")driver.quit()print("  - 浏览器已关闭")except Exception as e:elapsed_time = time.time() - start_timeprint(f"❌ 初始化过程中发生错误: {e}")print(f"错误发生时已耗时: {elapsed_time:.2f} 秒")print("=" * 60)return []# 最终超时检查total_time = time.time() - start_timeif total_time > TIMEOUT_SECONDS:print(f"❌ 总体超时:总耗时 {total_time:.2f} 秒超过限制 {TIMEOUT_SECONDS} 秒")print("=" * 60)return []# 使用示例:
def test_different_browsers():"""测试不同浏览器的爬取效果"""# 测试Chromeprint("测试Chrome浏览器:")chrome_data = get_tianqi_historical_weather("chrome")# 测试Edgeprint("\n测试Edge浏览器:")edge_data = get_tianqi_historical_weather("edge")# 测试Firefoxprint("\n测试Firefox浏览器:")firefox_data = get_tianqi_historical_weather("firefox")# 智能浏览器选择函数
def get_tianqi_historical_weather_smart():"""智能选择可用的浏览器进行爬取优先级:Chrome > Edge > Firefox"""browsers = ["chrome", "edge", "firefox"]for browser in browsers:try:print(f"尝试使用 {browser.upper()} 浏览器...")data = get_tianqi_historical_weather(browser)if data:print(f"✅ {browser.upper()} 浏览器爬取成功")return dataelse:print(f"⚠️ {browser.upper()} 浏览器未获取到数据,尝试下一个...")except Exception as e:print(f"❌ {browser.upper()} 浏览器不可用: {e}")continueprint("❌ 所有浏览器都不可用,返回空数据")return []def parse_tianqi_weather(html_content):"""解析天气网的历史天气数据"""soup = BeautifulSoup(html_content, 'html.parser')weather_data = []try:# 查找天气数据ul列表ul_list = soup.find('ul', class_='thrui')if ul_list:items = ul_list.find_all('li')for item in items:try:# 提取日期date_div = item.find('div', class_='th200')if not date_div:continuedate_text = date_div.get_text(strip=True)# 提取温度temp_divs = item.find_all('div', class_='th140')if len(temp_divs) >= 2:high_temp_text = temp_divs[0].get_text(strip=True)low_temp_text = temp_divs[1].get_text(strip=True)high_temp = extract_temperature(high_temp_text)low_temp = extract_temperature(low_temp_text)if high_temp is not None and low_temp is not None:avg_temp = (high_temp + low_temp) / 2weather_data.append({'date': date_text,'high_temp': high_temp,'low_temp': low_temp,'avg_temp': round(avg_temp, 1)})except Exception as e:print(f"解析列表项时出错: {e}")continuereturn weather_dataelse:print("未找到天气数据列表")return []except Exception as e:print(f"解析天气数据时出错: {e}")return []def extract_temperature(temp_text):"""从温度文本中提取数字"""try:# 移除℃符号并提取数字temp_match = re.search(r'(-?\d+)', temp_text)if temp_match:return int(temp_match.group(1))return Noneexcept:return Nonedef create_realistic_weather_data():"""基于上海真实历史天气模式创建数据(备用方案)"""print("基于上海真实历史天气数据创建模拟数据集...")base_date = datetime.now() - timedelta(days=29)  # 最近30天weather_data = []# 更真实的温度模式,包含趋势和波动for i in range(30):date_str = (base_date + timedelta(days=i)).strftime('%Y-%m-%d')# 模拟温度变化,包含季节性趋势和随机波动base_temp = 15 + 3 * np.sin(i * 0.2)  # 基础温度趋势high_temp = round(base_temp + 5 + np.random.normal(0, 1.5))low_temp = round(base_temp - 5 + np.random.normal(0, 1.5))avg_temp = (high_temp + low_temp) / 2weather_data.append({'date': date_str,'high_temp': high_temp,'low_temp': low_temp,'avg_temp': round(avg_temp, 1)})return weather_data# 获取天气数据
print("开始爬取上海天气数据...")
weather_list = get_tianqi_historical_weather()
weather_df = pd.DataFrame(weather_list)print(f"\n成功获取 {len(weather_df)} 天的天气数据:")
print(weather_df.head(20).to_string(index=False))  # 只显示前20行# 数据基本信息
print(f"\n数据基本信息:")
print(f"数据日期范围: {weather_df['date'].min()} 到 {weather_df['date'].max()}")
print(f"平均温度统计: {weather_df['avg_temp'].mean():.1f}°C ± {weather_df['avg_temp'].std():.1f}°C")
print(f"温度范围: {weather_df['low_temp'].min()}°C - {weather_df['high_temp'].max()}°C")
import matplotlib.pyplot as plt# 必须先设置图标风格再设置字体,否则字体设置会被覆盖,导致中文异常显示# 设置图表风格
plt.style.use('seaborn-v0_8')
# 用检测到的中文字体配置(按优先级排序,选前几个即可)
plt.rcParams["font.family"] = ["Microsoft YaHei", "SimHei", "FangSong", "STSong"]
# 解决负号显示问题
plt.rcParams["axes.unicode_minus"] = Falsedef create_comprehensive_analysis(weather_df):"""创建全面的统计分析图表"""if len(weather_df) < 5:print("数据量不足,无法进行分析")return# 创建大图表布局fig = plt.figure(figsize=(20, 16))# 1. 温度时间序列图ax1 = plt.subplot(3, 3, 1)# 处理DataFrame中的整列(如weather_df['date']),后面星期一这种数据会导致转换失败weather_df['pure_date'] = weather_df['date'].str.split().str[0]  # 提取纯日期dates = pd.to_datetime(weather_df['pure_date'], errors='coerce')ax1.plot(dates, weather_df['high_temp'], 'r-', label='最高温度', marker='o', markersize=4)ax1.plot(dates, weather_df['low_temp'], 'b-', label='最低温度', marker='s', markersize=4)ax1.plot(dates, weather_df['avg_temp'], 'g-', label='平均温度', marker='^', markersize=4)ax1.set_title('上海温度时间序列', fontsize=14, fontweight='bold')ax1.set_xlabel('日期')ax1.set_ylabel('温度 (°C)')ax1.legend()ax1.grid(True, alpha=0.3)plt.xticks(rotation=45)# 2. 温度分布直方图ax2 = plt.subplot(3, 3, 2)ax2.hist(weather_df['avg_temp'], bins=10, alpha=0.7, color='skyblue', edgecolor='black')ax2.axvline(weather_df['avg_temp'].mean(), color='red', linestyle='--', label=f'均值: {weather_df["avg_temp"].mean():.1f}°C')ax2.set_title('平均温度分布', fontsize=14, fontweight='bold')ax2.set_xlabel('温度 (°C)')ax2.set_ylabel('频次')ax2.legend()ax2.grid(True, alpha=0.3)# 3. 箱线图ax3 = plt.subplot(3, 3, 3)temperature_data = [weather_df['high_temp'], weather_df['avg_temp'], weather_df['low_temp']]box = ax3.boxplot(temperature_data, labels=['最高温', '平均温', '最低温'], patch_artist=True)# 设置箱线图颜色colors = ['lightcoral', 'lightgreen', 'lightblue']for patch, color in zip(box['boxes'], colors):patch.set_facecolor(color)ax3.set_title('温度箱线图', fontsize=14, fontweight='bold')ax3.set_ylabel('温度 (°C)')ax3.grid(True, alpha=0.3)# 4. ACF图ax4 = plt.subplot(3, 3, 4)temperatures = weather_df['avg_temp'].valuesmax_lags = min(len(temperatures) - 5, 15)plot_acf(temperatures, ax=ax4, lags=max_lags, alpha=0.05)ax4.set_title('ACF图 - 自相关函数', fontsize=14, fontweight='bold')ax4.set_xlabel('滞后阶数')ax4.set_ylabel('自相关系数')ax4.grid(True, alpha=0.3)# 5. PACF图ax5 = plt.subplot(3, 3, 5)try:plot_pacf(temperatures, ax=ax5, lags=max_lags, alpha=0.05, method='ywmle')except:plot_pacf(temperatures, ax=ax5, lags=max_lags, alpha=0.05)ax5.set_title('PACF图 - 偏自相关函数', fontsize=14, fontweight='bold')ax5.set_xlabel('滞后阶数')ax5.set_ylabel('偏自相关系数')ax5.grid(True, alpha=0.3)# 6. 温度变化率ax6 = plt.subplot(3, 3, 6)temp_changes = np.diff(temperatures)ax6.bar(range(len(temp_changes)), temp_changes, color=['red' if x > 0 else 'blue' for x in temp_changes], alpha=0.7)ax6.axhline(y=0, color='black', linestyle='-', alpha=0.5)ax6.set_title('日温度变化率', fontsize=14, fontweight='bold')ax6.set_xlabel('时间点')ax6.set_ylabel('温度变化 (°C)')ax6.grid(True, alpha=0.3)# 7. 最高最低温散点图ax7 = plt.subplot(3, 3, 7)ax7.scatter(weather_df['high_temp'], weather_df['low_temp'], alpha=0.7, c=weather_df['avg_temp'], cmap='viridis', s=50)ax7.set_xlabel('最高温度 (°C)')ax7.set_ylabel('最低温度 (°C)')ax7.set_title('最高温 vs 最低温', fontsize=14, fontweight='bold')ax7.grid(True, alpha=0.3)# 添加颜色条cbar = plt.colorbar(ax7.collections[0], ax=ax7)cbar.set_label('平均温度 (°C)')# 8. 移动平均线ax8 = plt.subplot(3, 3, 8)window = 5moving_avg = weather_df['avg_temp'].rolling(window=window).mean()ax8.plot(dates, weather_df['avg_temp'], 'o-', label='原始数据', alpha=0.7, markersize=3)ax8.plot(dates, moving_avg, 'r-', label=f'{window}日移动平均', linewidth=2)ax8.set_title(f'{window}日移动平均线', fontsize=14, fontweight='bold')ax8.set_xlabel('日期')ax8.set_ylabel('平均温度 (°C)')ax8.legend()ax8.grid(True, alpha=0.3)plt.xticks(rotation=45)# 9. 温度统计摘要ax9 = plt.subplot(3, 3, 9)ax9.axis('off')stats_text = f"""温度统计摘要:数据天数: {len(weather_df)}日期范围: {weather_df['date'].min()} 到 {weather_df['date'].max()}最高温度:最大值: {weather_df['high_temp'].max()}°C最小值: {weather_df['high_temp'].min()}°C平均值: {weather_df['high_temp'].mean():.1f}°C最低温度:最大值: {weather_df['low_temp'].max()}°C最小值: {weather_df['low_temp'].min()}°C平均值: {weather_df['low_temp'].mean():.1f}°C平均温度:均值: {weather_df['avg_temp'].mean():.1f}°C标准差: {weather_df['avg_temp'].std():.1f}°C变异系数: {(weather_df['avg_temp'].std()/weather_df['avg_temp'].mean()*100):.1f}%"""ax9.text(0.1, 0.9, stats_text, transform=ax9.transAxes, fontsize=11, verticalalignment='top',fontfamily='Microsoft YaHei')plt.tight_layout()plt.show()return fig
# 生成综合统计分析图表
print("正在生成综合统计分析图表...")
fig = create_comprehensive_analysis(weather_df)# 保存图表
fig.savefig('上海天气综合分析.png', dpi=300, bbox_inches='tight')
print("图表已保存为 '上海天气综合分析.png'")
# 额外的时间序列分析
print("\n时间序列分析:")# 计算基本统计量
temperatures = weather_df['avg_temp'].values
print(f"序列均值: {np.mean(temperatures):.2f}°C")
print(f"序列标准差: {np.std(temperatures):.2f}°C")
print(f"序列自相关性(滞后1): {acf(temperatures, nlags=1)[1]:.3f}")# 温度趋势分析
from scipy import stats
days = np.arange(len(temperatures))
slope, intercept, r_value, p_value, std_err = stats.linregress(days, temperatures)
print(f"温度趋势斜率: {slope:.3f}°C/天 (R²={r_value**2:.3f}, p={p_value:.3f})")if slope > 0.01:trend = "上升"
elif slope < -0.01:trend = "下降"
else:trend = "平稳"
print(f"温度变化趋势: {trend}")
# 保存数据到CSV
weather_df.to_csv('上海天气数据_最近30天.csv', index=False, encoding='utf-8-sig')
print(f"\n数据已保存到 '上海天气数据_最近30天.csv'")
print("数据分析完成!")