EL(F)K日志分析系统
1 概述
早期IT架构中的系统和应用的日志分散在不同的主机和文件,如果应用出现问题,开发和运维人员想排
查原因,就要先找到相应的主机上的日志文件再进行查找和分析,所以非常不方便,而且还涉及到权限
安全问题,ELK的出现就很好的解决这一问题
ELK 是由一家 Elastic 公司开发的三个开源项目的首字母缩写,即是三个相关的项目组成的系统
这三个项目分别是:Elasticsearch、Logstash 和 Kibana。三个项目各有不同的功能
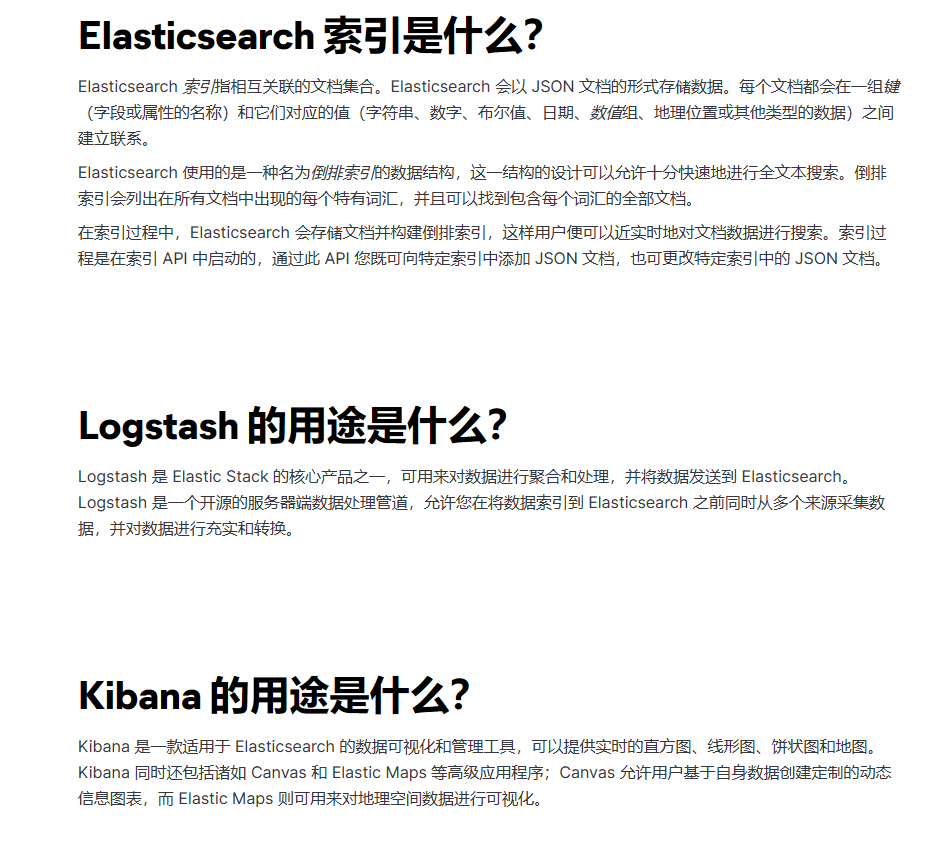
- Elasticsearch 是一个实时的全文搜索,存储库和分析引擎。
- Logstash 是数据处理的管道,能够同时从多个来源采集数据,转换数据,然后将数据发送到诸如Elasticsearch 等存储库中。
- Kibana 则可以让用户在 Elasticsearch 中使用图形和图表对数据进行可视化。
Elastic Stack 是一套适用于数据采集、扩充、存储、分析和可视化的免费开源工具。
目前 Elastic Stack 包括一系列丰富的轻量型数据采集代理,这些代理统称为 Beats,可用来向Elasticsearch 发送数据。
ELK 版本演进: 0.X,1.X,2,X,5.X,6,X,7.X,8.X …
官网: https://www.elastic.co/
ELK官方介绍: https://www.elastic.co/cn/what-is/elk-stack
ELK 下载链接: https://www.elastic.co/cn/downloads/
ELK 说明: https://www.elastic.co/guide/cn/index.html
ELK 权威指南: https://www.elastic.co/guide/cn/elasticsearch/guide/current/index.html
ELK stack的主要优点:
- 功能强大:Elasticsearch 是实时全文索引,具有强大的搜索功能
- 配置相对简单:Elasticsearch 全部基于 JSON,Logstash使用模块化配置,Kibana的配置都比较简单。
- 检索性能高效:基于优秀的设计,每次查询可以实时响应,即使百亿级数据的查询也能达到秒级响应。
- 集群线性扩展:Elasticsearch 和 Logstash都可以灵活线性扩展
- 前端操作方便:Kibana提供了比较美观UI前端,操作也比较简单
官方下载
https://www.elastic.co/cn/downloads/
EFK 由ElasticSearch、Fluentd和Kibana三个开源工具组成。
Fluentd是一个实时开源的数据收集器,和logstash功能相似,这三款开源工具的组合为日志数据提供了分布式的实时搜集与分析的监控系统。
Fluentd官网和文档:
https://www.fluentd.org/
https://docs.fluentd.org/
2 Elasticsearch 部署与管理
Elasticsearch 基于 Java 语言开发,利用全文搜索引擎 Apache Lucene 实现
- Elasticsearch 很快
- Elasticsearch 具有分布式的本质特征
- Elasticsearch 包含一系列广泛的功能
- Elastic Stack 简化了数据采集、可视化和报告过程
Elasticsearch 是一个分布式的免费开源搜索和分析引擎,适用于包括文本、数字、地理空间、结构化和非结构化数据等在内的所有类型的数据。
Elasticsearch 基于 Java 语言实现
2.1 Elasticsearch 安装说明
官方文档
https://www.elastic.co/guide/en/elastic-stack/index.html
https://www.elastic.co/guide/en/elasticsearch/reference/master/install-elasticsearch.html
部署方式
- 包安装
- 二进制安装
- Docker 部署
- Ansible 批量部署
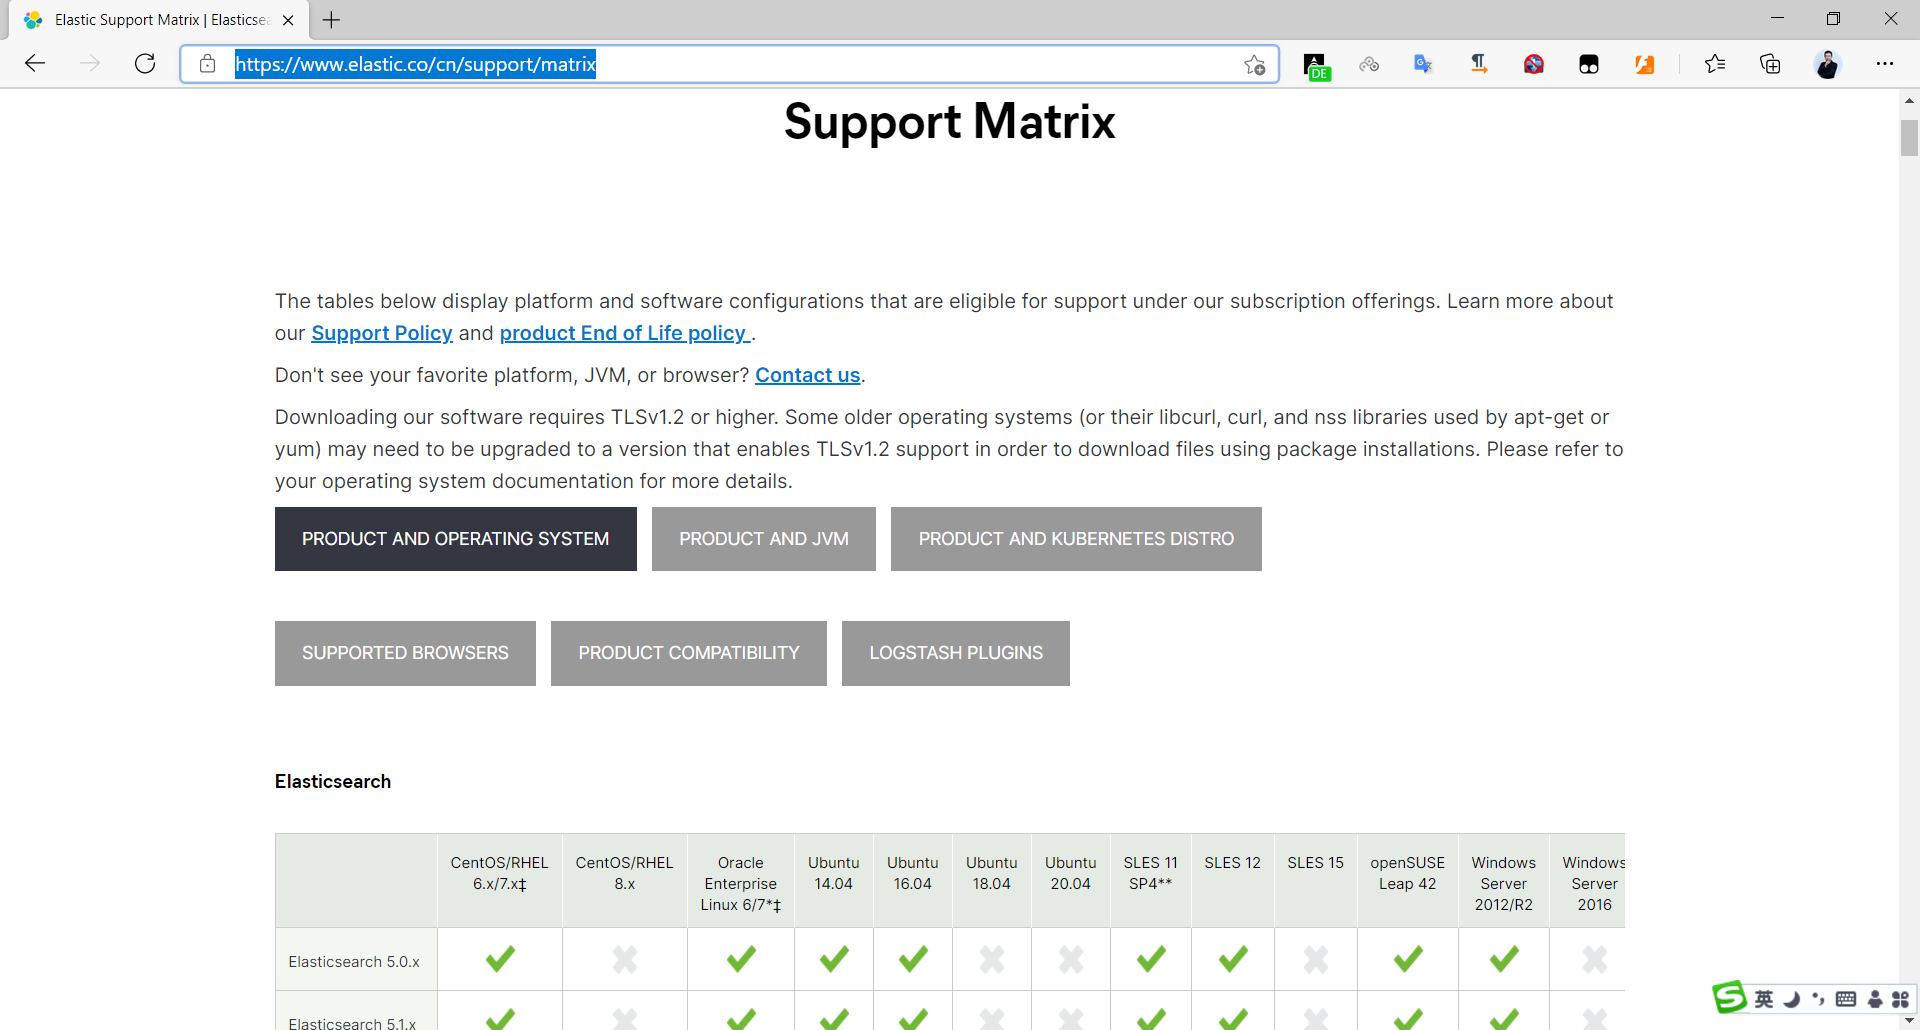
ES支持操作系统版本和 Java 版本官方说明
https://www.elastic.co/cn/support/matrix
2.2 Elasticsearch 安装前准备
2.2.1 安装前环境初始化
CPU 2C
内存4G或更多
操作系统: Ubuntu22.04,Ubuntu20.04,Ubuntu18.04,Rocky8.X,Centos 7.X
操作系统盘50G
主机名设置规则为nodeX.dinginx.org
生产环境建议准备单独的数据磁盘
2.2.1.1 主机名
#各服务器配置自己的主机名
[root@ubuntu2004 ~]# hostnamectl set-hostname es-node01.dinginx.org
[root@ubuntu2004 ~]# hostnamectl set-hostname es-node02.dinginx.org
[root@ubuntu2004 ~]# hostnamectl set-hostname es-node03.dinginx.org
2.2.1.2 关闭防火墙和SELinux
关闭防所有服务器的防火墙和 SELinux#RHEL系列的系统执行下以下配置
[root@es-node01 ~]# systemctl disable firewalld
[root@es-node01 ~]# systemctl disable NetworkManager
[root@es-node01 ~]# sed -i '/SELINUX/s/enforcing/disabled/' /etc/selinux/config
[root@es-node01 ~]# reboot
2.2.1.3 各服务器配置本地域名解析
#es-node01、es-node02、es-node03三节点执行cat >> /etc/hosts <<EOF
11.0.1.101 es-node01.dinginx.org
11.0.1.102 es-node02.dinginx.org
11.0.1.103 es-node03.dinginx.org
EOF
2.2.1.4 优化资源限制配置
2.2.1.4.1 修改内核参数
内核参数 vm.max_map_count 用于限制一个进程可以拥有的VMA(虚拟内存区域)的数量
使用默认系统配置,二进制安装时会提示下面错误,包安装会自动修改此配置

#查看默认值
[root@es-node01 ~]#sysctl -a|grep vm.max_map_count
vm.max_map_count = 65530#修改配置
[root@es-node01 ~]#echo "vm.max_map_count = 262144" >> /etc/sysctl.conf
[root@es-node01 ~]#sysctl -p
vm.max_map_count = 262144#设置系统最大打开的文件描述符数
[root@es-node01 ~]#echo "fs.file-max = 11.0.10" >> /etc/sysctl.conf
[root@es-node01 ~]#sysctl -p
vm.max_map_count = 262144
fs.file-max = 11.0.10#Ubuntu20.04/22.04默认值已经满足要求
[root@ubuntu2204 ~]#sysctl fs.file-max
fs.file-max = 9223372036854775807
范例: Ubuntu 基于包安装后会自动修改文件
root@ubuntu2204:~# cat /usr/lib/sysctl.d/elasticsearch.conf
vm.max_map_count=262144
2.2.1.4.2 修改资源限制配置(可选)
#在node节点执行cat >> /etc/security/limits.conf <<EOF
*               soft   core           unlimited
*               hard   core           unlimited
*               soft   nproc           11.0.10
*               hard   nproc           11.0.10
*               soft   nofile          11.0.10
*               hard   nofile          11.0.10
*               soft   memlock         32000
*               hard   memlock         32000
*               soft   msgqueue        8192000
*               hard   msgqueue        8192000
EOF
2.2.2 安装 Java 环境 (可选)
Elasticsearch 是基于java的应用,所以依赖JDK环境
注意: 安装7.X以后版本官方建议要安装集成JDK的包,所以无需再专门安装 JDK
关于JDK环境说明
1.x 2.x 5.x 6.x都没有集成JDK的安装包,也就是需要自己安装java环境
7.x 版本的安装包分为带JDK和不带JDK两种包,带JDK的包在安装时不需要再安装java,如果不带JDK的包
仍然需要自己去安装java
8.X 版本内置JDK,不再支持自行安装的JDK
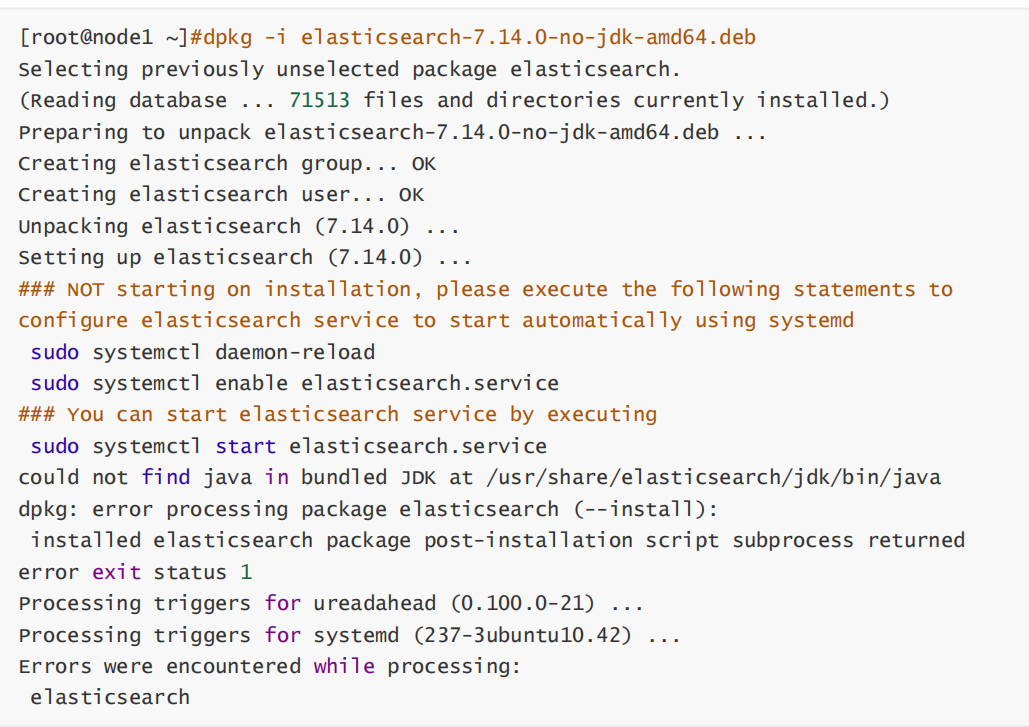
如果安装no-jdk的包,才需要安装java环境
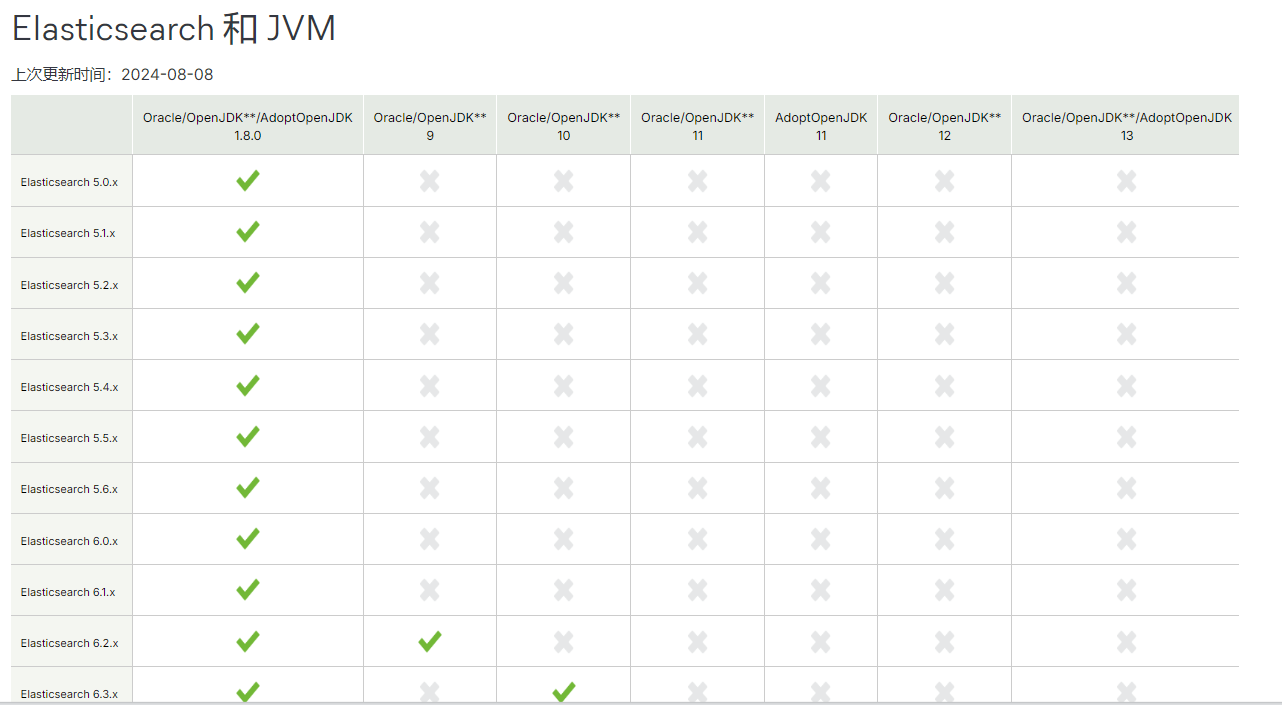
官网JAVA版支持说明
https://www.elastic.co/cn/support/matrix#matrix_jvm
因为 Elasticsearch 服务运行需要 Java环境,如果要安装没有JDK的包,需要提前安装JAVA环境,可以使用以下方式安装
如果没有java 环境,安装elasticsearch时会出下面错误提示
方式一:直接使用包管理器yum/apt安装openjdk
[root@es-node01 ~]#yum -y install java-1.8.0-openjdk
[root@es-node01 ~]#apt update;apt -y install openjdk-8-jdk
方式二:本地安装在oracle官网下载rpm安装包:
[root@es-node01 ~]# yum -y install jdk-8u92-linux-x64.rpm
方式三:安装二进制包并自定义环境变量
下载地址: http://www.oracle.com/technetwork/java/javase/downloads/jdk8-downloads-2133151.html
[root@es-node01 ~]# tar xvf jdk-8u121-linux-x64.tar.gz -C /usr/local/
[root@es-node01 ~]# ln -sv /usr/local/jdk1.8.0_121 /usr/local/jdk
[root@es-node01 ~]# ln -sv /usr/local/jdk/bin/java /usr/bin/
[root@es-node01 ~]# vim /etc/profile
export HISTTIMEFORMAT="%F %T `whoami` "
export JAVA_HOME=/usr/local/jdk
export CLASSPATH=.:$JAVA_HOME/jre/lib/rt.jar:$JAVA_HOME/lib/dt.jar:$JAVA_HOME/lib/tools.jar
export PATH=$PATH:$JAVA_HOME/bin
[root@es-node01 ~]# source /etc/profile
[root@es-node01 ~]# java -version
java version "1.8.0_121" 	#确认可以出现当前的java版本号
Java(TM) SE Runtime Environment (build 1.8.0_121-b13)
Java HotSpot(TM) 64-Bit Server VM (build 25.121-b13, mixed mode)
2.3 Elasticsearch 安装
有两种包: 包含jdk和no-jdk的包
注意: 官方提示no-jdk的包将被淘汰,建议使用包含JDK的包
下载地址:
#包含JDK的版本下载
https://www.elastic.co/downloads/elasticsearch
https://mirrors.tuna.tsinghua.edu.cn/elasticstack/
#不包含JDK的版本下载
https://www.elastic.co/cn/downloads/elasticsearch-no-jdk
范例: 查看两种包
[root@es-node01 ~]#ll -h elasticsearch-8.14.3-amd64.deb
-rw-r--r-- 1 root root 562M Sep 23 21:53 elasticsearch-8.14.3-amd64.deb
2.3.1 包安装 Elasticsearch
2.3.1.1 安装 Elasticsearch 包
下载链接
https://www.elastic.co/cn/downloads/elasticsearch
https://mirrors.tuna.tsinghua.edu.cn/elasticstack/
#下载包
[root@es-node01 ~]#wget https://mirrors.tuna.tsinghua.edu.cn/elasticstack/8.x/apt/pool/main/e/elasticsearch/elasticsearch-8.14.3-amd64.deb
[root@es-node01 ~]#ll -h elasticsearch-8.14.3-amd64.deb
-rw-r--r-- 1 root root 562M Sep 23 21:53 elasticsearch-8.14.3-amd64.deb#内置jdk环境包安装
[root@es-node01 ~]#dpkg -i elasticsearch-8.14.3-amd64.deb
Selecting previously unselected package elasticsearch.
(Reading database ... 72068 files and directories currently installed.)
Preparing to unpack elasticsearch-8.14.3-amd64.deb ...
Creating elasticsearch group... OK
Creating elasticsearch user... OK
Unpacking elasticsearch (8.14.3) ...
Setting up elasticsearch (8.14.3) ...
--------------------------- Security autoconfiguration information ------------------------------Authentication and authorization are enabled.
TLS for the transport and HTTP layers is enabled and configured.The generated password for the elastic built-in superuser is : kN_N*jTGvq0UxL+lnjY2If this node should join an existing cluster, you can reconfigure this with
'/usr/share/elasticsearch/bin/elasticsearch-reconfigure-node --enrollment-token <token-here>'
after creating an enrollment token on your existing cluster.You can complete the following actions at any time:Reset the password of the elastic built-in superuser with
'/usr/share/elasticsearch/bin/elasticsearch-reset-password -u elastic'.Generate an enrollment token for Kibana instances with '/usr/share/elasticsearch/bin/elasticsearch-create-enrollment-token -s kibana'.Generate an enrollment token for Elasticsearch nodes with
'/usr/share/elasticsearch/bin/elasticsearch-create-enrollment-token -s node'.-------------------------------------------------------------------------------------------------
### NOT starting on installation, please execute the following statements to configure elasticsearch service to start automatically using systemdsudo systemctl daemon-reloadsudo systemctl enable elasticsearch.service
### You can start elasticsearch service by executingsudo systemctl start elasticsearch.service##内置JAVA
[root@es-node01 ~]#dpkg -L elasticsearch
[root@es-node01 ~]#/usr/share/elasticsearch/jdk/bin/java -version
openjdk version "22.0.1" 2024-04-16
OpenJDK Runtime Environment (build 22.0.1+8-16)
OpenJDK 64-Bit Server VM (build 22.0.1+8-16, mixed mode, sharing)#JVM优化
#########################JVM优化#################################
## IMPORTANT: JVM heap size
################################################################
##
## The heap size is automatically configured by Elasticsearch
## based on the available memory in your system and the roles
## each node is configured to fulfill. If specifying heap is
## required, it should be done through a file in jvm.options.d,
## which should be named with .options suffix, and the min and
## max should be set to the same value. For example, to set the
## heap to 4 GB, create a new file in the jvm.options.d
## directory containing these lines:
##
## -Xms4g
-Xms512m
## -Xmx4g
-Xms512m
##
## See https://www.elastic.co/guide/en/elasticsearch/reference/8.14/heap-size.html
## for more information
##
################################################################[root@es-node01 ~]#systemctl enable --now elasticsearch.service		#启动服务#默认8.X开启xpack安全,导致无法直接访问
[root@es-node01 ~]#curl 127.0.0.1:9200
curl: (52) Empty reply from server##关闭xpack安全功能......# Enable security features
xpack.security.enabled: false		#true改为false......[root@es-node01 ~]#curl 127.0.0.1:9200
{"name" : "es-node01.dinginx.org","cluster_name" : "elasticsearch","cluster_uuid" : "qG1IJ-a8QwCO7JFAJExb2w","version" : {"number" : "8.14.3","build_flavor" : "default","build_type" : "deb","build_hash" : "d55f984299e0e88dee72ebd8255f7ff130859ad0","build_date" : "2024-07-07T22:04:49.882652950Z","build_snapshot" : false,"lucene_version" : "9.10.0","minimum_wire_compatibility_version" : "7.17.0","minimum_index_compatibility_version" : "7.0.0"},"tagline" : "You Know, for Search"
}
2.3.1.2 编辑服务配置文件
参考文档:
https://www.ibm.com/support/knowledgecenter/zh/SSFPJS_8.5.6/com.ibm.wbpm.main.doc/topics/rfps_esearch_configoptions.html
https://www.elastic.co/guide/en/elasticsearch/reference/index.html
https://www.elastic.co/guide/en/elasticsearch/reference/master/settings.html
https://www.elastic.co/guide/en/elasticsearch/reference/master/important-settings.html
配置文件说明
[root@es-node01 ~]# grep "^[a-Z]" /etc/elasticsearch/elasticsearch.yml#ELK集群名称,单节点无需配置,同一个集群内每个节点的此项必须相同,新加集群的节点此项和其它节点相同即可加入集群,而无需再验证
cluster.name: ELK-Cluster #当前节点在集群内的节点名称,同一集群中每个节点要确保此名称唯一
node.name: es-node01 #ES 数据保存目录,包安装默认路径:/var/lib/elasticsearch/
path.data: /data/es-data #ES 日志保存目录,包安装默认路径:/var/llog/elasticsearch/
path.logs: /data/es-logs#服务启动的时候立即分配(锁定)足够的内存,防止数据写入swap,提高启动速度,但是true会导致启动失败,需要优化
bootstrap.memory_lock: true#指定该节点用于集群的监听IP,默认监听在127.0.0.1:9300,集群模式必须修改此行,单机默认即可
network.host: 0.0.0.0 #监听端口
http.port: 9200#发现集群的node节点列表,可以添加部分或全部节点IP
#在新增节点到已有集群时,此处需指定至少一个已经在集群中的节点地址
discovery.seed_hosts: ["11.0.1.101", "11.0.1.102","11.0.1.103"]#集群初始化时指定希望哪些节点可以被选举为 master,只在初始化时使用,新加节点到已有集群时此项可不配置
cluster.initial_master_nodes: ["11.0.1.101", "11.0.1.102","11.0.1.103"]#一个集群中的 N 个节点启动后,才允许进行数据恢复处理,默认是1,一般设为为所有节点的一半以上,防止出现脑裂现象
#当集群无法启动时,可以将之修改为1,或者将下面行注释掉,实现快速恢复启动
gateway.recover_after_nodes: 2#设置是否可以通过正则表达式或者_all匹配索引库进行删除或者关闭索引库,默认true表示必须需要明确指定索引库名称,不能使用正则表达式和_all,生产环境建议设置为 true,防止误删索引库。
action.destructive_requires_name: true#如果不参与主节点选举设为false,默认值为true
node.master: false#存储数据,默认值为true,此值为false则不存储数据而成为一个路由节点
#如果将原有的true改为false,需要先执行/usr/share/elasticsearch/bin/elasticsearch-noderepurpose 清理数据
node.data: true#7.x以后版本下面指令已废弃,在2.x 5.x 6.x 版本中用于配置节点发现列表
discovery.zen.ping.unicast.hosts: ["11.0.1.101", "11.0.1.102","11.0.1.103"]#8.X版后默认即开启Xpack功能,可以修改为false禁用
xpack. security. enabled : true#开启跨域访问支持,默认为false
http.cors.enabled: true# 跨域访问允许的域名地址,(允许所有域名)以上使用正则
http.cors.allow-origin: "*"
范例:8.X 单机配置
#8.X版,修改配置文件一行即可
[root@ubuntu2204 ~]#vim /etc/elasticsearch/elasticsearch.yml
path.data: /var/lib/elasticsearch
path.logs: /var/log/elasticsearch
#network.host: 0.0.0.0         #保留注释此行
xpack.security.enabled: false  #只需要修改此行true为false即可,其它行默认即可
xpack.security.enrollment.enabled: true
xpack.security.http.ssl:enabled: truekeystore.path: certs/http.p12
xpack.security.transport.ssl:enabled: trueverification_mode: certificatekeystore.path: certs/transport.p12truststore.path: certs/transport.p12
cluster.initial_master_nodes: ["ubuntu2204.dinginx.org"]  #默认此行不做修改
http.host: 0.0.0.0
[root@ubuntu2204 ~]#systemctl enable --now elasticsearch.service #查看9200和9300端口
root@ubuntu2204:~# ss -ntl|grep -E '9200|9300'
LISTEN 0      4096   [::ffff:127.0.0.1]:9300            *:*
LISTEN 0      4096                [::1]:9300         [::]:*
LISTEN 0      4096                    *:9200            *:*  #测试访问
root@ubuntu2204:~# curl 11.0.1.10:9200
{"name" : "ubuntu2204","cluster_name" : "elasticsearch","cluster_uuid" : "Lur3kHLqQLiHIQPds_8JMw","version" : {"number" : "8.8.2","build_flavor" : "default","build_type" : "deb","build_hash" : "98e1271edf932a480e4262a471281f1ee295ce6b","build_date" : "2023-06-26T05:16:16.196344851Z","build_snapshot" : false,"lucene_version" : "9.6.0","minimum_wire_compatibility_version" : "7.17.0","minimum_index_compatibility_version" : "7.0.0"},"tagline" : "You Know, for Search"
}
范例:8.X 集群配置
[root@es-node01 ~]#grep -Ev '^(#|$)'  /etc/elasticsearch/elasticsearch.yml
cluster.name: elk-cluster
node.name: es-node01
path.data: /data/es-data
path.logs: /data/es-logs
network.host: 0.0.0.0          #集群模式必须修改此行,默认是127.0.0.1:9300,否则集群节点无法通过9300端口通信每个节点相同
bootstrap.memory_lock: true
http.port: 9200
discovery.seed_hosts: ["11.0.1.101", "11.0.1.102","11.0.1.103"]		#修改此行,每个节点相同
cluster.initial_master_nodes: ["11.0.1.101", "11.0.1.102","11.0.1.103"]		#修改此行,每个节点相同,和下面重复
action.destructive_requires_name: true
xpack.security.enabled: false			#修改此行,每个节点相同
xpack.security.enrollment.enabled: true
xpack.security.http.ssl:enabled: truekeystore.path: certs/http.p12
xpack.security.transport.ssl:enabled: trueverification_mode: certificatekeystore.path: certs/transport.p12truststore.path: certs/transport.p12#cluster.initial_master_nodes: ["es-node01.dinginx.org"]		 #将此行注释
http.host: 0.0.0.0#创建存放路径并授权
[root@es-node01 ~]#mkdir /data/{es-data,es-logs} && chown elasticsearch. /data/es-* && systemctl restart elasticsearch.service#打开9200和9300端口
[root@es-node03 ~]#ss -ntl|grep -E '9200|9300'
LISTEN   0        4096                   *:9300                *:*
LISTEN   0        4096                   *:9200                *:*  #访问测试
[root@es-node01 ~]#curl http://127.0.0.1:9200/_cluster/health?pretty=true
{"cluster_name" : "elk-cluster","status" : "green","timed_out" : false,"number_of_nodes" : 3,"number_of_data_nodes" : 3,"active_primary_shards" : 0,"active_shards" : 0,"relocating_shards" : 0,"initializing_shards" : 0,"unassigned_shards" : 0,"delayed_unassigned_shards" : 0,"number_of_pending_tasks" : 0,"number_of_in_flight_fetch" : 0,"task_max_waiting_in_queue_millis" : 0,"active_shards_percent_as_number" : 100.0
}#查看集群信息
[root@es-node01 ~]#curl 'http://127.0.0.1:9200/_cat/nodes?v'
ip         heap.percent ram.percent cpu load_1m load_5m load_15m node.role   master name
11.0.1.102           32          97   0    0.40    0.51     0.44 cdfhilmrstw -      es-node02
11.0.1.101           23          96   1    1.01    0.53     0.41 cdfhilmrstw *      es-node01
11.0.1.103           21          96   0    0.42    0.48     0.43 cdfhilmrstw -      es-node03
2.3.1.3 优化 ELK 资源配置
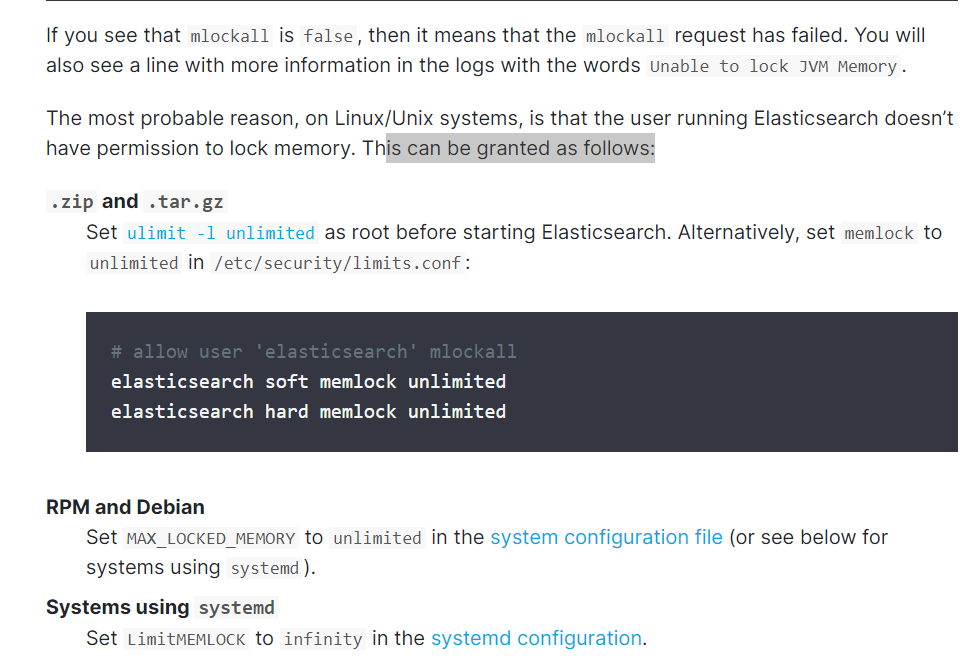
2.3.1.3.1 开启 bootstrap.memory_lock 优化
开启 bootstrap.memory_lock: true 可以优化性能,但会导致无法启动的错误解决方法
注意:开启 bootstrap.memory_lock: true 需要足够的内存,建议4G以上,否则内存不足,启动会很慢
官方文档:
https://www.elastic.co/guide/en/elasticsearch/reference/current/setup-configuration-memory.html#bootstrap-memory_lock
https://www.elastic.co/guide/en/elasticsearch/reference/current/setting-system-settings.html#systemd
[root@node01 ~]#vim /etc/elasticsearch/elasticsearch.yml
#开启此功能导致无法启动
bootstrap.memory_lock: true
[root@node01 ~]#systemctl restart elasticsearch.service
Job for elasticsearch.service failed because the control process exited with
error code.
See "systemctl status elasticsearch.service" and "journalctl -xe" for details.
[root@node01 ~]#tail /data/es-logs/es-cluster.log#方法1:直接修改elasticsearch.service
[root@node01 ~]#vim /lib/systemd/system/elasticsearch.service
[Service]
#加下面一行
LimitMEMLOCK=infinity
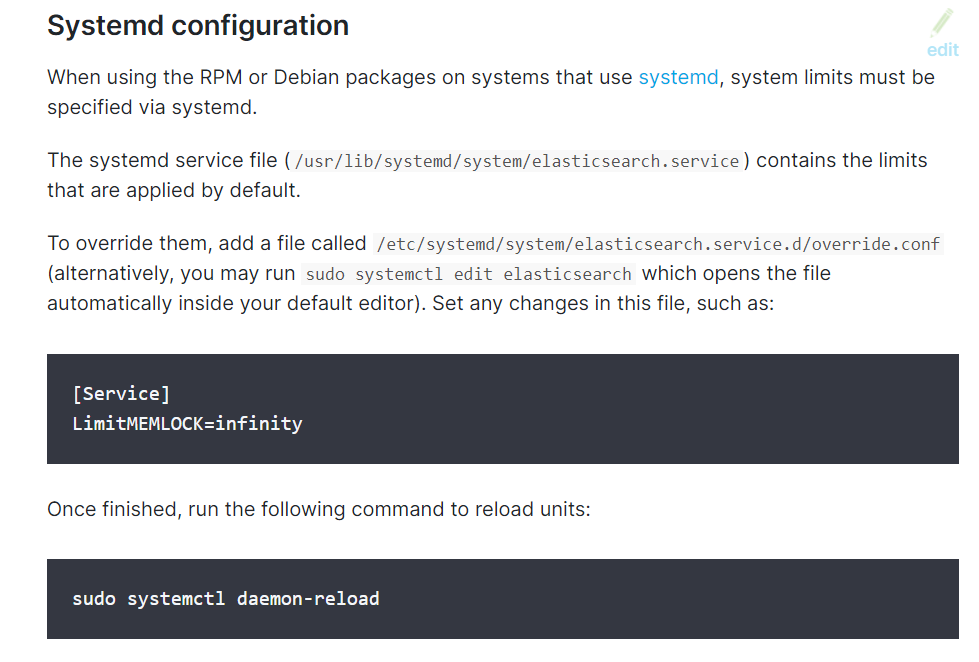
#方法2:新建文件
[root@node01 ~]#systemctl edit elasticsearch
### Anything between here and the comment below will become the new contents of
the file
#加下面两行,注意加在中间位置
[Service]
LimitMEMLOCK=infinity
### Lines below this comment will be discarded
[root@node01 ~]#cat /etc/systemd/system/elasticsearch.service.d/override.conf
[Service]
LimitMEMLOCK=infinity
[root@node01 ~]#systemctl daemon-reload
[root@node01 ~]#systemctl restart elasticsearch.service
[root@node01 ~]#systemctl is-active elasticsearch.service
active
#测试访问是否成功
[root@node01 ~]#curl http://node01.dinginx.com:9200
[root@node01 ~]#curl http://node02.dinginx.com:9200
[root@node01 ~]#curl http://node03.dinginx.com:9200
2.3.1.3.2 内存优化
官方文档:
https://www.elastic.co/guide/en/elasticsearch/reference/current/important-settings.html#heap-size-settings#关于heap内存大小
## 虽然JVM可以处理大量的堆内存,但是将堆内存设置为过大的值可能导致以下问题:
堆内存分配的效率低
操作系统内存管理的限制
垃圾回收(Garbage Collection, GC): 压力变大
对象指针的大小: 在某些JVM实现(例如Oracle的HotSpot),在堆(Heap)大小超过32GB之后,对象指针的表示将从32位压缩oops(Ordinary Object Pointers)转变为64位非压缩指针,这导致了内存使用的增加。
推荐使用宿主机物理内存的一半,ES的heap内存最大不超过30G,26G是比较安全的
内存优化建议:
为了保证性能,每个ES节点的JVM内存设置具体要根据 node 要存储的数据量来估算,建议符合下面约定
- 在内存和数据量有一个建议的比例:对于一般日志类文件,1G 内存能存储48G~96GB数据
- JVM 堆内存最大不要超过30GB
- 单个分片控制在30-50GB,太大查询会比较慢,索引恢复和更新时间越长;分片太小,会导致索引碎片化越严重,性能也会下降
范例:
#假设总数据量为1TB,3个node节点,1个副本;那么实际要存储的大小为2TB
每个节点需要存储的数据量为: 2TB / 3 = 700GB,每个节点还需要预留20%的空间,所以每个node要存储大约 700*100/80=875GB 的数据;每个节点按照内存与存储数据的比率计算:875GB/48GB=18,即需要JVM内存为18GB,小于30GB
因为要尽量控制分片的大小为30GB;875GB/30GB=30个分片,即最多每个节点有30个分片#思考:假设总数据量为2TB,3个node节点,1个副本呢?
范例:指定heap内存最小和最大内存限制
#建议将heap内存设置为物理内存的一半且最小和最大设置一样大,但最大不能超过30G
[root@es-node01 ~]# vim /etc/elasticsearch/jvm.options
-Xms30g
-Xmx30g#每天产生1TB左右的数据量的建议服务器配置,还需要定期清理磁盘
16C 64G 6T硬盘 共3台服务器
范例: 修改service文件,做优化配置
[root@es-node01 ~]# vim /usr/lib/systemd/system/elasticsearch.service #修改内存限制
LimitNOFILE=11.0.10  #修改最大打开的文件数,默认值为65535
LimitNPROC=65535   #修改打开最大的进程数,默认值为4096
LimitMEMLOCK=infinity #无限制使用内存,以前旧版需要修改,否则无法启动服务,当前版本无需修改
内存锁定的配置参数:
https://discuss.elastic.co/t/memory-lock-not-working/70576
2.3.1.4 目录权限更改
在各个ES服务器创建数据和日志目录并修改目录权限为elasticsearch
#创建存放路径并授权,#必须分配权限,否则服务无法启动
[root@es-node01 ~]#mkdir /data/{es-data,es-logs} && chown elasticsearch. /data/es-* && systemctl restart elasticsearch.service[root@es-node01 ~]#ll /data/
total 32
drwxr-xr-x  5 root          root           4096 Sep 24 13:05 ./
drwxr-xr-x 21 root          root           4096 Sep  7  2023 ../
drwxr-xr-x  4 elasticsearch elasticsearch  4096 Sep 24 14:02 es-data/
drwxr-xr-x  2 elasticsearch elasticsearch  4096 Sep 24 13:14 es-logs/
drwx------  2 root          root          16384 Sep  7  2023 lost+found/
2.3.1.5 启动 Elasticsearch 服务并验证
#启动
[root@es-node01 ~]# systemctl enable --now elasticsearch
[root@es-node01 ~]# id elasticsearch
uid=113(elasticsearch) gid=117(elasticsearch) groups=117(elasticsearch)
[root@es-node01 ~]#ps aux|grep elasticsearch
root       10621  0.0  0.2  21876  9840 pts/3    S+   12:18   0:00 vim /etc/elasticsearch/elasticsearch.yml
elastic+   13029  0.1  2.6 2541072 105284 ?      Ssl  13:14   0:05 /usr/share/elasticsearch/jdk/bin/java -Xms4m -Xmx64m -XX:+UseSerialGC -Dcli.name=server -Dcli.script=/usr/share/elasticsearch/bin/elasticsearch -Dcli.libs=lib/tools/server-cli -Des.path.home=/usr/share/elasticsearch -Des.path.conf=/etc/elasticsearch -Des.distribution.type=deb -cp /usr/share/elasticsearch/lib/*:/usr/share/elasticsearch/lib/cli-launcher/* org.elasticsearch.launcher.CliToolLauncher -p /var/run/elasticsearch/elasticsearch.pid --quiet
elastic+   13102  1.6 21.5 3308948 858060 ?      Sl   13:14   0:51 /usr/share/elasticsearch/jdk/bin/java -Des.networkaddress.cache.ttl=60 -Des.networkaddress.cache.negative.ttl=10 -Djava.security.manager=allow -XX:+AlwaysPreTouch -Xss1m -Djava.awt.headless=true -Dfile.encoding=UTF-8 -Djna.nosys=true -XX:-OmitStackTraceInFastThrow -Dio.netty.noUnsafe=true -Dio.netty.noKeySetOptimization=true -Dio.netty.recycler.maxCapacityPerThread=0 -Dlog4j.shutdownHookEnabled=false -Dlog4j2.disable.jmx=true -Dlog4j2.formatMsgNoLookups=true -Djava.locale.providers=SPI,COMPAT --add-opens=java.base/java.io=org.elasticsearch.preallocate --add-opens=org.apache.lucene.core/org.apache.lucene.store=org.elasticsearch.vec --enable-native-access=org.elasticsearch.nativeaccess -XX:ReplayDataFile=/var/log/elasticsearch/replay_pid%p.log -Djava.library.path=/usr/share/elasticsearch/lib/platform/linux-x64:/usr/java/packages/lib:/usr/lib64:/lib64:/lib:/usr/lib -Djna.library.path=/usr/share/elasticsearch/lib/platform/linux-x64:/usr/java/packages/lib:/usr/lib64:/lib64:/lib:/usr/lib -Des.distribution.type=deb -XX:+UnlockDiagnosticVMOptions -XX:G1NumCollectionsKeepPinned=11.0.100 -Xms512m -Xmx512m -XX:+UseG1GC -Djava.io.tmpdir=/tmp/elasticsearch-285470383223225162 --add-modules=jdk.incubator.vector -XX:+HeapDumpOnOutOfMemoryError -XX:+ExitOnOutOfMemoryError -XX:HeapDumpPath=/var/lib/elasticsearch -XX:ErrorFile=/var/log/elasticsearch/hs_err_pid%p.log -Xlog:gc*,gc+age=trace,safepoint:file=/var/log/elasticsearch/gc.log:utctime,level,pid,tags:filecount=32,filesize=64m -XX:MaxDirectMemorySize=268435456 -XX:G1HeapRegionSize=4m -XX:InitiatingHeapOccupancyPercent=30 -XX:G1ReservePercent=15 --module-path /usr/share/elasticsearch/lib --add-modules=jdk.net --add-modules=ALL-MODULE-PATH -m org.elasticsearch.server/org.elasticsearch.bootstrap.Elasticsearch
elastic+   13122  0.0  0.2 108944  8868 ?        Sl   13:14   0:00 /usr/share/elasticsearch/modules/x-pack-ml/platform/linux-x86_64/bin/controller
root       15002  0.0  0.0   6432   720 pts/4    S+   14:07   0:00 grep --color=auto elasticsearch#查看监听port,9200端口集群访问端口,9300集群同步端口
[root@es-node01 ~]#ss -ntlp|grep java
LISTEN    0         4096                     *:9200                   *:*        users:(("java",pid=13102,fd=445))
LISTEN    0         4096                     *:9300                   *:*        users:(("java",pid=13102,fd=443))   #显示如下信息,表示服务启动,但不意味着集群是健康的
[root@es-node01 ~]#curl 127.0.0.1:9200
{"name" : "es-node01","cluster_name" : "elk-cluster","cluster_uuid" : "UgMCqg2JTWyBtLAaA_SbJw","version" : {"number" : "8.14.3","build_flavor" : "default","build_type" : "deb","build_hash" : "d55f984299e0e88dee72ebd8255f7ff130859ad0","build_date" : "2024-07-07T22:04:49.882652950Z","build_snapshot" : false,"lucene_version" : "9.10.0","minimum_wire_compatibility_version" : "7.17.0","minimum_index_compatibility_version" : "7.0.0"},"tagline" : "You Know, for Search"
}##显示如下信息表示集群是健康的
[root@es-node01 ~]#curl 127.0.0.1:9200/_cat/health
1727158170 06:09:30 elk-cluster green 3 3 0 0 0 0 0 0 - 100.0%
2.4 Elasticsearch 访问
官方文档
https://www.elastic.co/guide/en/elasticsearch/reference/master/rest-apis.html
Elasticsearch 支持各种语言使用 RESTful API 通过端口 9200 与之进行通信,可以用你习惯的 web 客户端访问 Elasticsearch
可以用三种方式和 Elasticsearch进行交互
- curl 命令和其它浏览器: 基于命令行,操作不方便
- 插件: 在node节点上安装head,Cerebro 等插件,实现图形操作,查看数据方便
- Kibana: 需要java环境并配置,图形操作,显示格式丰富
2.4.1 Shell 命令
https://www.elastic.co/guide/en/elasticsearch/reference/current/query-dsl-match-query.html
https://nasuyun.com/docs/api/
Elasticsearch 提供了功能十分丰富、多种表现形式的查询 DSL**(Domain Specific Language领域特定语言)**语言
DSL 查询使用 JSON 格式的请求体与 Elasticsearch 交互,可以实现各种各样的增删改查等功能
2.4.1.1 查看 ES 集群状态
访问 ES
#查看支持的指令
curl http://127.0.0.1:9200/_cat#查看es集群状态
curl http://127.0.0.1:9200/_cat/health
curl 'http://127.0.0.1:9200/_cat/health?v'#查看集群分健康性,获取到的是一个json格式的返回值,那就可以通过python等工具对其中的信息进行分析
#注意:status 字段为green才是正常状态
curl http://127.0.0.1:9200/_cluster/health?pretty=true#查看所有的节点信息
curl 'http://127.0.0.1:9200/_cat/nodes?v'#列出所有的索引 以及每个索引的相关信息
curl 'http://127.0.0.1:9200/_cat/indices?v'
范例:
[root@es-node01 ~]#curl http://127.0.0.1:9200/_cat
=^.^=
/_cat/allocation
/_cat/shards
/_cat/shards/{index}
/_cat/master
/_cat/nodes
/_cat/tasks
/_cat/indices
/_cat/indices/{index}
/_cat/segments
/_cat/segments/{index}
/_cat/count
/_cat/count/{index}
/_cat/recovery
/_cat/recovery/{index}
/_cat/health
/_cat/pending_tasks
/_cat/aliases
/_cat/aliases/{alias}
/_cat/thread_pool
/_cat/thread_pool/{thread_pools}
/_cat/plugins
/_cat/fielddata
/_cat/fielddata/{fields}
/_cat/nodeattrs
/_cat/repositories
/_cat/snapshots/{repository}
/_cat/templates
/_cat/component_templates/_cat/ml/anomaly_detectors
/_cat/ml/anomaly_detectors/{job_id}
/_cat/ml/datafeeds
/_cat/ml/datafeeds/{datafeed_id}
/_cat/ml/trained_models
/_cat/ml/trained_models/{model_id}
/_cat/ml/data_frame/analytics
/_cat/ml/data_frame/analytics/{id}
/_cat/transforms
/_cat/transforms/{transform_id}[root@es-node01 ~]#curl http://127.0.0.1:9200/_cat/master
hYZ9eBiJSv6BYpoWVkbmAA 11.0.1.101 11.0.1.101 es-node01[root@es-node01 ~]#curl http://127.0.0.1:9200/_cat/nodes
11.0.1.102 67 94 0 0.51 0.47 0.45 cdfhilmrstw - es-node02
11.0.1.101 41 92 0 0.43 0.45 0.45 cdfhilmrstw * es-node01
11.0.1.103 48 94 0 0.54 0.40 0.38 cdfhilmrstw - es-node03#列出所有的索引 以及每个索引的相关信息
[root@es-node01 ~]#curl '127.0.0.1:9200/_cat/indices?v'
health status index  uuid                   pri rep docs.count docs.deleted store.size pri.store.size dataset.size
green  open   index2 3OXaH2FjQGeqMYL2VNohZQ   1   1          0            0       454b           227b         227b
#查看指定索引信息
curl -XPOST '127.0.0.1:9200/nginx-errorlog-0.107-2021.02.04/_search?pretty'#创建索引
[root@es-node01 ~]#curl -XPUT '127.0.0.1:9200/index01'
{"acknowledged":true,"shards_acknowledged":true,"index":"index01"}
[root@es-node01 ~]#curl -XPUT '127.0.0.1:9200/index02'
{"acknowledged":true,"shards_acknowledged":true,"index":"index02"}#查看索引
[root@es-node01 ~]#curl 127.0.0.1:9200/_cat/indices?v
health status index   uuid                   pri rep docs.count docs.deleted store.size pri.store.size dataset.size
green  open   index02 SSrQw1IJTGGrakGxX2XU9Q   1   1          0            0       454b           227b         227b
green  open   index01 0A60ppwsSZW697xkuPN-Xw   1   1          0            0       454b           227b         227b
2.4.1.2 创建和查看索引
https://www.elastic.co/guide/en/elasticsearch/reference/current/indices-create-index.html
示例:(副本不包含本身,区别于kafka)
#两个分片,每个分片各一个副本,共四个分片
curl -X PUT '127.0.0.1:9200/test01' \
-H 'Content-Type: application/json' \
-d '{"settings": {"index": {"number_of_shards": 3,"number_of_replicas": 2}}
}'#创建3个分片和2个副本的索引(3个分片,每个分片各2个副本,共9个分片)
[root@es-node01 ~]#curl -X PUT '127.0.0.1:9200/index3' \
> -H 'Content-Type: application/json' \
> -d '{
>   "settings": {
>     "index": {
>       "number_of_shards": 3,
>       "number_of_replicas": 2
>     }
>   }
> }'
{"acknowledged":true,"shards_acknowledged":true,"index":"index3"}#查看所有索引
[root@es-node01 ~]#curl '127.0.0.1:9200/_cat/indices?v'
health status index   uuid                   pri rep docs.count docs.deleted store.size pri.store.size dataset.size
green  open   index02 SSrQw1IJTGGrakGxX2XU9Q   1   1          0            0       498b           249b         249b
green  open   index3  2WL6y08cTJuhK8tbB9LEPw   3   2          0            0      2.1kb           747b         747b
green  open   index2  3OXaH2FjQGeqMYL2VNohZQ   1   1          0            0       498b           249b         249b
green  open   index1  g8FFVd9YSXCA8UXnI0ErqA   1   1          0            0       498b           249b         249b
green  open   index01 0A60ppwsSZW697xkuPN-Xw   1   1          0            0       498b           249b         249b[root@es-node01 ~]#curl '127.0.0.1:9200/index3?pretty'
{"index3" : {"aliases" : { },"mappings" : { },"settings" : {"index" : {"routing" : {"allocation" : {"include" : {"_tier_preference" : "data_content"}}},"number_of_shards" : "3","provided_name" : "index3","creation_date" : "1727172087833","number_of_replicas" : "2","uuid" : "2WL6y08cTJuhK8tbB9LEPw","version" : {"created" : "8505000"}}}}
}#早期版本,如es1.X,2.X可以直在下面数据目录下直接看到index的名称,5.X版本后只会显示下面信息
#说明: 2WL6y08cTJuhK8tbB9LEPw表示索引ID
## /data/es-data/indices/索引ID/分片ID
[root@es-node01 ~]#ls /data/es-data/indices/ -l
total 16
drwxr-xr-x 6 elasticsearch elasticsearch 4096 Sep 24 18:01 2WL6y08cTJuhK8tbB9LEPw
drwxr-xr-x 4 elasticsearch elasticsearch 4096 Sep 24 15:47 3OXaH2FjQGeqMYL2VNohZQ
drwxr-xr-x 4 elasticsearch elasticsearch 4096 Sep 24 16:03 g8FFVd9YSXCA8UXnI0ErqA
drwxr-xr-x 4 elasticsearch elasticsearch 4096 Sep 24 15:52 SSrQw1IJTGGrakGxX2XU9Q[root@es-node01 ~]#ll /data/es-data/indices/2WL6y08cTJuhK8tbB9LEPw/
total 24
drwxr-xr-x 6 elasticsearch elasticsearch 4096 Sep 24 18:01 ./
drwxr-xr-x 6 elasticsearch elasticsearch 4096 Sep 24 18:01 ../
drwxr-xr-x 5 elasticsearch elasticsearch 4096 Sep 24 18:01 0/
drwxr-xr-x 5 elasticsearch elasticsearch 4096 Sep 24 18:01 1/
drwxr-xr-x 5 elasticsearch elasticsearch 4096 Sep 24 18:01 2/
drwxr-xr-x 2 elasticsearch elasticsearch 4096 Sep 24 18:01 _state/
2.4.1.3 插入文档
范例:
#创建文档时不指定_id,会自动生成
#8.X版本后因为删除了type,所以索引操作:{index}/{type}/需要修改成PUT {index}/_doc/
#index1是索引数据库,book是type
#8.X版本之后#插入文档
curl -X POST 'http://127.0.0.1:9200/test01/_doc/' \
-H 'Content-Type: application/json' \
-d '{"name": "linux","author": "dinginx","version": "1.0"
}'#查询
[root@es-node01 ~]#curl 127.0.0.1:9200/_cat/indices?v
health status index   uuid                   pri rep docs.count docs.deleted store.size pri.store.size dataset.size
green  open   index02 SSrQw1IJTGGrakGxX2XU9Q   1   1          0            0       498b           249b         249b
green  open   index03 axKgSJfiTiirt2XiT4cj3A   2   1          0            0       996b           498b         498b
green  open   test01  HbUbm1WgTKGxqYm3wH3YRg   2   1          0            0       996b           498b         498b
green  open   index1  g8FFVd9YSXCA8UXnI0ErqA   1   1          1 #显示一条数据 0     12.2kb          6.1kb        6.1kb
green  open   index01 0A60ppwsSZW697xkuPN-Xw   1   1          0            0       498b           249b         249b
green  open   index3  2WL6y08cTJuhK8tbB9LEPw   3   2          0            0      2.1kb           747b         747b
green  open   index2  3OXaH2FjQGeqMYL2VNohZQ   1   1          0            0       498b           249b         249b[root@es-node01 ~]#curl 'http://127.0.0.1:9200/index1/_search?q=name:linux&pretty'
{"took" : 3,"timed_out" : false,"_shards" : {"total" : 1,"successful" : 1,"skipped" : 0,"failed" : 0},"hits" : {"total" : {"value" : 1,"relation" : "eq"},"max_score" : 0.2876821,"hits" : [{"_index" : "index1","_id" : "naaZI5IBAmvSJbVZPOuV","_score" : 0.2876821,"_source" : {"name" : "linux","author" : "wangxiaochun","version" : "1.0"}}]}
}
2.4.1.4 查询文档
范例:
#查询索引的中所有文档
[root@es-node01 ~]#curl 'http://127.0.0.1:9200/index1/_search?pretty'
{"took" : 2,"timed_out" : false,"_shards" : {"total" : 1,"successful" : 1,"skipped" : 0,"failed" : 0},"hits" : {"total" : {"value" : 2,"relation" : "eq"},"max_score" : 1.0,"hits" : [{"_index" : "index1","_id" : "naaZI5IBAmvSJbVZPOuV","_score" : 1.0,"_source" : {"name" : "linux","author" : "wangxiaochun","version" : "1.0"}},{"_index" : "index1","_id" : "3","_score" : 1.0,"_source" : {"version" : "2.0","name" : "dinginx","author" : "dingbaohang"}}]}
}
2.4.1.5 更新文档
范例:
#创建或更新文档
[root@es-node03 ~]# curl -X POST 'http://127.0.0.1:9200/test01/_doc/3' -H 'Content-Type: application/json' -d '{"version": "1.0", "name": "golang", "author": "ding"}'#获取文档
[root@es-node03 ~]#curl 127.0.0.1:9200/test01/_doc/3?pretty
{"_index" : "test01","_id" : "3","_version" : 3,"_seq_no" : 12,"_primary_term" : 2,"found" : true,"_source" : {"version" : "1.0","name" : "golang","author" : "ding"}
}#更新版本
[root@es-node03 ~]#curl -X POST 'http://127.0.0.1:9200/test01/_doc/3' -H 'Content-Type: application/json' -d '{"version": "2.0", "name": "golang", "author": "ding"}'
[root@es-node03 ~]#curl 'http://127.0.0.1:9200/test01/_doc/3?pretty'
{"_index" : "test01","_id" : "3","_version" : 2,"_seq_no" : 11,"_primary_term" : 2,"found" : true,"_source" : {"version" : "2.0","name" : "golang","author" : "ding"}
}#Elasticsearch 7.x 示例,创建或更新文档
curl -X POST 'http://127.0.0.1:9200/index1/book/3' -H 'Content-Type: application/json' -d '{"version": "2.0", "name": "golang", "author": "zhang"}'#获取文档
curl 'http://127.0.0.1:9200/index1/_doc/3?pretty'
2.4.1.6 删除文档
#8.X版本
curl -XDELETE http://kibana服务器:9200/<索引名称>/_doc/<文档id>
#7.X版本前
curl -XDELETE http://kibana服务器:9200/<索引名称>/type/<文档id>
范例: 删除指定文档
#8.X
[root@es-node01 ~]#curl 'http://127.0.0.1:9200/index1/_search?pretty'
{"took" : 1,"timed_out" : false,"_shards" : {"total" : 1,"successful" : 1,"skipped" : 0,"failed" : 0},"hits" : {"total" : {"value" : 1,"relation" : "eq"},"max_score" : 1.0,"hits" : [{"_index" : "index1","_id" : "naaZI5IBAmvSJbVZPOuV","_score" : 1.0,"_source" : {"name" : "linux","author" : "wangxiaochun","version" : "1.0"}}]}
}
[root@es-node01 ~]#curl -XDELETE 'http://127.0.0.1:9200/index1/_doc/naaZI5IBAmvSJbVZPOuV'
{"_index":"index1","_id":"naaZI5IBAmvSJbVZPOuV","_version":2,"result":"deleted","_shards":{"total":2,"successful":2,"failed":0},"_seq_no":6,"_primary_term":1}[root@es-node01 ~]#
[root@es-node01 ~]#curl 'http://127.0.0.1:9200/index1/_search?pretty'
{"took" : 20,"timed_out" : false,"_shards" : {"total" : 1,"successful" : 1,"skipped" : 0,"failed" : 0},"hits" : {"total" : {"value" : 0,"relation" : "eq"},"max_score" : null,"hits" : [ ]}
}
2.4.1.7 删除索引
范例:删除指定索引
[root@es-node01 ~]#curl -XDELETE http://127.0.0.1:9200/index2
{"acknowledged":true}#查看索引是否删除
[root@es-node1 ~]#curl 'http://127.0.0.1:9200/_cat/indices?pretty'#删除多个指定索引
curl -XDELETE 'http://127.0.0.1:9200/index_one,index_two#删除通配符多个索引,需要设置action.destructive_requires_name: false
curl -XDELETE 'http://127.0.0.1:9200/index_*'
范例: 删除所有索引
#以下需要设置action.destructive_requires_name: false
[root@es-node01 ~]#curl -X DELETE "http://127.0.0.1:9200/*"
[root@es-node01 ~]#curl -X DELETE "127.0.0.1:9200/_all"#以下无需配置
[root@es-node01 ~]#for i in `curl 'http://127.0.0.1:9200/_cat/indices?v'|awk '{print $3}'`;do curl -XDELETE http://127.0.0.1:9200/$i;done
2.4.2 Python 脚本:集群健康性检查
#修改脚本中参数值ELASTICSEARCH_URL为ES集群IP
##环境准备
[root@es-node01 ~]#apt install -y python3
[root@es-node01 ~]#apt install -y python3-pip
[root@es-node01 ~]#pip install elasticsearch		#必要时安装[root@es-node01 ~]#cat elastic.sh
#!/usr/bin/python3
#coding:utf-8import subprocess
import json# Elasticsearch集群健康检查的URL
ELASTICSEARCH_URL = "http://11.0.1.101:9200/_cluster/health?pretty=true"# 使用subprocess来执行curl命令获取Elasticsearch集群健康状态
try:# 使用curl命令获取Elasticsearch集群的健康状态result = subprocess.Popen(("curl -sXGET " + ELASTICSEARCH_URL), shell=True, stdout=subprocess.PIPE)data = result.stdout.read()  # 从stdout中读取curl返回的数据
except Exception as e:print(f"Error occurred while running curl command: {e}")data = None# 如果获取到数据,解析为字典
if data:try:es_dict = json.loads(data)  # 将JSON格式的字符串转换为Python字典except json.JSONDecodeError as e:print(f"Failed to parse JSON: {e}")es_dict = {}
else:es_dict = {}# 获取集群状态
status = es_dict.get("status")# 根据状态进行判断并输出结果
if status == "green":print("OK")
elif status == "yellow":print("Warning: Cluster status is yellow.")
elif status == "red":print("Critical: Cluster status is red!")
else:print("Not OK: Unable to determine cluster status.")#执行并测试
[root@es-node01 ~]#python3.8 elastic.sh
OK
示例二:
##环境准备
[root@es-node01 ~]#apt install -y python3
[root@es-node01 ~]#apt install -y python3-pip
[root@es-node01 ~]#pip install elasticsearch		#必要时安装[root@es-node01 ~]#cat es_status.py
from elasticsearch import Elasticsearch
import jsondef serialize_es_response(response):if hasattr(response, 'body'):return response.bodyelif isinstance(response, dict):return responseelse:return str(response)def check_cluster_status(es_host='localhost', es_port=9200):# 创建Elasticsearch客户端,添加scheme参数es = Elasticsearch([{'scheme': 'http', 'host': es_host, 'port': es_port}])try:# 获取集群健康状态health = es.cluster.health()print("集群健康状态:")print(json.dumps(serialize_es_response(health), indent=2))# 获取集群状态stats = es.cluster.stats()stats_body = serialize_es_response(stats)print("\n集群统计信息:")print(json.dumps({"cluster_name": stats_body.get('cluster_name'),"status": stats_body.get('status'),"number_of_nodes": stats_body.get('nodes', {}).get('count', {}).get('total'),"number_of_data_nodes": stats_body.get('nodes', {}).get('count', {}).get('data'),"active_primary_shards": stats_body.get('indices', {}).get('shards', {}).get('primary'),"active_shards": stats_body.get('indices', {}).get('shards', {}).get('total'),}, indent=2))# 获取节点信息nodes = es.nodes.info()nodes_body = serialize_es_response(nodes)print("\n节点信息:")for node_id, node_info in nodes_body.get('nodes', {}).items():print(f"节点ID: {node_id}")print(f"节点名称: {node_info.get('name')}")print(f"节点角色: {', '.join(node_info.get('roles', []))}")print(f"IP地址: {node_info.get('ip')}")print("---")except Exception as e:print(f"连接到Elasticsearch集群时发生错误: {str(e)}")if __name__ == "__main__":check_cluster_status()#执行测试
[root@es-node01 ~]#python3.8 es_status.py
集群健康状态:
{"cluster_name": "elk-cluster","status": "green","timed_out": false,"number_of_nodes": 3,"number_of_data_nodes": 3,"active_primary_shards": 1,"active_shards": 2,"relocating_shards": 0,"initializing_shards": 0,"unassigned_shards": 0,"delayed_unassigned_shards": 0,"number_of_pending_tasks": 0,"number_of_in_flight_fetch": 0,"task_max_waiting_in_queue_millis": 0,"active_shards_percent_as_number": 100.0
}集群统计信息:
{"cluster_name": "elk-cluster","status": "green","number_of_nodes": 3,"number_of_data_nodes": 3,"active_primary_shards": null,"active_shards": 2
}节点信息:
节点ID: hYZ9eBiJSv6BYpoWVkbmAA
节点名称: es-node01
节点角色: data, data_cold, data_content, data_frozen, data_hot, data_warm, ingest, master, ml, remote_cluster_client, transform
IP地址: 11.0.1.101
---
节点ID: GpWJv16KSBi9k8pHwfX-ow
节点名称: es-node02
节点角色: data, data_cold, data_content, data_frozen, data_hot, data_warm, ingest, master, ml, remote_cluster_client, transform
IP地址: 11.0.1.102
---
节点ID: BRFD5lSgQ0Cho7dZn0qCaA
节点名称: es-node03
节点角色: data, data_cold, data_content, data_frozen, data_hot, data_warm, ingest, master, ml, remote_cluster_client, transform
IP地址: 11.0.1.103
---
2.5 Elasticsearch 插件
通过使用各种插件可以实现对 ES 集群的状态监控, 数据访问, 管理配置等功能
ES集群状态:
- green 绿色状态:表示集群各节点运行正常,而且没有丢失任何数据,各主分片和副本分片都运行正常
- yellow 黄色状态:表示由于某个节点宕机或者其他情况引起的,node节点无法连接、所有主分片都正常分配,有副本分片丢失,但是还没有丢失任何数据
- red 红色状态:表示由于某个节点宕机或者其他情况引起的主分片丢失及数据丢失,但仍可读取数据和存储
监控下面两个条件都满足才是正常的状态
- 集群状态为 green
- 所有节点都启动
2.5.1 Head 插件
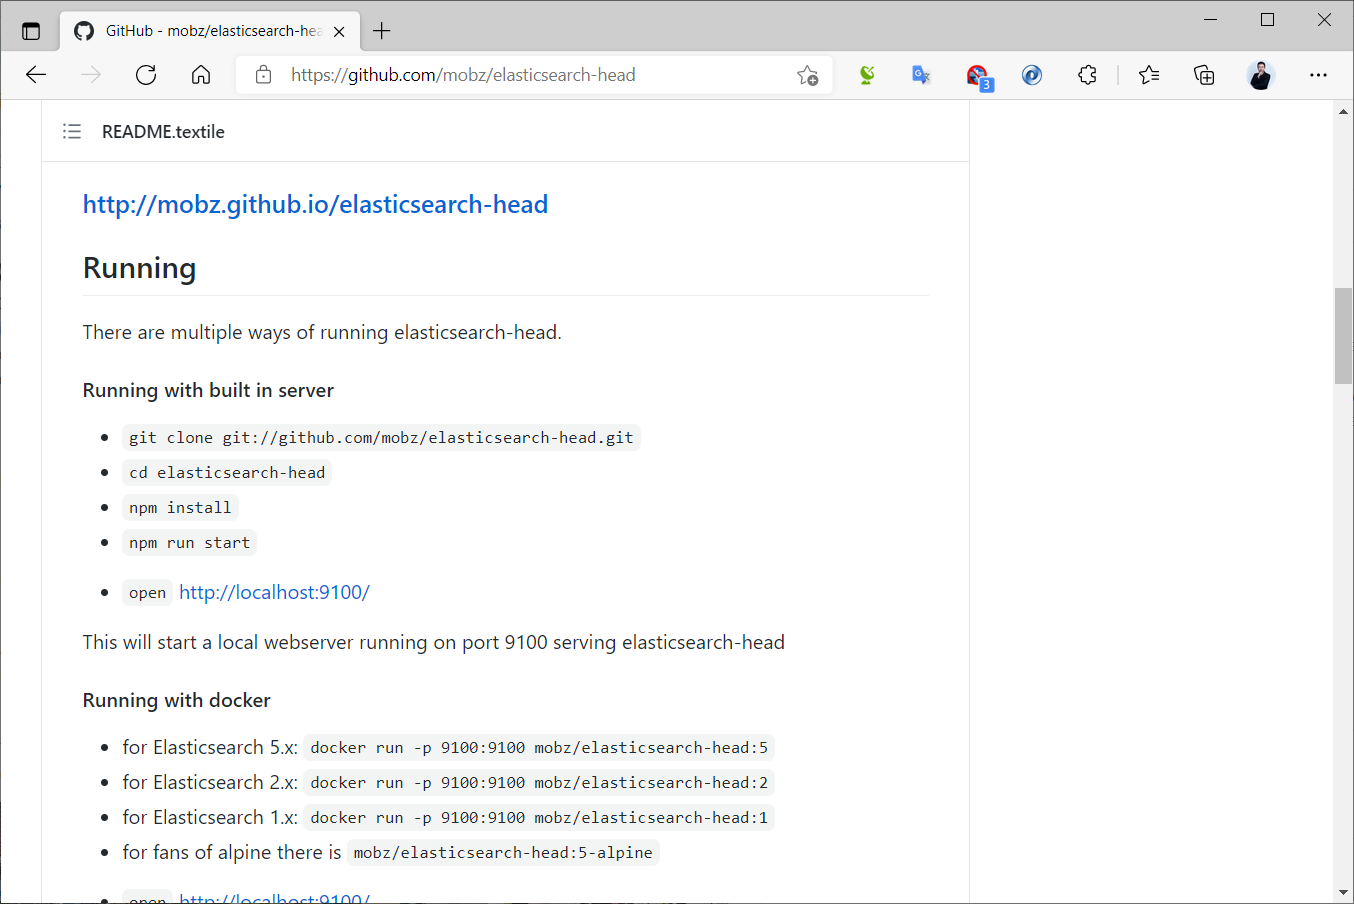
2.5.1.1 Head 介绍
Head 是一个 ES 在生产较为常用的插件,目前此插件更新较慢,还是2018年4月的版本
git地址: https://github.com/mobz/elasticsearch-head
2.5.2 Cerebro 插件
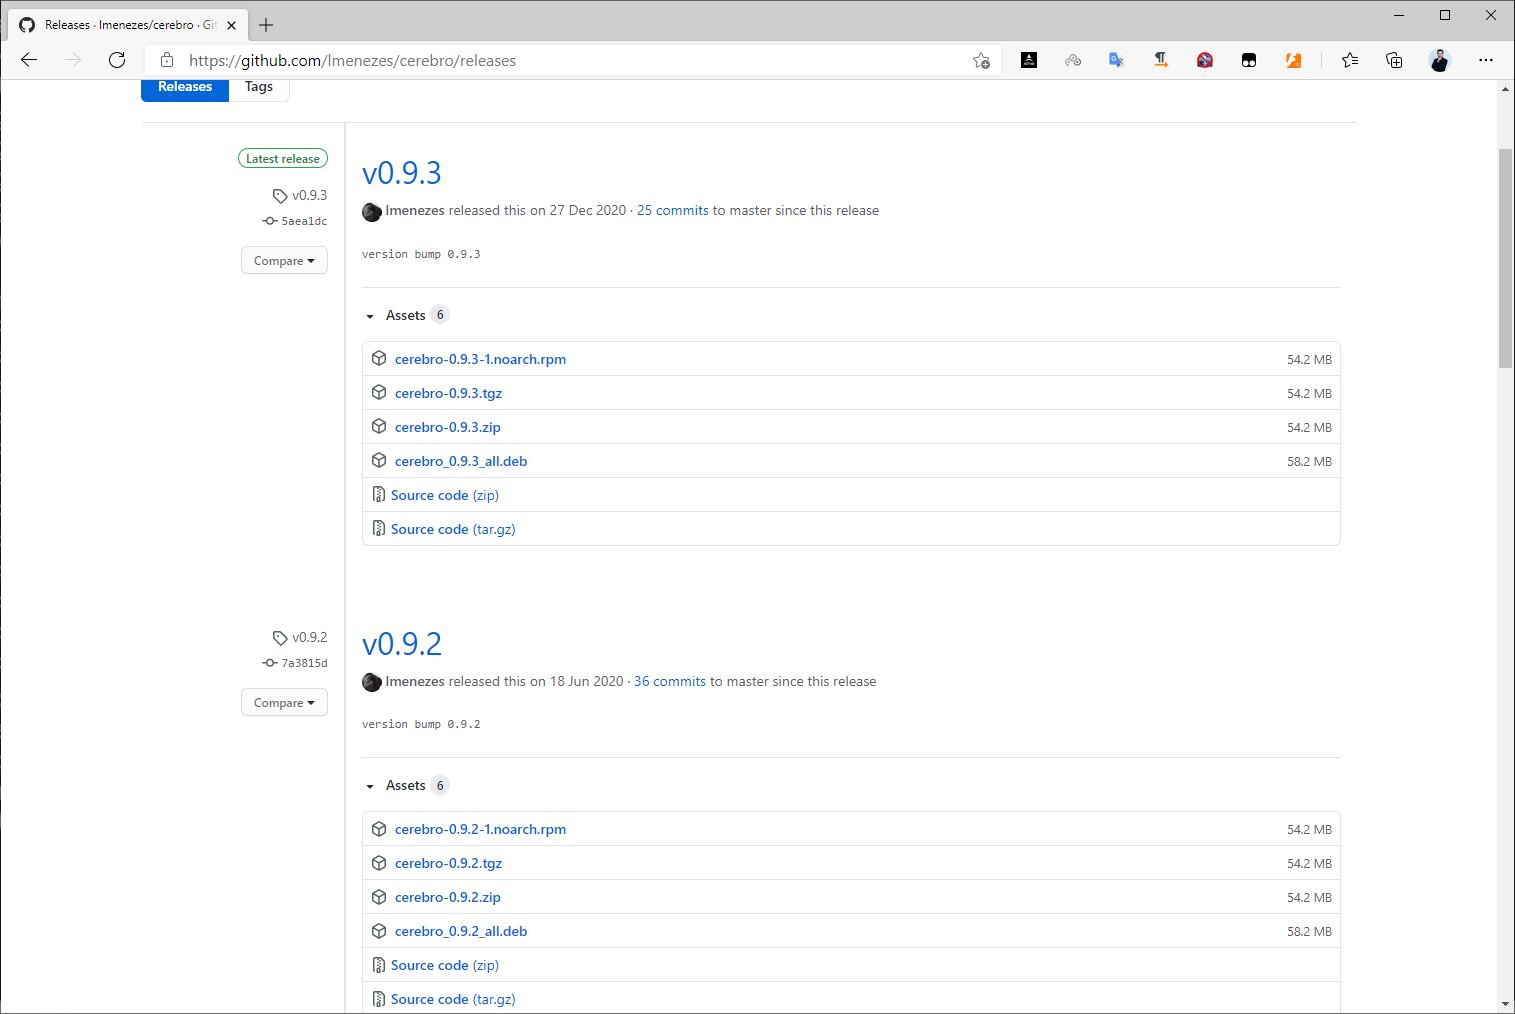
2.5.2.1 Cerebro 介绍

Cerebro 是开源的 elasticsearch 集群 Web 管理程序,此工具应用也很广泛,此项目升级比 Head 频繁
当前最新版本为Apr 10, 2021发布的v0.9.4
Cerebro v0.9.3 版本之前需要 java1.8 或者更高版本
Cerebro v0.9.4 版本更高版本需要 Java11
github链接:
https://github.com/lmenezes/cerebro
2.6 Elasticsearch 集群工作原理
官方说明
https://www.elastic.co/guide/en/elasticsearch/reference/current/index.html
单机节点 ES 存在单点可用性和性能问题,可以实现Elasticsearch多机的集群解决
Elasticsearch 支持集群模式
- 能够提高Elasticsearch可用性,即使部分节点停止服务,整个集群依然可以正常服务
- 能够增大Elasticsearch的性能和容量,如内存、磁盘,使得Elasticsearch集群可以支持PB级的数据
2.6.1 ES 节点分类
Elasticsearch 集群的每个节点的角色有所不同,但都会保存集群状态Cluster State的相关的数据信息
- 节点信息:每个节点名称和地址
- 索引信息:所有索引的名称,配置,数据等
ES的节点有下面几种
- Master 节点
有从提主,无从创从
2.6.3.3 默认分片配置
默认情况下,elasticsearch将分片相关的配置从配置文件中的属性移除了,可以借助于一个默认的模板接口将索引的分片属性更改成我们想要的分片效果
curl -X PUT 'http://127.0.0.1:9200/_template/template_http_request_record' \
-H 'Content-Type: application/json' \
-d '{"index_patterns": ["*"],"settings": {"number_of_shards": 5,"number_of_replicas": 1}
}'
解释:
-
-X PUT:使用PUT方法发送请求,这是创建或替换 Elasticsearch 索引模板的标准方法。 -
'http://127.0.0.1:9200/_template/template_http_request_record':这是请求的 URL,指向 Elasticsearch 的模板 API,用于创建或更新一个名为template_http_request_record的模板。 -
-H 'Content-Type: application/json':指定请求的内容类型为application/json,这是 Elasticsearch API 的标准要求。 -
-d '...':这是请求的数据部分,包含我们要发送的 JSON 数据:"index_patterns": ["\*"]:指定模板适用的索引模式,"*"表示匹配所有索引。"number_of_shards": 5:设置每个索引的分片数量为 5。"number_of_replicas": 1:为每个分片设置 1 个副本。
验证生成的索引:
2.6.3.4 数据同步机制
Elasticsearch主要依赖Zen Discovery协议来管理集群中节点的加入和离开,以及选举主节点(master node)。Zen Discovery是Elasticsearch自带的一个协议,不依赖于任何外部服务。
然而,Elasticsearch对于一致性的处理与传统的一致性协议(如Raft或Paxos)有所不同。它采取了一种“最终一致性”(eventual consistency)的模型。
每个索引在Elasticsearch中被分成多个分片(shard),每个分片都有一个主分片和零个或多个副本分片。主分片负责处理所有的写操作,并将写操作复制到其副本分片。当主分片失败时,一个副本分片会被提升为新的主分片。
Elasticsearch为了提高写操作的性能,允许在主分片写入数据后立即确认写操作,而不需要等待数据被所有副本分片确认写入。这就意味着,在某些情况下,主分片可能会确认写操作成功,而实际上副本分片还没有完全写入数据。这就可能导致数据在短时间内在主分片和副本分片之间不一致。然而,一旦所有副本分片都确认写入了数据,那么系统就会达到“最终一致性”。
为了保证搜索的准确性,Elasticsearch还引入了一个"refresh"机制,每隔一定时间(默认为1秒)将最新的数据加载到内存中,使其可以被搜索到。这个过程是在主分片和所有副本分片上独立进行的,所以可能存在在短时间内搜索结果在不同分片之间有些许不一致的情况,但随着时间的推移,所有分片上的数据都会达到一致状态。
综上所述,Elasticsearch通过Zen Discovery协议管理节点和选举,通过主分片和副本分片的机制保证数据的最终一致性,并通过"refresh"机制保证数据的搜索准确性。
2.6.2 ES 集群选举
ES集群的选举是由master-eligble(有资格充当的master节点)发起
当该节点发现当前节点不是master,并且该节点通过ZenDiscovery模块ping其他节点,如果发现超过mininum_master_nodes个节点无法连接master时,就会发起新的选举,选举时,优先选举ClusterStateVersion最大的Node节点,如果ClusterStateVersion相同,则选举ID最小的Node
ClusterStateVersion是集群的状态版本号,每一次集群选举ClusterStateVersion都会更新,因此最大的
ClusterStateVersion是与原有集群数据最接近或者是相同的,这样就尽可能的避免数据丢失。
Node的ID是在第一次服务启动时随机生成的,直接选用最小ID的Node,主要是为了选举的稳定性,尽量少出现选举不出来的问题。
每个集群中只有一个Master节点
每个集群中损坏的节点不能超过集群一半以上,否则集群将无法提供服务
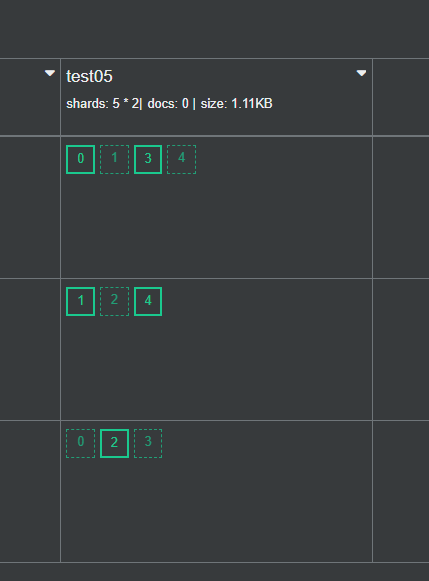
2.6.3 ES 集群分片 Shard 和副本 Replication
2.6.3.1 分片 Shard
2.6.3.2 副本 Replication
2.6.3.3 默认分片配置
2.6.3.4 数据同步机制
2.6.4 ES 集群故障转移
故障转移指的是,当集群中有节点发生故障时,ES集群会进行自动修复
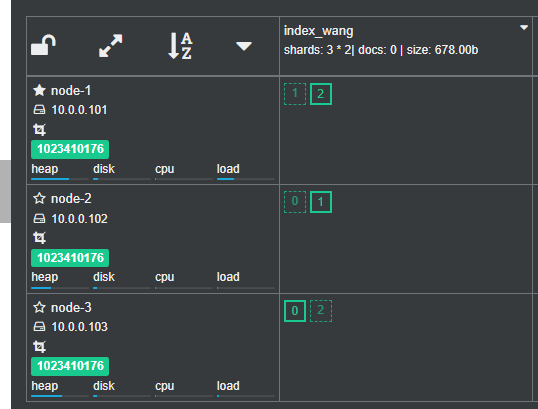
假设由3个节点的ES集群组成,有一个索引index_wang,三个主分片,三个副本分片,如果其中一个节点宕机
ES集群的故障转移流程如下
重新选举
假设当前Master节点 node3 节点宕机,同时也导致 node3 的原有的P0和R2分片丢失node1 和 node2 发现 Master节点 node3 无法响应
过一段时间后会重新发起 master 选举
比如这次选择 node1 为 新 master 节点;此时集群状态变为 Red 状态
其实无论选举出的新Master节点是哪个节点,都不影响后续的分片的重新分布结果
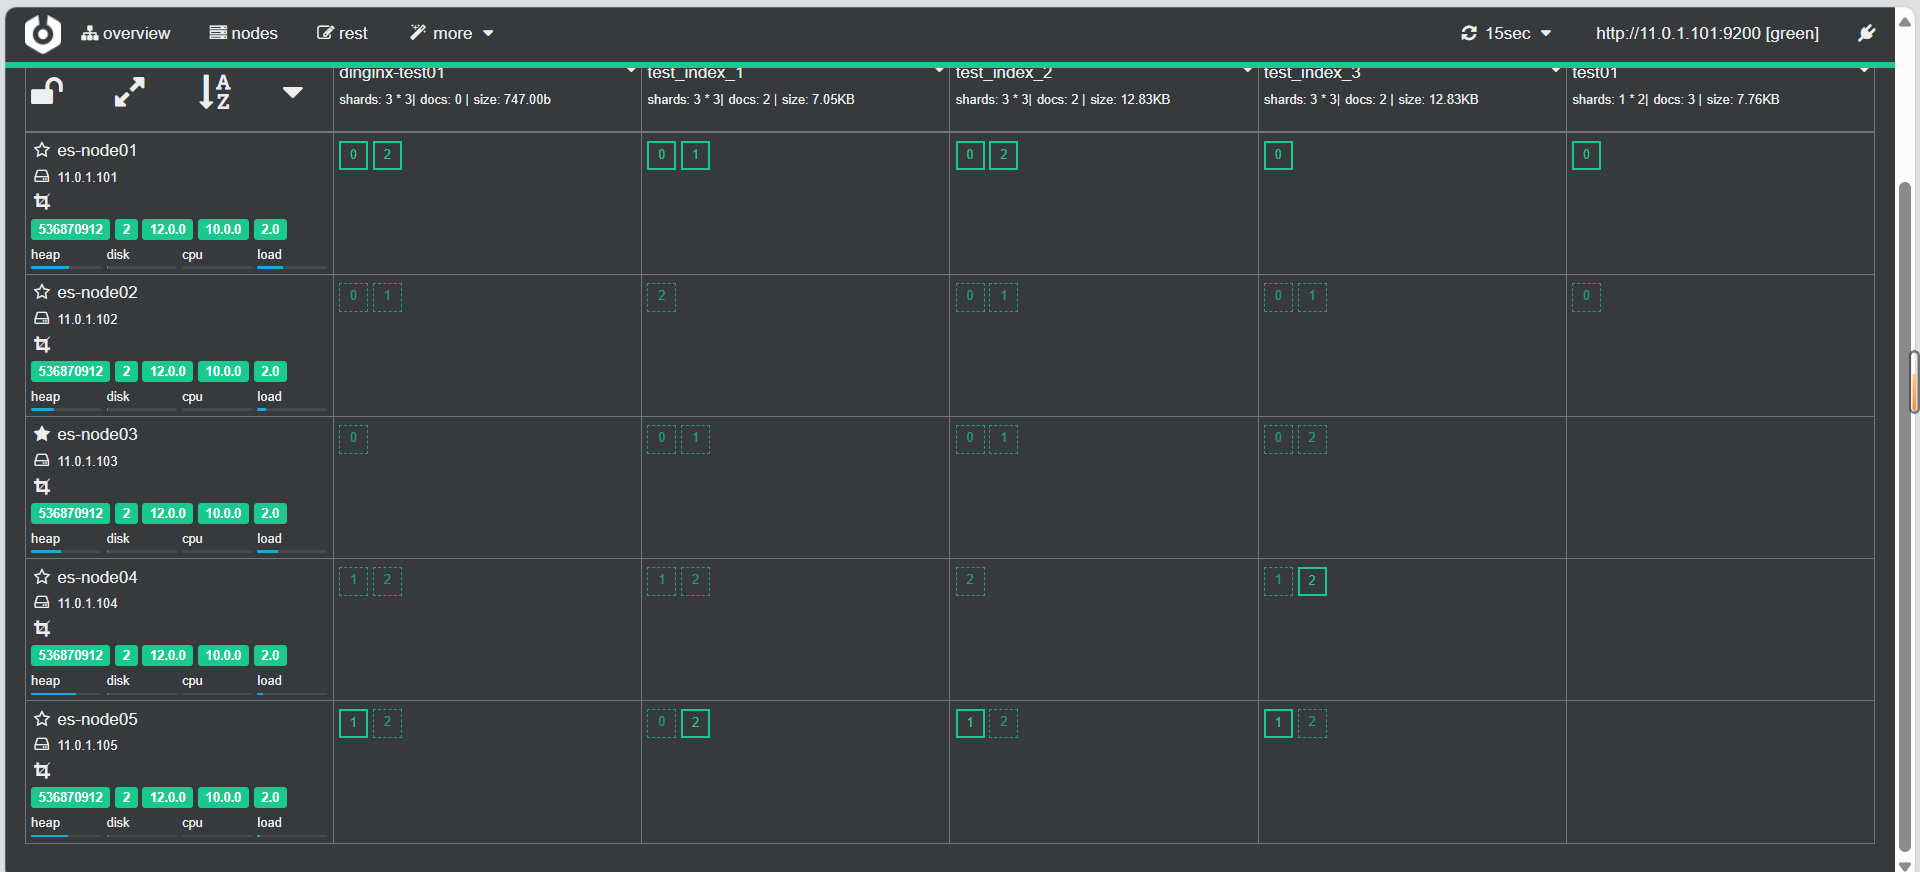
2.7 Elasticsearch 集群扩容和缩容
2.7.1 集群扩容
新加入两个节点node04和node05,变为Data节点
在两个新节点安装 ES,并配置文件如下
环境准备:
#es-node04: 11.0.1.104
#es-node05: 11.0.1.105#/etc/hosts文件
[root@es-node04 ~]#cat >> /etc/hosts <<EOF
11.0.1.101 es-node01.dinginx.org
11.0.1.102 es-node02.dinginx.org
11.0.1.103 es-node03.dinginx.org
11.0.1.104 es-node04.dinginx.org
11.0.1.105 es-node05.dinginx.org
EOF#文件准备
[root@es-node04 ~]#ll -h elasticsearch-8.14.3-amd64.deb
-rw-r--r-- 1 root root 562M Sep 23 21:53 elasticsearch-8.14.3-amd64.deb
[root@es-node04 ~]#dpkg -i elasticsearch-8.14.3-amd64.deb #同步配置文件
[root@es-node01 ~]#scp /etc/elasticsearch/elasticsearch.yml 11.0.1.104:/etc/elasticsearch/elasticsearch.yml
[root@es-node01 ~]#scp /etc/elasticsearch/elasticsearch.yml 11.0.1.105:/etc/elasticsearch/elasticsearch.yml[root@es-node01 ~]# scp /etc/elasticsearch/jvm.options 11.0.1.104:/etc/elasticsearch/jvm.options
[root@es-node01 ~]# scp /etc/elasticsearch/jvm.options 11.0.1.105:/etc/elasticsearch/jvm.options
配置文件内容修改
vim /etc/elasticsearch/elasticsearch.yml
cluster.name: elk-cluster #和原集群名称相同#当前节点在集群内的节点名称,同一集群中每个节点要确保此名称唯一
node.name: es-node04 #第二个新节点为es-node05#集群监听端口对应的IP,默认是127.0.0.1:9300
network.host: 0.0.0.0#指定任意集群节点即可
discovery.seed_hosts: ["11.0.1.101","11.0.1.102","11.0.1.103"]#集群初始化时指定希望哪些节点可以被选举为 master,只在初始化时使用,新加节点到已有集群时此项可不配置
cluster.initial_master_nodes: ["11.0.1.101","11.0.1.102","11.0.1.103"]
#cluster.initial_master_nodes: ["ubuntu2204.dinginx.org"] #如果不参与主节点选举设为false,默认值为true
node.master: false
#存储数据,默认值为true,此值为false则不存储数据而成为一个路由节点#如果将原有的true改为false,需要先执行/usr/share/elasticsearch/bin/elasticsearch-node repurpose 清理数据
node.data: true
systemctl restart elasticsearch
2.7.2 集群缩容
从集群中删除两个节点node4和node5,在两个节点停止服务,即可自动退出集群
systemctl stop elasticsearch
2.7.3 Data 节点变为Coordinating 节点
将一个节点node3变为Coordinating 节点
在node3执行下面操作
vim /etc/elasticsearch/elasticsearch.yml
node.master: false#存储数据,默认值为true,此值为false则不存储数据而成为一个路由节点,如果将原有的true改为false,需要先执行 清理数据
node.data: false#无法启动
systemctl restart elasticsearch#清理数据
/usr/share/elasticsearch/bin/elasticsearch-node repurpose#重启
systemctl start elasticsearch
#注意:Coordinating 节点在 Cerebro 等插件中前端数据页面不显示,在nodes页才会显示出来
3 Beats 收集数据
Beats 是一个免费且开放的平台,集合了多种单一用途数据采集器。它们从成百上千或成千上万台机器和系统向 Logstash 或 Elasticsearch 发送数据。
虽然利用 logstash 就可以收集日志,功能强大,但由于 Logtash 是基于Java实现,需要在采集日志的主机上安装JAVA环境
logstash运行时最少也会需要额外的500M的以上的内存,会消耗比较多的内存和磁盘空间,可以采有基于Go开发的 Beat 工具代替 Logstash 收集日志,部署更为方便,而且只占用10M左右的内存空间及更小的磁盘空间。

官方链接:
https://www.elastic.co/cn/beats/#Github 链接
https://github.com/elastic/beats
https://www.elastic.co/cn/downloads/beats
Beats 是一些工具集,包括以下,其中 filebeat 应用最为广泛‘
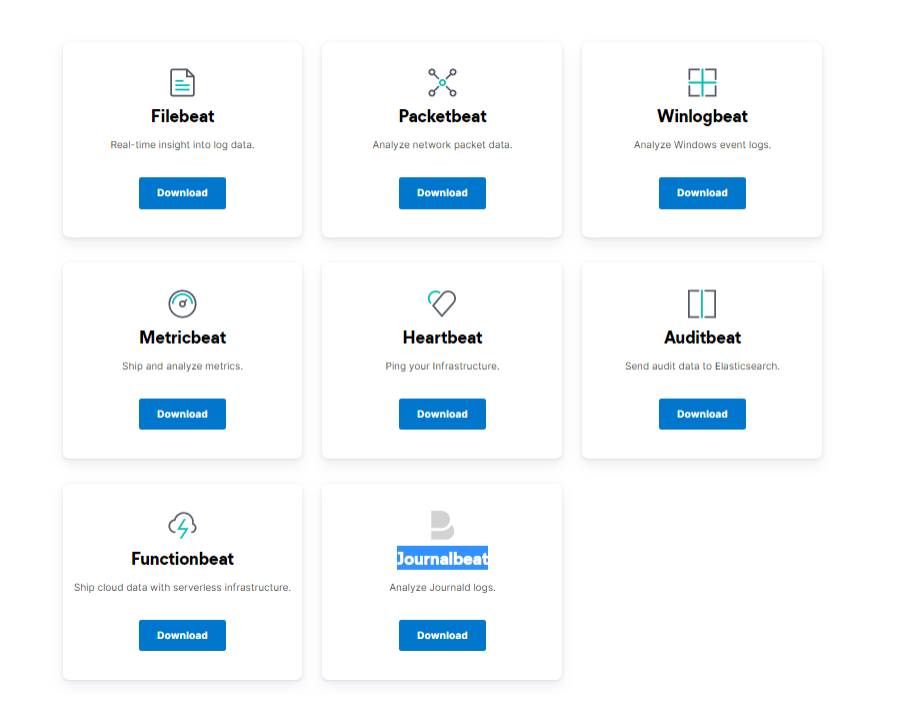
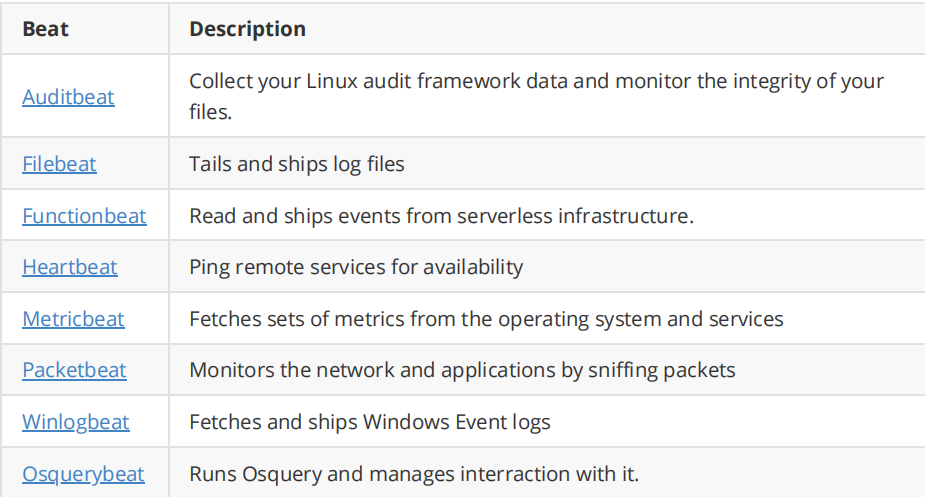
filebeat: 收集日志文件数据。最常用的工具
packetbeat: 用于收集网络数据。一般用zabbix实现此功能
metricbeat: 从OS和服务收集指标数据,比如系统运行状态、CPU 内存利用率等。
winlogbeat: 从Windows平台日志收集工具。
heartbeat: 定时探测服务是否可用。支持ICMP、TCP 和 HTTP,也支持TLS、身份验证和代理
auditbeat: 收集审计日志
Functionbeat: 使用无服务器基础架构提供云数据。面向云端数据的无服务器采集器,处理云数据
注意: Beats 版本要和 Elasticsearch 相同的版本,否则可能会出错
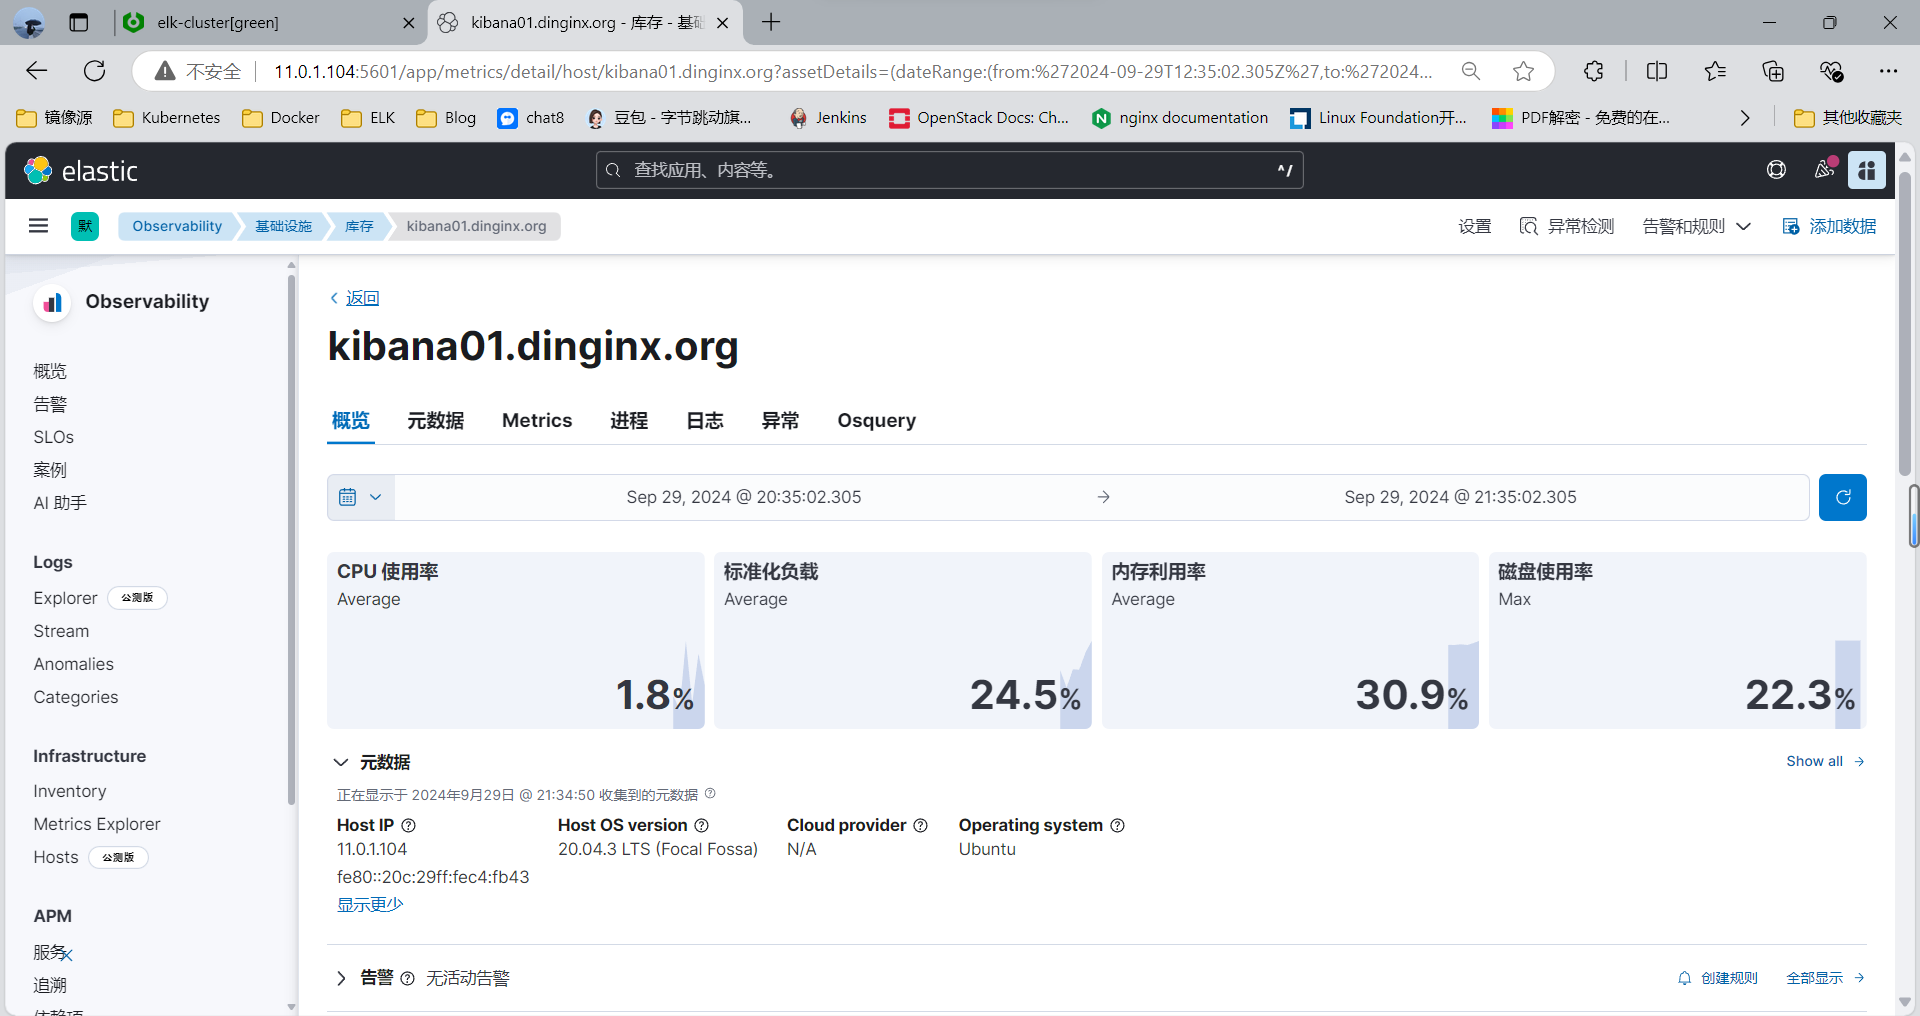
3.1 利用 Metricbeat 监控性能相关指标
Metricbeat 可以收集指标数据,比如系统运行状态、CPU、内存利用率等。
生产中一般用 zabbix 等专门的监控系统实现此功能
官方配置说明
https://www.elastic.co/guide/en/beats/metricbeat/current/configuring-howto-metricbeat.html
3.1.1 下载 metricbeat 并安装
#下载链接
https://www.elastic.co/cn/downloads/beats/metricbeat
https://mirrors.tuna.tsinghua.edu.cn/elasticstack/8.x/apt/pool/main/m/metricbeat/
https://mirrors.tuna.tsinghua.edu.cn/elasticstack/7.x/apt/pool/main/m/metricbeat/
范例:
[root@kibana01 ~]#ll metricbeat-8.14.3-amd64.deb -h
-rw-r--r-- 1 root root 53M Sep 23 22:10 metricbeat-8.14.3-amd64.deb
[root@kibana01 ~]#dpkg -i metricbeat-8.14.3-amd64.deb
3.1.2 修改配置
[root@kibana01 ~]# vim /etc/metricbeat/metricbeat.yml
#setup.kibana:
#   host: "11.0.1.104:5601" #指向kabana服务器地址和端口,非必须项,即使不设置Kibana也可以通过ES获取Metrics信息
#-------------------------- Elasticsearch output ------------------------------
output.elasticsearch:
# Array of hosts to connect to.
hosts: ["11.0.1.101:9200","11.0.1.102:9200","11.0.1.103:9200"]   #指向任意一个ELK集群节点即可[root@kibana01 ~]#grep -Ev '^#|^$' /etc/metricbeat/metricbeat.yml |grep -Ev '^.*#'
metricbeat.config.modules:path: ${path.config}/modules.d/*.ymlreload.enabled: false
setup.template.settings:index.number_of_shards: 1index.codec: best_compression
setup.kibana:host: "11.0.1.104:5601"
output.elasticsearch:hosts: ["11.0.1.101:9200","11.0.1.102:9200","11.0.1.103:9200"]preset: balanced
processors:- add_host_metadata: ~- add_cloud_metadata: ~- add_docker_metadata: ~- add_kubernetes_metadata: ~
3.1.3 启动服务
[root@kibana01 ~]#systemctl enable --now metricbeat.service
[root@kibana01 ~]#systemctl is-active metricbeat.service
active
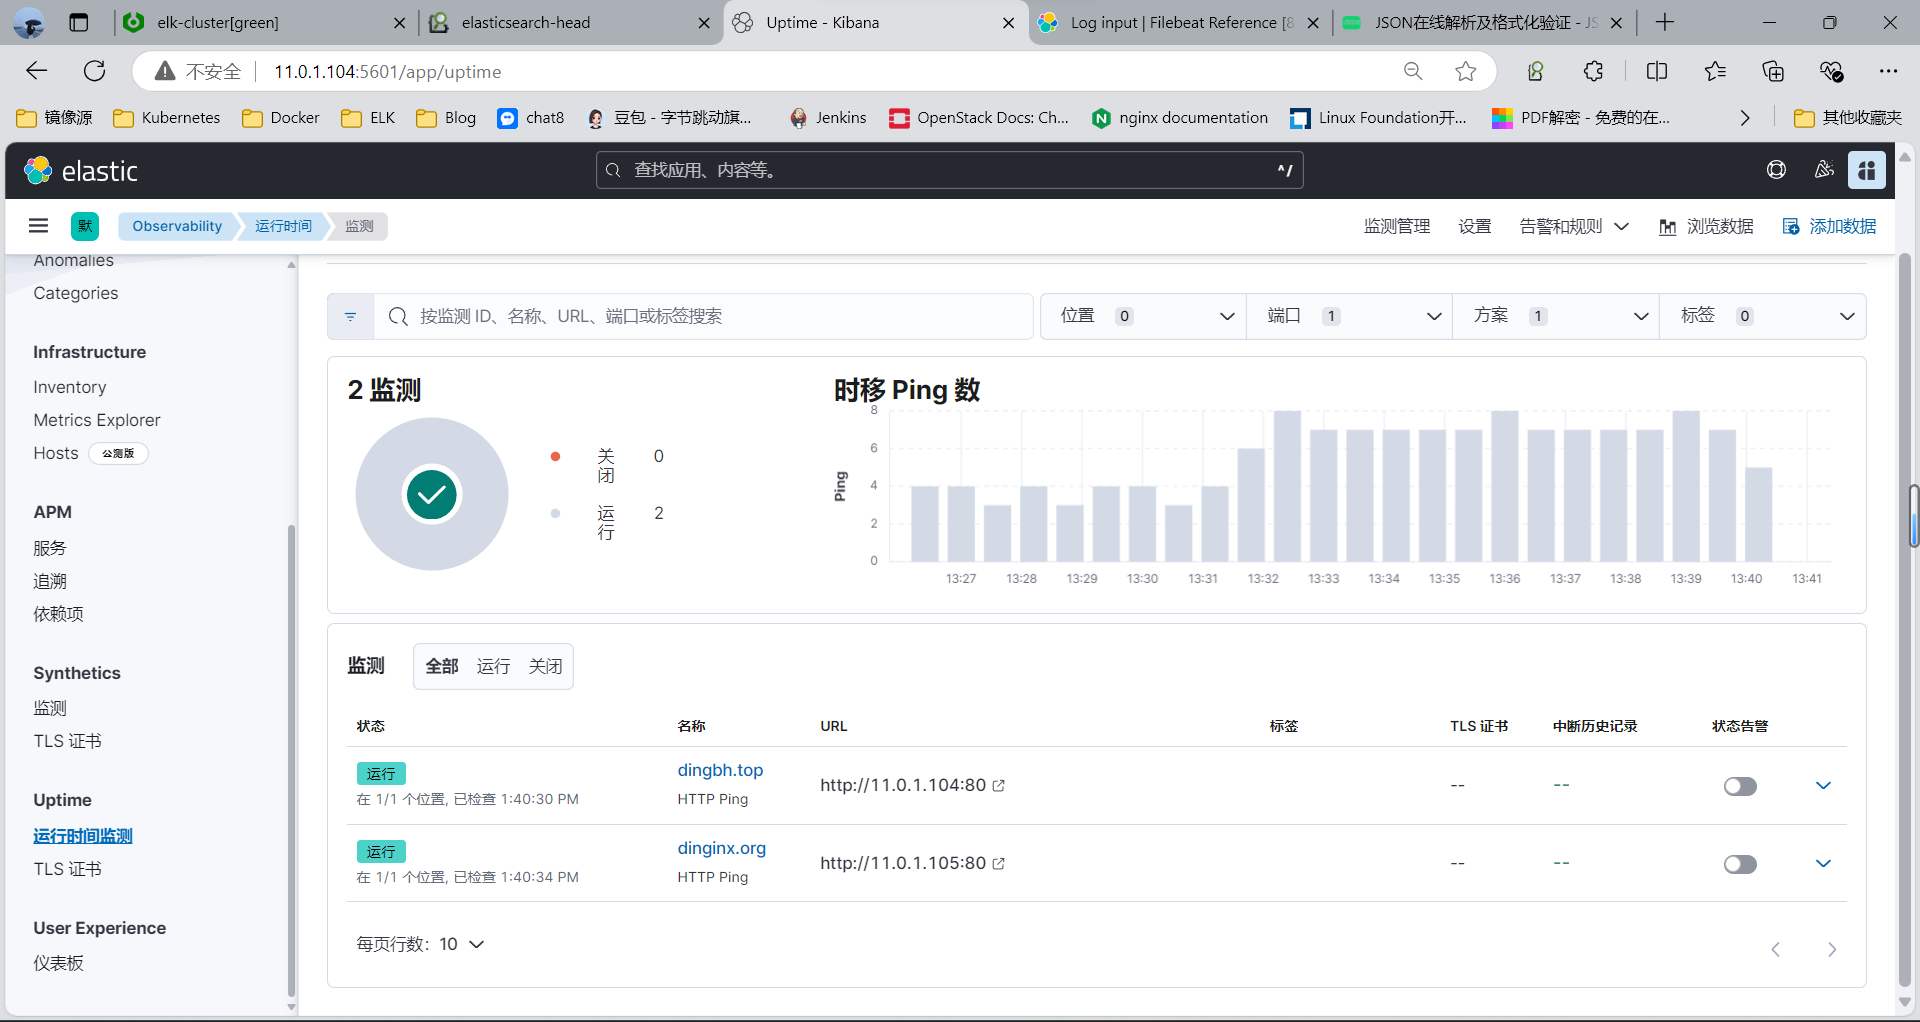
3.2 利用 Heartbeat 监控
heartbeat 用来定时探测服务是否正常运行。支持ICMP、TCP 和 HTTP,也支持TLS、身份验证和代理
官方heartbeat配置文档
https://www.elastic.co/guide/en/beats/heartbeat/current/configuring-howto-heartbeat.html
3.2.1 下载并安装
#下载链接
https://www.elastic.co/cn/downloads/beats/heartbeat
https://mirrors.tuna.tsinghua.edu.cn/elasticstack/8.x/apt/pool/main/h/heartbeat-elastic/
https://mirrors.tuna.tsinghua.edu.cn/elasticstack/7.x/apt/pool/main/h/heartbeat-elastic/#新版
[root@kibana01 ~]#ll
total 1043708
drwx------  6 root root      4096 Oct  2 13:13 ./
drwxr-xr-x 21 root root      4096 Sep  7  2023 ../
-rw-r--r--  1 root root      8894 Sep 29 09:53 1
-rw-------  1 root root      4710 Sep 29 22:53 .bash_history
-rw-r--r--  1 root root      3125 Nov 30  2023 .bashrc
drwx------  2 root root      4096 Oct  2  2023 .cache/
-rw-r--r--  1 root root 588546352 Sep 23 21:53 elasticsearch-8.14.3-amd64.deb
-rw-r--r--  1 root root  50436520 Sep 23 22:07 filebeat-8.14.3-amd64.deb
-rw-r--r--  1 root root  33725040 Sep 23 22:09 heartbeat-8.14.3-amd64.deb
-rw-r--r--  1 root root 3411.0.10 Sep 23 21:57 kibana-8.14.3-amd64.deb
-rw-r--r--  1 root root  54877340 Sep 23 22:10 metricbeat-8.14.3-amd64.deb
-rw-r--r--  1 root root       161 Dec  5  2019 .profile
drwx------  3 root root      4096 Sep  7  2023 snap/
drwx------  2 root root      4096 Sep  7  2023 .ssh/
drwxr-xr-x  2 root root      4096 Oct  2  2023 .vim/
-rw-------  1 root root     12996 Sep 29 23:42 .viminfo
-rw-------  1 root root       507 Oct  2 13:13 .Xauthority
[root@kibana01 ~]#dpkg -i heartbeat-8.14.3-amd64.deb#准备需要监控的服务httpd#修改配置文件
[root@kibana01 ~]#grep -Ev '^(.*#)|^$' /etc/heartbeat/heartbeat.yml
heartbeat.config.monitors:path: ${path.config}/monitors.d/*.ymlreload.enabled: falsereload.period: 5s
heartbeat.monitors:
- type: httpenabled: true		#改为trueid: dingbh.topname: dingbh.topurls: ["http://11.0.1.104:80"]		#被监控http服务域名schedule: '@every 10s'- type: tcpid: myhost-tcp-echoname: My Host TCP Echohosts: ["11.0.1.105:80"]  # default TCP Echo Protocolschedule: '@every 5s'
- type: icmp   #添加下面5行,用于监控ICMPid: ping-myhostname: My Host Pinghosts: ["11.0.1.100"]schedule: '*/5 * * * * * *'setup.template.settings:index.number_of_shards: 1index.codec: best_compression
setup.kibana:host: "11.0.1.104:5601"		#kibana服务器地址
output.elasticsearch:hosts: ["11.0.1.101:9200","11.0.1.102:9200","11.0.1.103:9200"]		#es服务器IPpreset: balanced
processors:- add_observer_metadata:#启动服务
systemctl enable --now heartbeat-elastic.service
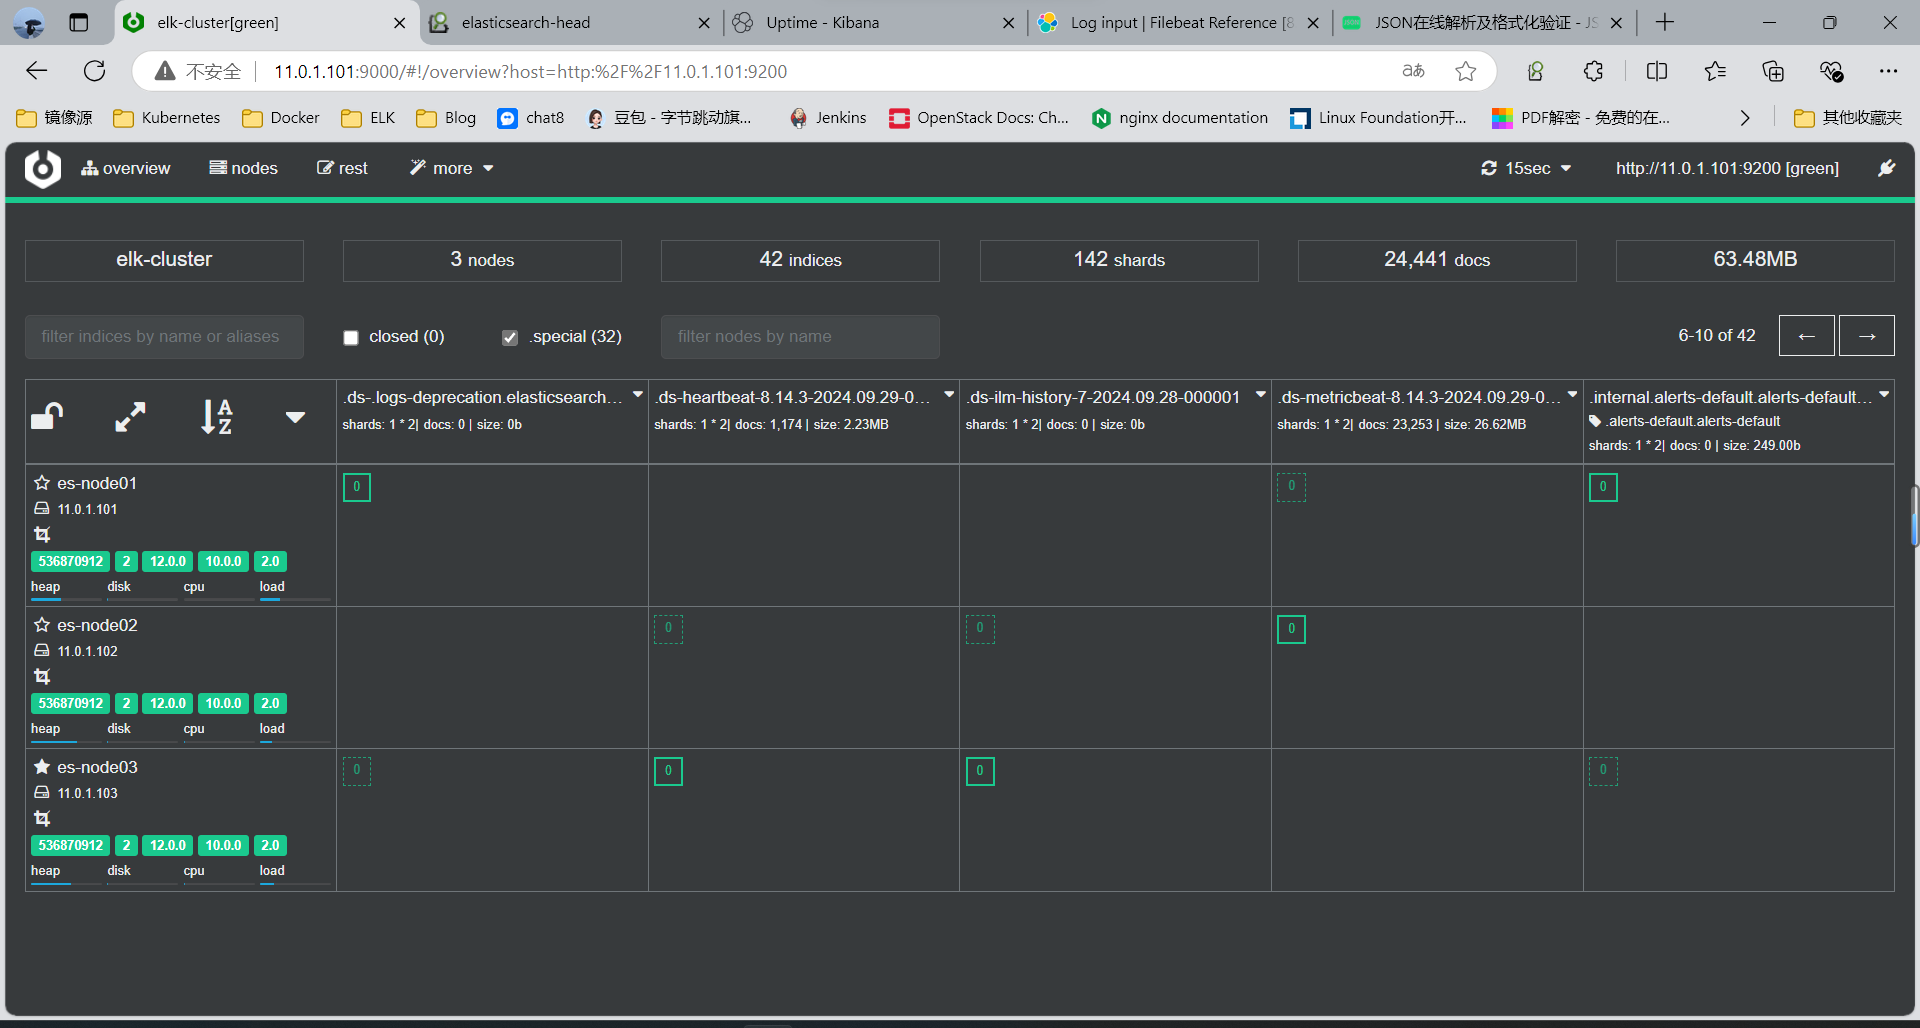
3.2.2 head 插件查看索引
3.2.3 通过 Kibana 查看收集的性能指标
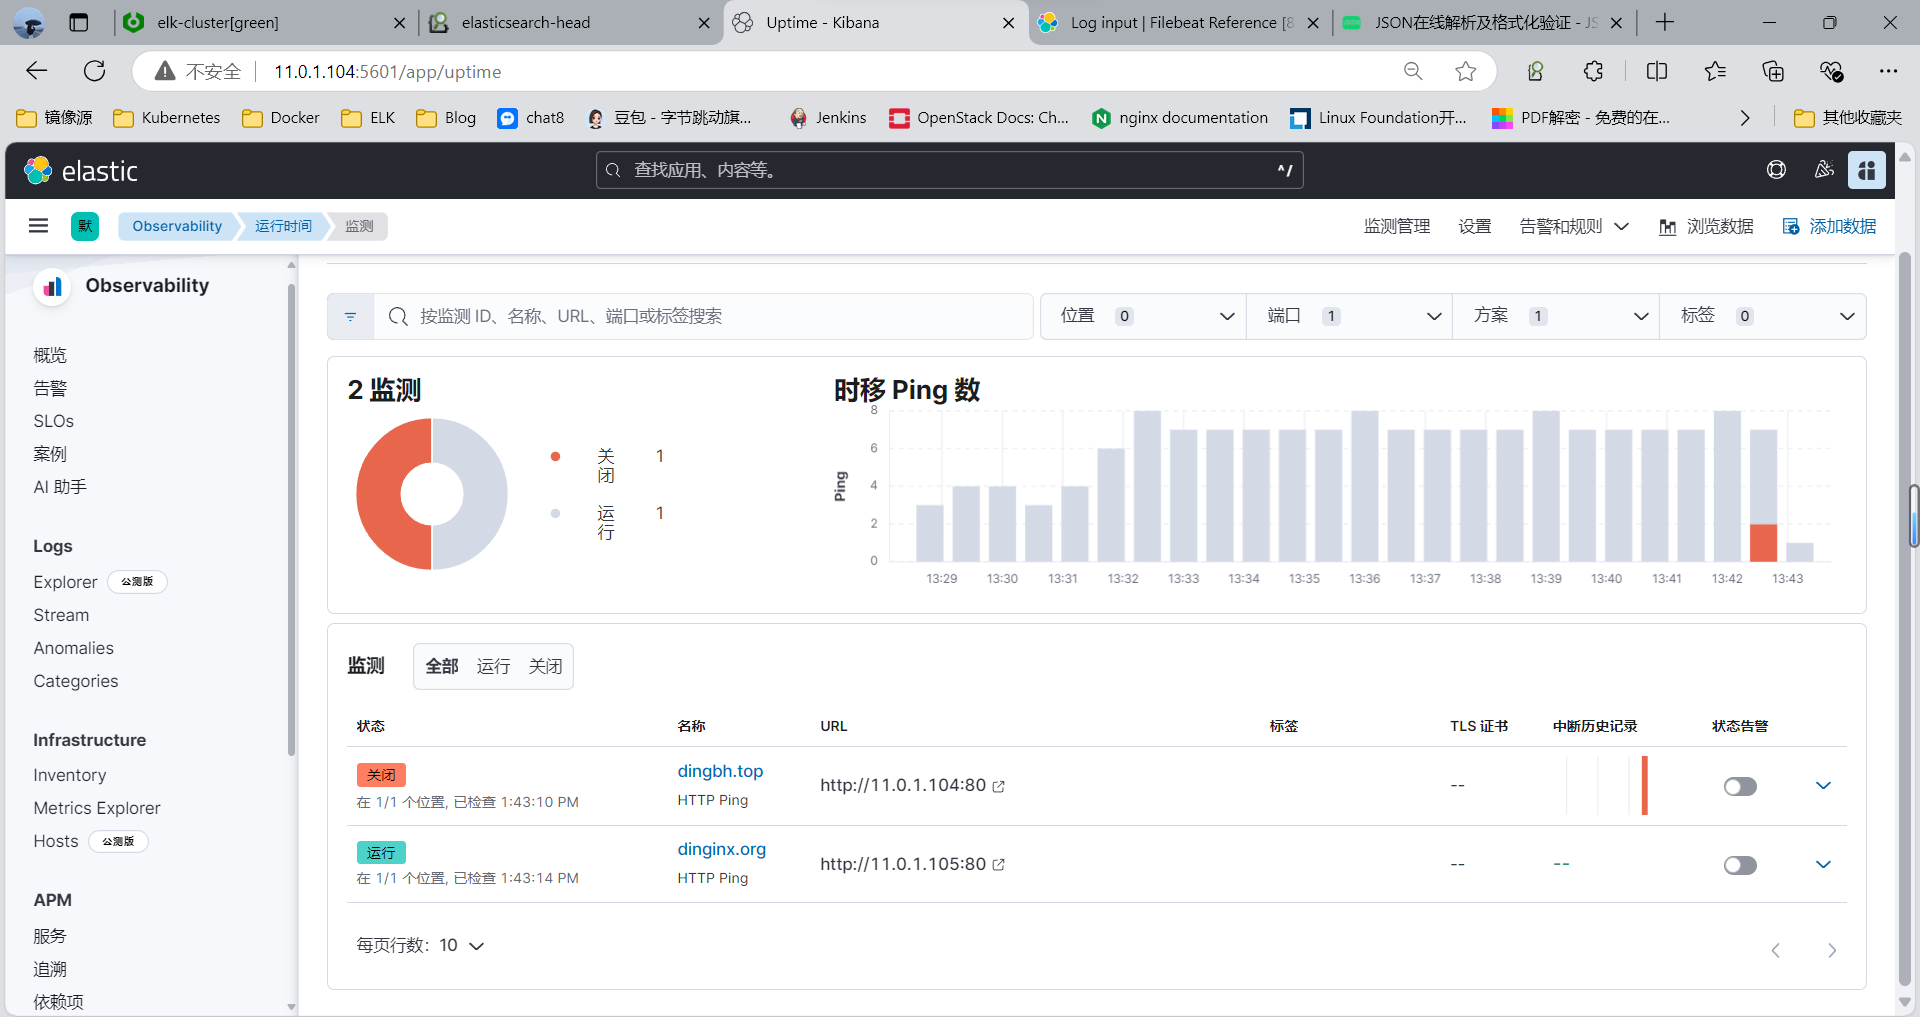
通过Kibana 可以看到主机的状态
新版
运行时间 — 监测
3.2.4 停止监控的服务再观察 Kibana
#Down 机后Refresh ,可以看到下面的橙色
systemctl stop nginx
3.3 利用 Filebeat 收集日志
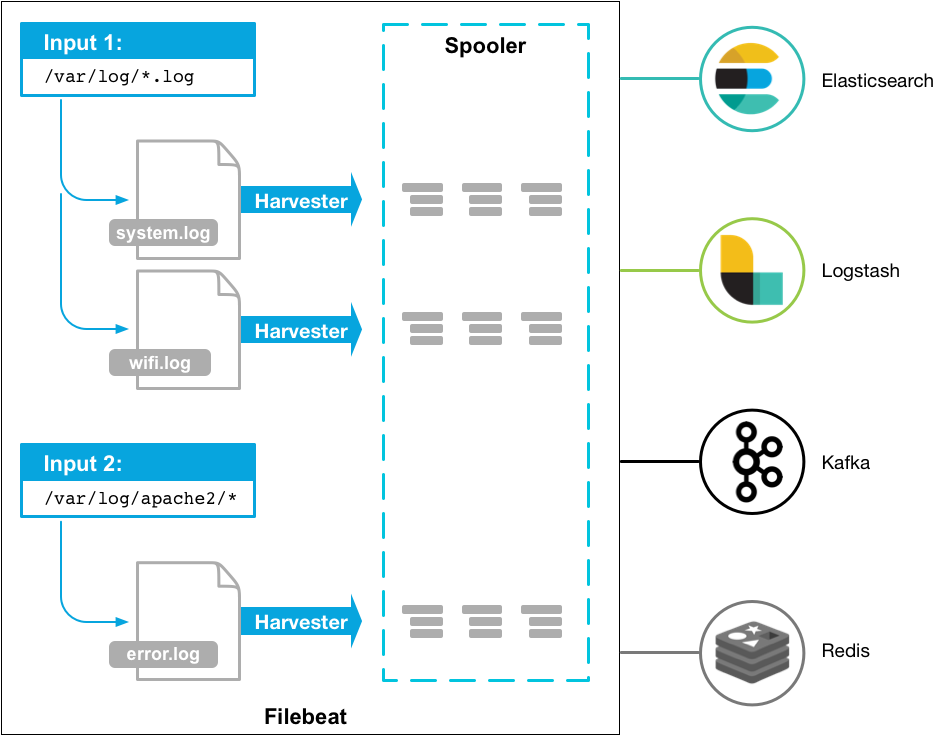
Filebeat 是用于转发和集中日志数据的轻量级传送程序。作为服务器上的代理安装,Filebeat监视您指定的日志文件或位置,收集日志事件,并将它们转发到Elasticsearch或Logstash进行索引。
Logstash 也可以直接收集日志,但需要安装JDK并且会占用至少500M 以上的内存
生产一般使用filebeat代替logstash, 基于go开发,部署方便,重要的是只需要10M多内存,比较节约资源.
filebeat 支持从日志文件,Syslog,Redis,Docker,TCP,UDP,标准输入等读取数据,对数据做简单处理,再输出至Elasticsearch,logstash,Redis,Kafka等
Filebeat的工作方式如下:
- 启动Filebeat时,它将启动一个或多个输入源,这些输入将在为日志数据指定的位置中查找。
- 对于Filebeat所找到的每个日志,Filebeat都会启动收集器harvester进程。
- 每个收集器harvester都读取一个日志以获取新内容,并将新日志数据发送到libbeat
- libbeat会汇总事件并将汇总的数据发送到为Filebeat配置的输出。
Filebeat 官方说明
https://www.elastic.co/guide/en/beats/filebeat/current/filebeat-overview.html
https://www.elastic.co/guide/en/beats/filebeat/current/configuring-howto-filebeat.html
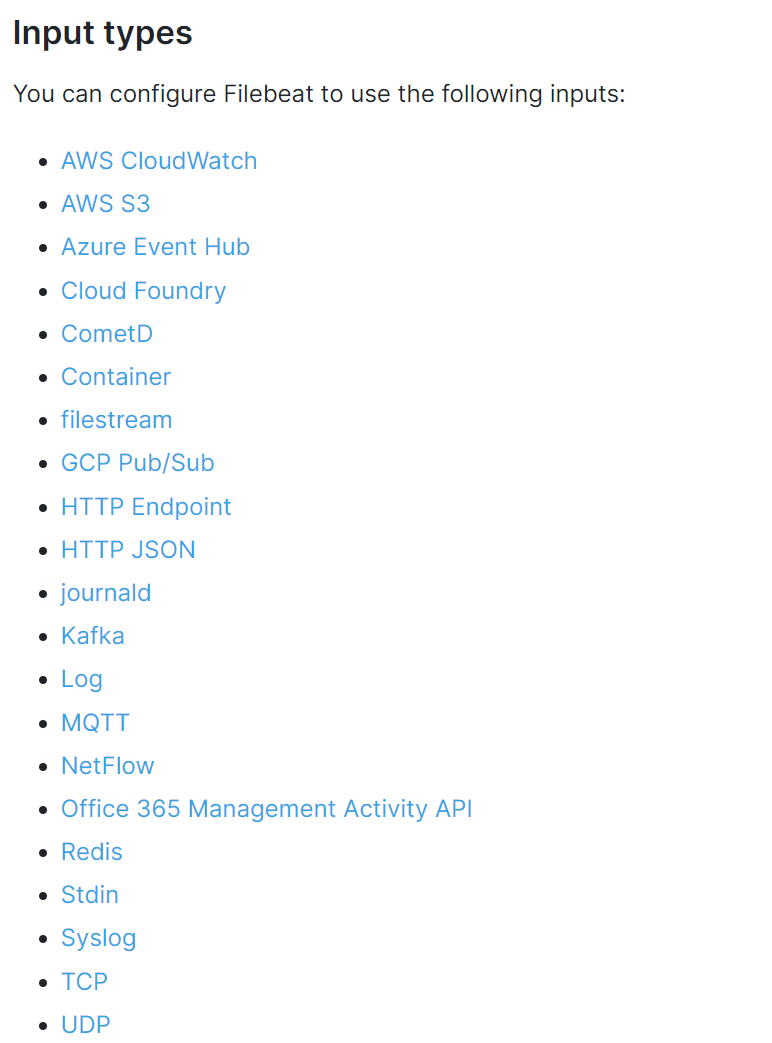
输入和输入官方说明
https://www.elastic.co/guide/en/beats/filebeat/current/configuration-filebeat-options.html
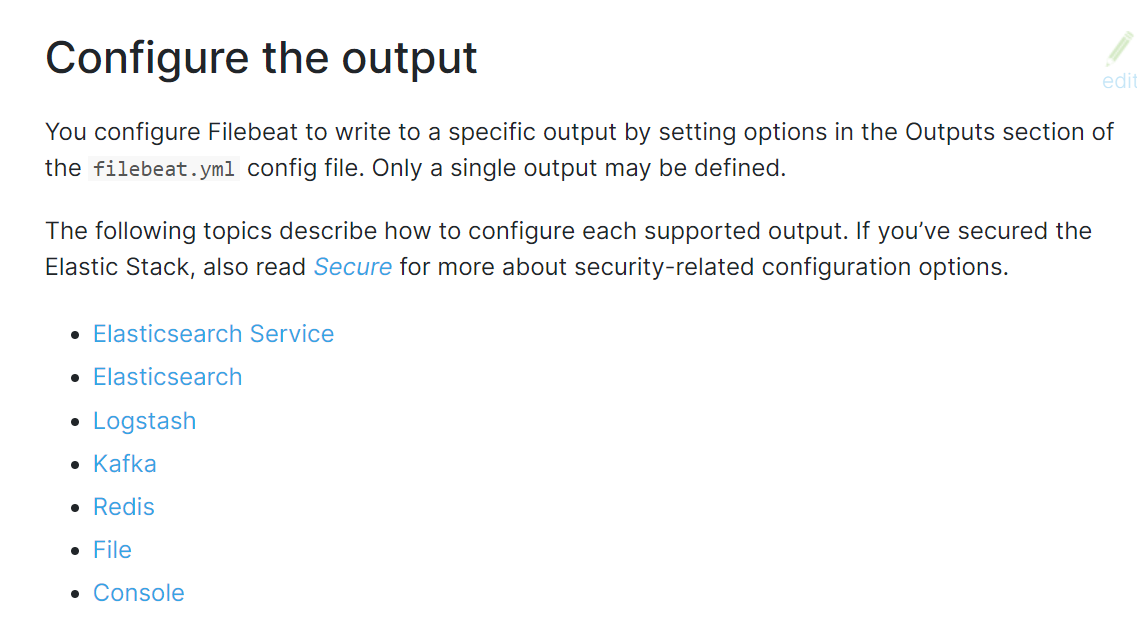
https://www.elastic.co/guide/en/beats/filebeat/current/configuring-output.html
注意: Filebeat 支持多个输入,但不支持同时有多个输出,如果多输出,会报错如下
Exiting: error unpacking config data: more than one namespace configured accessing 'output' (source:'/etc/filebeat/stdout_file.yml')
3.3.1 安装 Filebeat 和配置说明
下载链接
https://www.elastic.co/cn/downloads/beats/filebeat
3.3.1.1 安装 Filebeat
[root@kibana01 ~]#ll filebeat-8.14.3-amd64.deb -h
-rw-r--r-- 1 root root 49M Sep 23 14:07 filebeat-8.14.3-amd64.deb
[root@kibana01 ~]#dpkg -i filebeat-8.14.3-amd64.deb #默认没有启动
[root@kibana01 ~]#systemctl enable --now filebeat.service #filebeat以root身份启动
[root@kibana01 ~]#systemctl status filebeat.service |ps aux|grep filebeat
root       34670  1.3  2.5 1842004 101976 ?      Ssl  14:05   0:00 /usr/share/filebeat/bin/filebeat --environment systemd -c /etc/filebeat/filebeat.yml --path.home /usr/share/filebeat --path.config /etc/filebeat --path.data /var/lib/filebeat --path.logs /var/log/filebeat
root       34706  0.0  0.0   6432   660 pts/1    S+   14:06   0:00 grep --color=auto filebeat#先停止服务,方便后续调试
[root@kibana01 ~]#systemctl stop filebeat
3.3.1.2 Filebeat 配置
配置文件官方说明
https://www.elastic.co/guide/en/beats/filebeat/current/configuring-howto-filebeat.html
https://www.elastic.co/guide/en/beats/filebeat/8.3/configuration-general-options.html
Filebeat的 默认配置文件是/etc/filebeat/filebeat.yml,遵循YAML语法。常见配置包括如下
- Filebeat
- Output
- Shipper
- Logging(可选)
- Run Options(可选)
filebeat.yml的格式说明
{input_type: log
#指定输入类型
paths
#支持基本的正则,所有golang glob都支持,支持/var/log/*/*.log
encoding
#plain, latin1, utf-8, utf-16be-bom, utf-16be, utf-16le, big5, gb18030, gbk, hzgb-2312,
euc-kr, euc-jp, iso-2022-jp, shift-jis, and so on
exclude_lines
#支持正则 排除匹配的行,如果有多行,合并成一个单一行来进行过滤
include_lines
#支持正则 include_lines执行完毕之后会执行exclude_lines。
exclude_files
#支持正则 排除匹配的文件
exclude_files: ['.gz$']
tags
#列表中添加标签,用过过滤
filebeat.inputs:
- paths: ["/var/log/app/*.json"]
tags: ["json"]
fields
#可选字段,选择额外的字段进行输出
#可以是标量值,元组,字典等嵌套类型ignore_older
#可以指定Filebeat忽略指定时间段以外修改的日志内容
#文件被忽略之前,确保文件不在被读取,必须设置ignore older时间范围大于close_inactive
#如果一个文件正在读取时候被设置忽略,它会取得到close_inactive后关闭文件,然后文件被忽略
close_*
#close_ *配置选项用于在特定标准或时间之后关闭harvester。 关闭harvester意味着关闭文件处理程
序。 如果在harvester关闭后文件被更新,则在scan_frequency过后,文件将被重新拾取。 但是,如果
在harvester关闭时移动或删除文件,Filebeat将无法再次接收文件,并且harvester未读取的任何数据都
将丢失。
close_inactive
#启动选项时,如果在制定时间没有被读取,将关闭文件句柄
#读取的最后一条日志定义为下一次读取的起始点,而不是基于文件的修改时间
#如果关闭的文件发生变化,一个新的harverster将在scan_frequency运行后被启动
#建议至少设置一个大于读取日志频率的值,配置多个prospector来实现针对不同更新速度的日志文件
#使用内部时间戳机制,来反映记录日志的读取,每次读取到最后一行日志时开始倒计时
#使用2h 5m 来表示
recursive_glob.enabled
#递归匹配日志文件,默认false
close_rename
#当选项启动,如果文件被重命名和移动,filebeat关闭文件的处理读取
close_removed
#当选项启动,文件被删除时,filebeat关闭文件的处理读取
#这个选项启动后,必须启动clean_removed
close_eof
#适合只写一次日志的文件,然后filebeat关闭文件的处理读取
close_timeout
#当选项启动时,filebeat会给每个harvester设置预定义时间,不管这个文件是否被读取,达到设定时间
后,将被关闭
close_timeout 不能等于ignore_older,会导致文件更新时,不会被读取
#如果output一直没有输出日志事件,这个timeout是不会被启动的,至少要要有一个事件发送,然后
haverter将被关闭
#设置0 表示不启动
clean_inactived
#从注册表文件中删除先前收获的文件的状态
#设置必须大于ignore_older+scan_frequency,以确保在文件仍在收集时没有删除任何状态
#配置选项有助于减小注册表文件的大小,特别是如果每天都生成大量的新文件
#此配置选项也可用于防止在Linux上重用inode的Filebeat问题
clean_removed
#启动选项后,如果文件在磁盘上找不到,将从注册表中清除filebeat
#如果关闭close removed 必须关闭clean removed
scan_frequency
#prospector检查指定用于收获的路径中的新文件的频率,默认10s
document_type
#类型事件,被用于设置输出文档的type字段,默认是logharvester_buffer_size
#每次harvester读取文件缓冲字节数,默认是16384
max_bytes
#对于多行日志信息,很有用,最大字节数
json
#这些选项使Filebeat解码日志结构化为JSON消息,逐行进行解码json
keys_under_root
#设置key为输出文档的顶级目录
overwrite_keys
#覆盖其他字段
add_error_key
#定义一个json_error
message_key
#指定json 关键建作为过滤和多行设置,与之关联的值必须是string
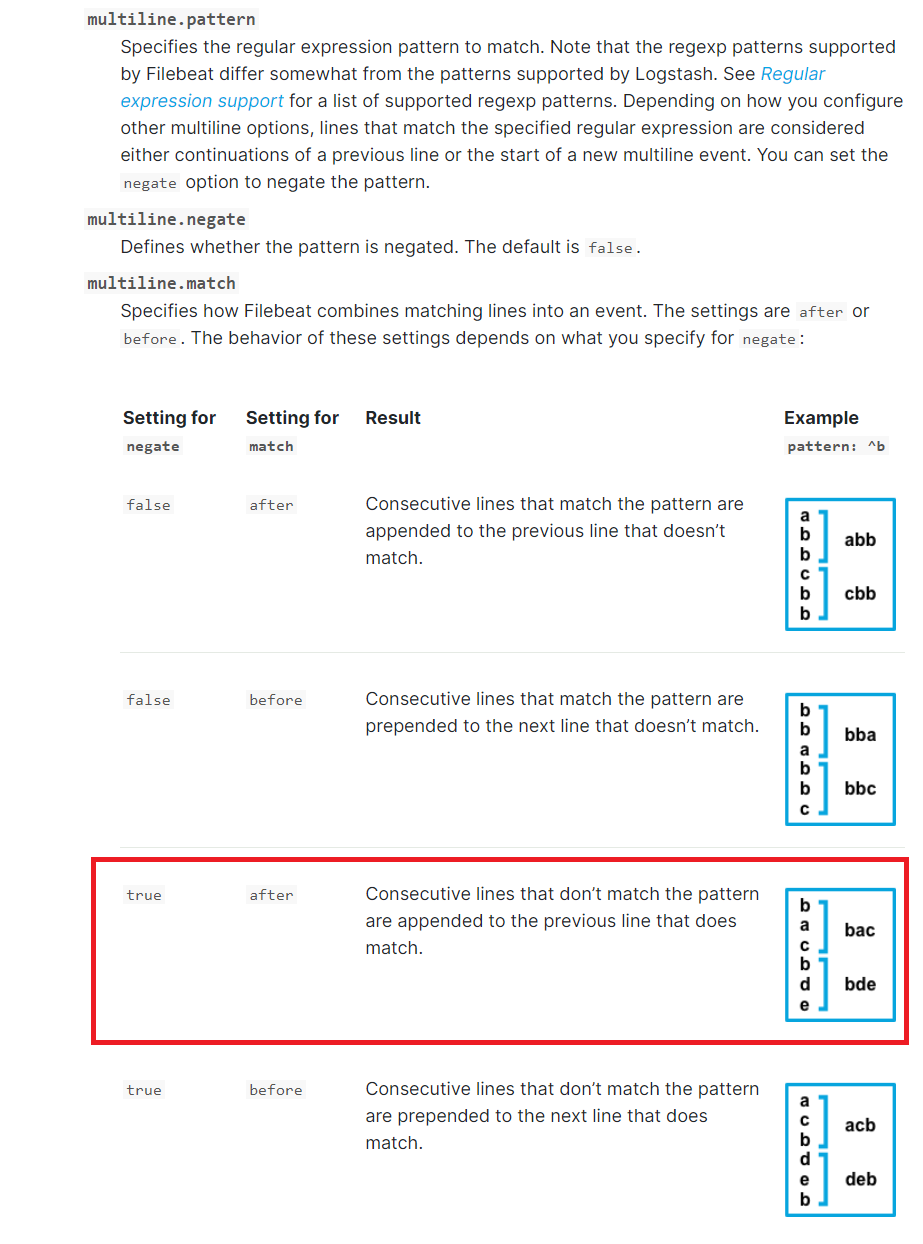
multiline
#控制filebeat如何处理跨多行日志的选项,多行日志通常发生在java堆栈中
multiline.pattern: '^\['
multiline.negate: true
multiline.match: after
上面匹配是将多行日志所有不是以[符号开头的行合并成一行它可以将下面的多行日志进行合并成一行
multiline.pattern
指定匹配的正则表达式,filebeat支持的regexp模式与logstash支持的模式有所不同
pattern regexp
multiline.negate
定义上面的模式匹配条件的动作是 否定的,默认是false
假如模式匹配条件'^b',默认是false模式,表示讲按照模式匹配进行匹配 将不是以b开头的日志行进行合并
如果是true,表示将不以b开头的日志行进行合并
multiline.match
#指定Filebeat如何将匹配行组合成事件,在之前或者之后,取决于上面所指定的negate
multiline.max_lines
#可以组合成一个事件的最大行数,超过将丢弃,默认500
multiline.timeout
#定义超时时间,如果开始一个新的事件在超时时间内没有发现匹配,也将发送日志,默认是5s
tail_files
#如果此选项设置为true,Filebeat将在每个文件的末尾开始读取新文件,而不是开头
#此选项适用于Filebeat尚未处理的文件
symlinks
#符号链接选项允许Filebeat除常规文件外,可以收集符号链接。收集符号链接时,即使为符号链接的路径,
Filebeat也会打开并读取原始文件。
backoff
#backoff选项指定Filebeat如何积极地抓取新文件进行更新。默认1s
#backoff选项定义Filebeat在达到EOF之后再次检查文件之间等待的时间。
max_backoff#在达到EOF之后再次检查文件之前Filebeat等待的最长时间
backoff_factor
#指定backoff尝试等待时间几次,默认是2
harvester_limit
#harvester_limit选项限制一个prospector并行启动的harvester数量,直接影响文件打开数
enabled
#控制prospector的启动和关闭
filebeat global
spool_size
#事件发送的阀值,超过阀值,强制刷新网络连接
filebeat.spool_size: 2048
publish_async
#异步发送事件,实验性功能
idle_timeout
#事件发送的超时时间,即使没有超过阀值,也会强制刷新网络连接
filebeat.idle_timeout: 5s
registry_file
#注册表文件的名称,如果使用相对路径,则被认为是相对于数据路径
#有关详细信息,请参阅目录布局部分 默认值为${path.data}/registry
filebeat.registry_file: registry
config_dir
#包含额外的prospector配置文件的目录的完整路径
#每个配置文件必须以.yml结尾
#每个配置文件也必须指定完整的Filebeat配置层次结构,即使只处理文件的prospector部分。
#所有全局选项(如spool_size)将被忽略
#必须是绝对路径
filebeat.config_dir: path/to/configs
shutdown_timeout
#Filebeat等待发布者在Filebeat关闭之前完成发送事件的时间。
Filebeat General
name
#设置名字,如果配置为空,则用该服务器的主机名
name: "my-shipper"
queue_size
#单个事件内部队列的长度 默认1000
bulk_queue_size
#批量事件内部队列的长度
max_procs
#设置最大使用cpu数量
范例:添加新字段
3.3.2 案例: 从标准输入读取再输出至标准输出
3.3.2.1 创建配置
[root@kibana01 ~]# cat /etc/filebeat/modules.d/stdin.yml
filebeat.inputs:
- type: stdinenabled: true
output.console:pretty: trueenable: true#配置检查
[root@kibana01 ~]# filebeat test config -c /etc/filebeat/modules.d/stdin.yml
Config OK
3.3.2.2 执行读取
#从指定文件中读取配置
#-e 表示Log to stderr and disable syslog/file output
[root@kibana01 ~]#filebeat -e -c /etc/filebeat/modules.d/stdin.yml ... ...hello world		#标准输入内容,以下为生成的数据
{"@timestamp": "2024-10-02T06:25:26.909Z","@metadata": {"beat": "filebeat","type": "_doc","version": "8.14.3"},"input": {"type": "stdin"},"ecs": {"version": "8.0.0"},"host": {"name": "kibana01.dinginx.org"},"agent": {"type": "filebeat","version": "8.14.3","ephemeral_id": "5eb661df-0710-429e-8b00-987095f5e3bf","id": "c5e80544-fb8d-4ec1-a3de-d954f88c429a","name": "kibana01.dinginx.org"},"message": "hello world",		#真正的数据只有此行,其它都是Filebeat添加的元数据"log": {"offset": 0,"file": {"path": ""}}
}
{"log.level":"error","@timestamp":"2024-10-02T14:25:36.913+0800","log.origin":{"function":"github.com/elastic/beats/v7/filebeat/input/file.(*States).CleanupWith","file.name":"file/states.go","file.line":125},"message":"State for  should have been dropped, but couldn't as state is not finished.","service.name":"filebeat","ecs.version":"1.6.0"}......
3.3.3 案例: 从标准输入读取再输出至 Json 格式的文件
3.3.3.1 创建配置
#8.X版本生成的文件名,json.keys_under_root: false
[root@kibana01 ~]#cat /etc/filebeat/modules.d/stdout_file.yml
filebeat.inputs:
- type: stdinjson.keys_under_root: true		#添加此段
output.console:pretty: trueenable: true[root@kibana01 ~]#filebeat test  config -c /etc/filebeat/modules.d/stdout_file.yml
Config OK#输入如下Json格式信息,再回车后输出如下
{"name" : "dingbaohang", "age" : "18", "phone" : "0123456789"}[root@kibana01 ~]#filebeat -c /etc/filebeat/modules.d/stdout_file.yml
{"name" : "dingbaohang", "age" : "18", "phone" : "0123456789"}
{"@timestamp": "2024-10-02T06:43:36.118Z","@metadata": {"beat": "filebeat","type": "_doc","version": "8.14.3"},"input": {"type": "stdin"},"ecs": {"version": "8.0.0"},"host": {"name": "kibana01.dinginx.org"},"agent": {"version": "8.14.3","ephemeral_id": "0ee3848b-c4cd-4126-9515-90833f26c935","id": "c5e80544-fb8d-4ec1-a3de-d954f88c429a","name": "kibana01.dinginx.org","type": "filebeat"},"name": "dingbaohang",		#生成独立字段的Json数据"log": {"file": {"path": ""},"offset": 0},"age": "18","phone": "0123456789"
}#查看log文件
[root@kibana01 ~]#cat /tmp/filebeat.log-20241002.ndjson |jq{"@timestamp": "2024-10-02T07:10:06.248Z","@metadata": {"beat": "filebeat","type": "_doc","version": "8.14.3"},"message": "hello world!","input": {"type": "stdin"},"ecs": {"version": "8.0.0"},"host": {"name": "kibana01.dinginx.org"},"agent": {"ephemeral_id": "25cb3a18-6161-40ce-a158-53de61747dfb","id": "c5e80544-fb8d-4ec1-a3de-d954f88c429a","name": "kibana01.dinginx.org","type": "filebeat","version": "8.14.3"},"log": {"offset": 0,"file": {"path": ""}},"json": {}
}
3.3.4 案例: 从文件读取再输出至标准输出
https://www.elastic.co/guide/en/beats/filebeat/current/filebeat-input-log.html
filebeat 会将每个文件的读取数据的相关信息记录在/var/lib/filebeat/registry/filebeat/log.json文件中,可以实现日志采集的持续性,而不会重复采集
3.3.4.1 创建配置
[root@kibana01 ~]#cat /etc/filebeat/modules.d/file.yml
filebeat.inputs:
- type: logjson.keys_under_root: truepaths:#- /var/log/syslog- /var/log/test.log
output.console:pretty: trueenable: true[root@kibana01 ~]#filebeat test config -c /etc/filebeat/modules.d/file.yml
Config OK
3.3.4.2 执行读取
[root@kibana01 ~]#filebeat -e -c /etc/filebeat/modules.d/file.yml......sed -n '3p'  /var/log/syslog > /var/log/test.log		#模拟数据生成......{"@timestamp": "2024-10-02T07:32:27.095Z","@metadata": {"beat": "filebeat","type": "_doc","version": "8.14.3"},"log": {"offset": 128,"file": {"path": "/var/log/test.log"}},"json": {},"message": "Oct  2 12:59:06 kibana01 systemd[1]: man-db.service: Succeeded.","input": {"type": "log"},"ecs": {"version": "8.0.0"},"host": {"name": "kibana01.dinginx.org"},"agent": {"ephemeral_id": "e198106e-a522-43ed-ad17-cce6a551f14e","id": "c5e80544-fb8d-4ec1-a3de-d954f88c429a","name": "kibana01.dinginx.org","type": "filebeat","version": "8.14.3"}
}#filebeat记录日志文件读取的当前位置,以防止重复读取日志
[root@kibana01 ~]#cat /var/lib/filebeat/registry/filebeat/log.json
{"op":"set","id":1}
{"k":"filebeat::logs::","v":{"identifier_name":"","id":"","prev_id":"","source":"","timestamp":[2062186294301,1727850026],"ttl":0,"type":"","FileStateOS":{"inode":0,"device":0},"offset":1}}
{"op":"set","id":2}
{"k":"filebeat::logs::","v":{"type":"","FileStateOS":{"inode":0,"device":0},"identifier_name":"","id":"","offset":1,"timestamp":[2062186294301,1727850026],"ttl":0,"prev_id":"","source":""}}
{"op":"set","id":3}
{"k":"filebeat::logs::native::0-0","v":{"id":"native::0-0","prev_id":"","source":"","offset":1,"FileStateOS":{"device":0,"inode":0},"timestamp":[2062186294301,1727850026],"ttl":-2,"type":"","identifier_name":"native"}}
{"op":"set","id":4}
{"k":"filebeat::logs::","v":{"ttl":0,"type":"","FileStateOS":{"inode":0,"device":0},"id":"","timestamp":[2061662661557,1727850056],"offset":6,"identifier_name":"","prev_id":"","source":""}}
{"op":"set","id":5}
{"k":"filebeat::logs::native::0-0","v":{"offset":1,"ttl":-2,"type":"","FileStateOS":{"inode":0,"device":0},"id":"native::0-0","prev_id":"","source":"","timestamp":[2062186294301,1727850026],"identifier_name":"native"}}
{"op":"set","id":6}
{"k":"filebeat::logs::","v":{"type":"","identifier_name":"","timestamp":[2061662661557,1727850056],"ttl":0,"FileStateOS":{"inode":0,"device":0},"id":"","prev_id":"","source":"","offset":6}}
{"op":"set","id":7}......
3.3.5 案例: 利用 Filebeat 收集系统日志到 ELasticsearch
https://www.elastic.co/guide/en/beats/filebeat/current/elasticsearch-output.html
Filebeat收集的日志在Elasticsearch中默认生成的索引名称为
#新版
.ds-filebeat-<版本>-<时间>-<ID>
#旧版
filebeat-<版本>-<时间>-<ID>
3.3.5.1 修改配置
#修改syslog.conf
[root@kibana01 /etc/filebeat]# vim /etc/rsyslog.conf
*.* /var/log/system.log
[root@kibana01 /etc/filebeat]# systemctl restart rsyslog.service[root@kibana01 /etc/filebeat]# cat filebeat.yml
filebeat.inputs:
- type: logenabled: true 		 #开启日志paths:- /var/log/system.log		 #指定收集的日志文件#-------------------------- Elasticsearch output ------------------------------
output.elasticsearch:hosts: ["11.0.1.101:9200","11.0.1.102:9200","11.0.1.103:9200"]   #指定ELK集群任意节点的地址和端口,多个地址容错index: "system104-%{[agent.version]}-%{+yyyy.MM.dd}"  # 定义索引名称模板,格式为 "system104-Filebeat版本号-日期"setup.ilm.enabled: false  # 禁用 Elasticsearch 的 ILM(Index Lifecycle Management)功能
setup.template.name: "system104"  # 定义自定义模板的名称为 "system104"
setup.template.pattern: "system104-*"  # 指定模板匹配的索引模式,适用于所有以 "system104-" 开头的索引setup.template.settings:  # 定义 Elasticsearch 模板的配置选项index.number_of_shards: 3  # 设置每个索引的主分片数量为 3index.number_of_replicas: 1  # 设置每个分片的副本数量为 1#启动服务
[root@kibana01 /etc/filebeat]# systemctl enable --now filebeat.service
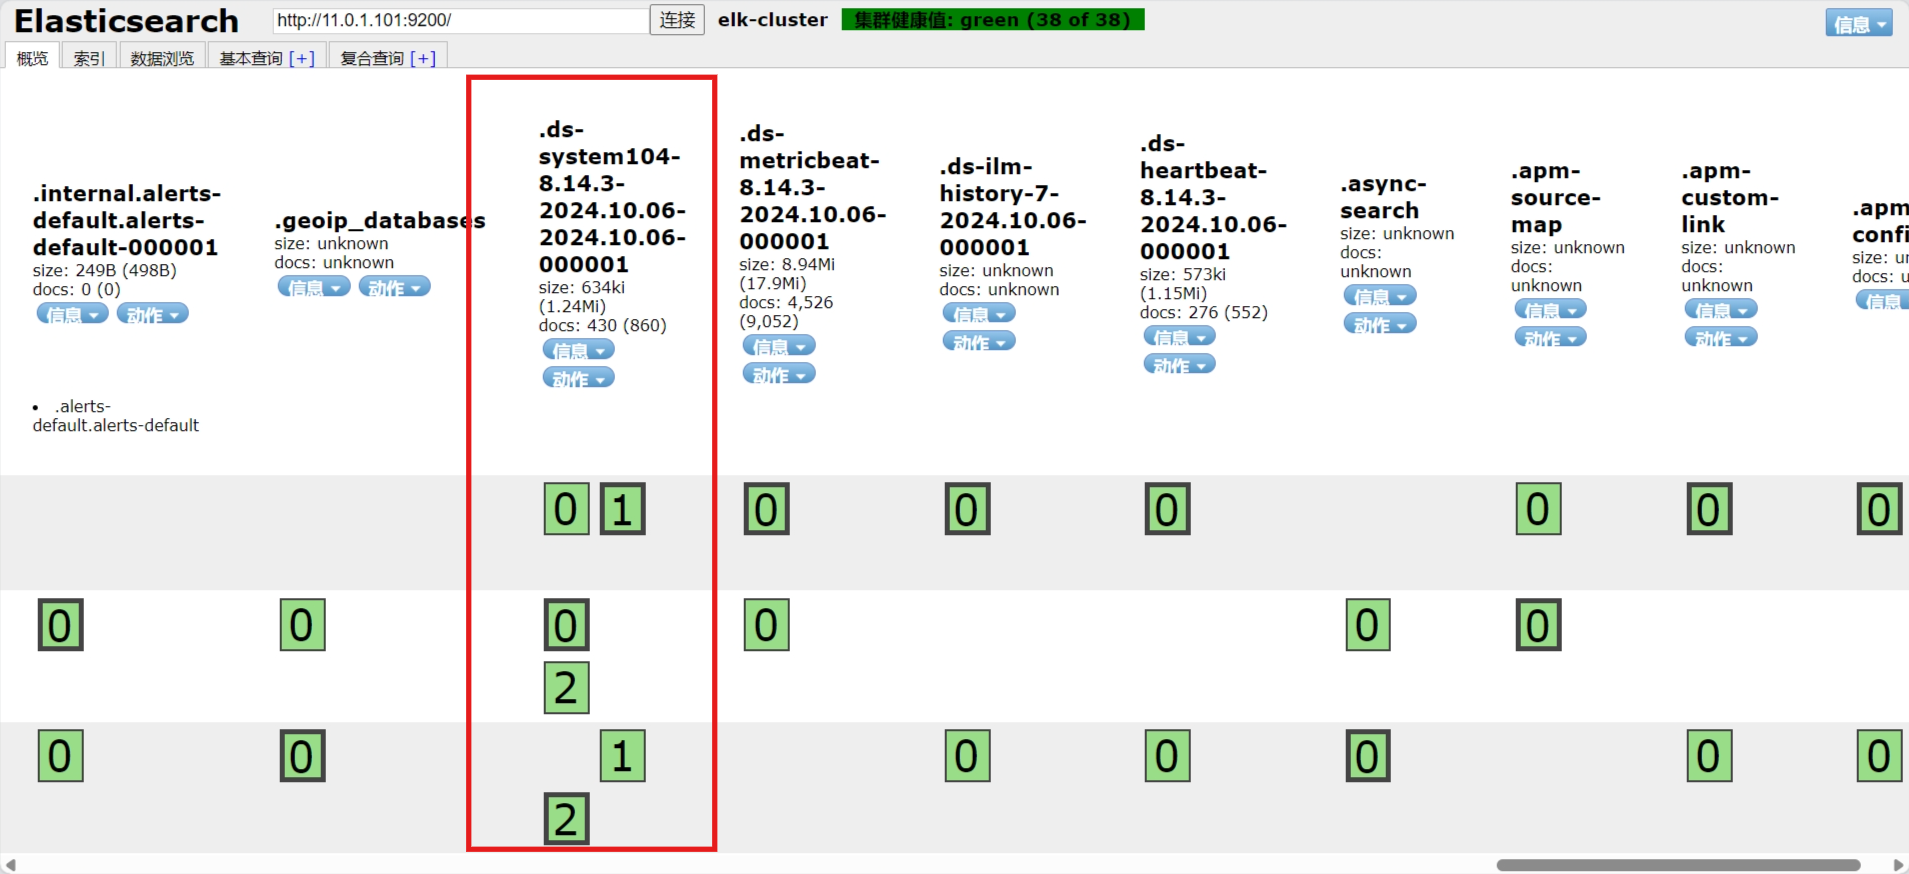
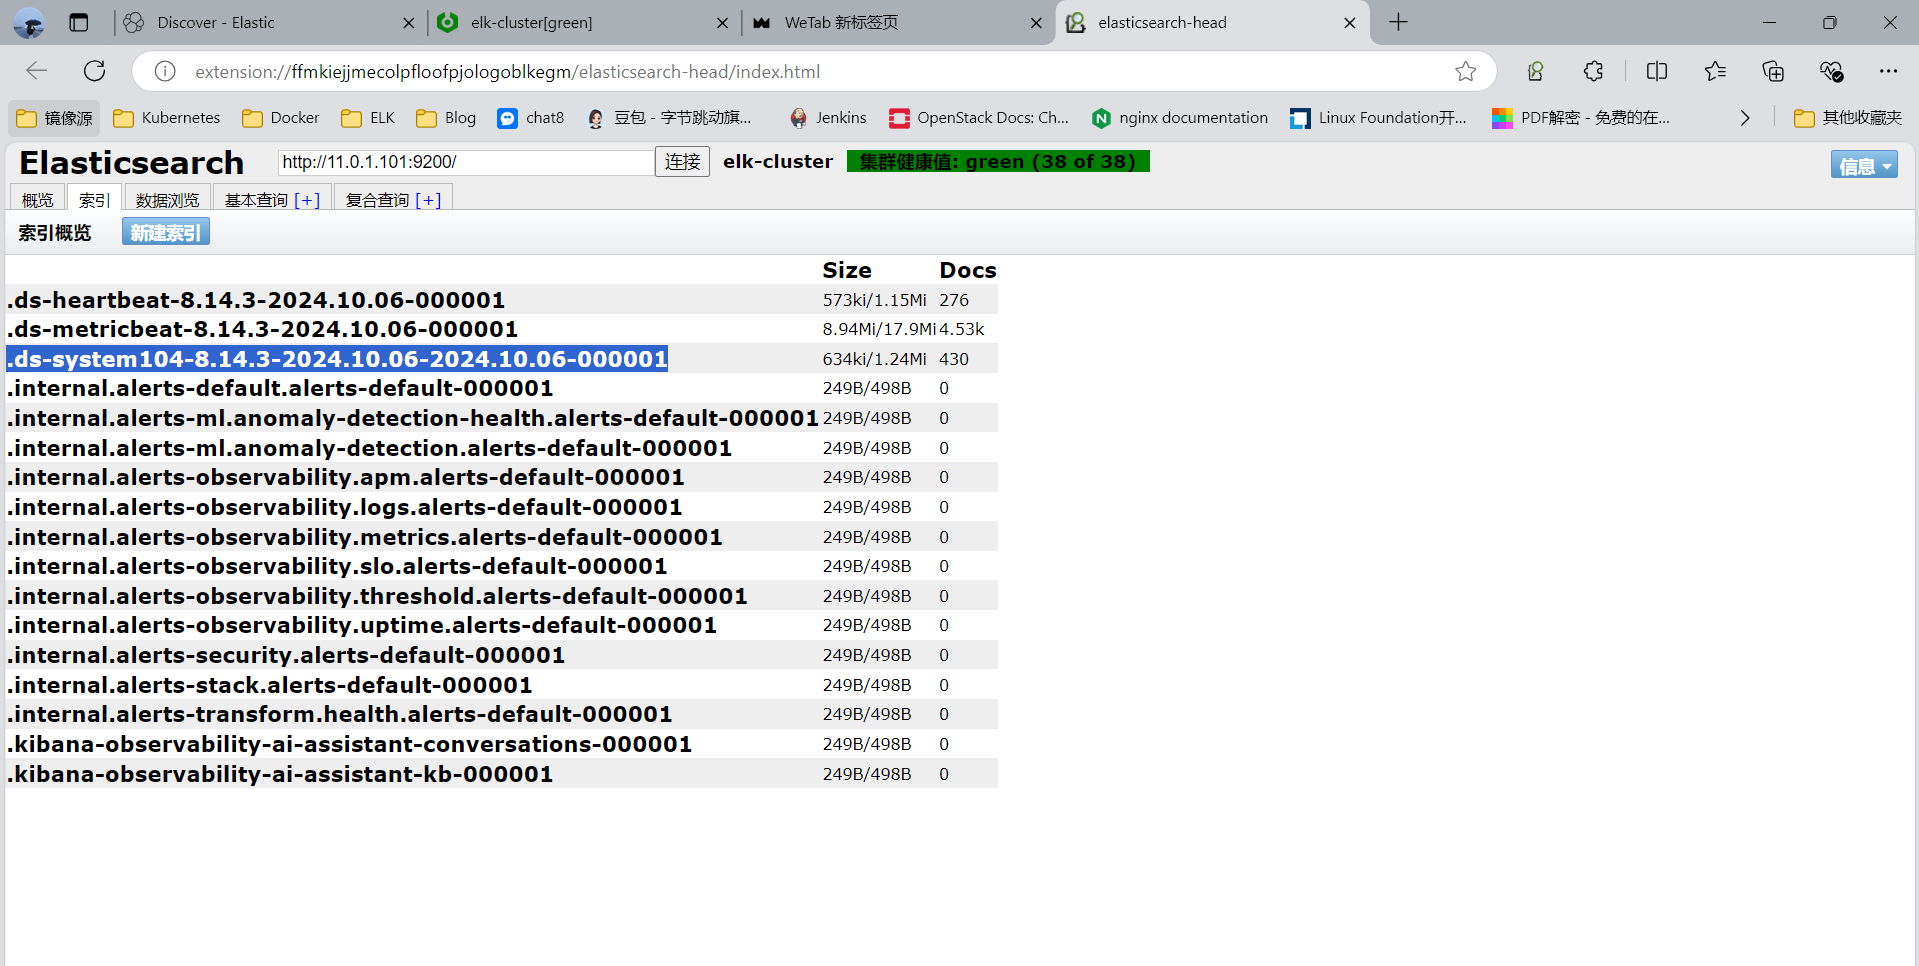
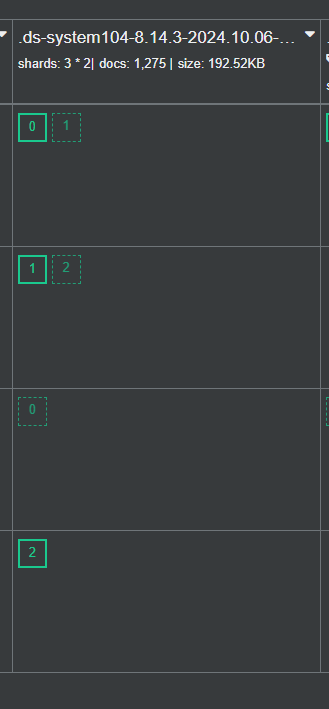
3.3.5.2 插件查看索引
测试用ssh登录,用插件查看日志
注意:8.X版后索引名默认为.ds-filebeat—
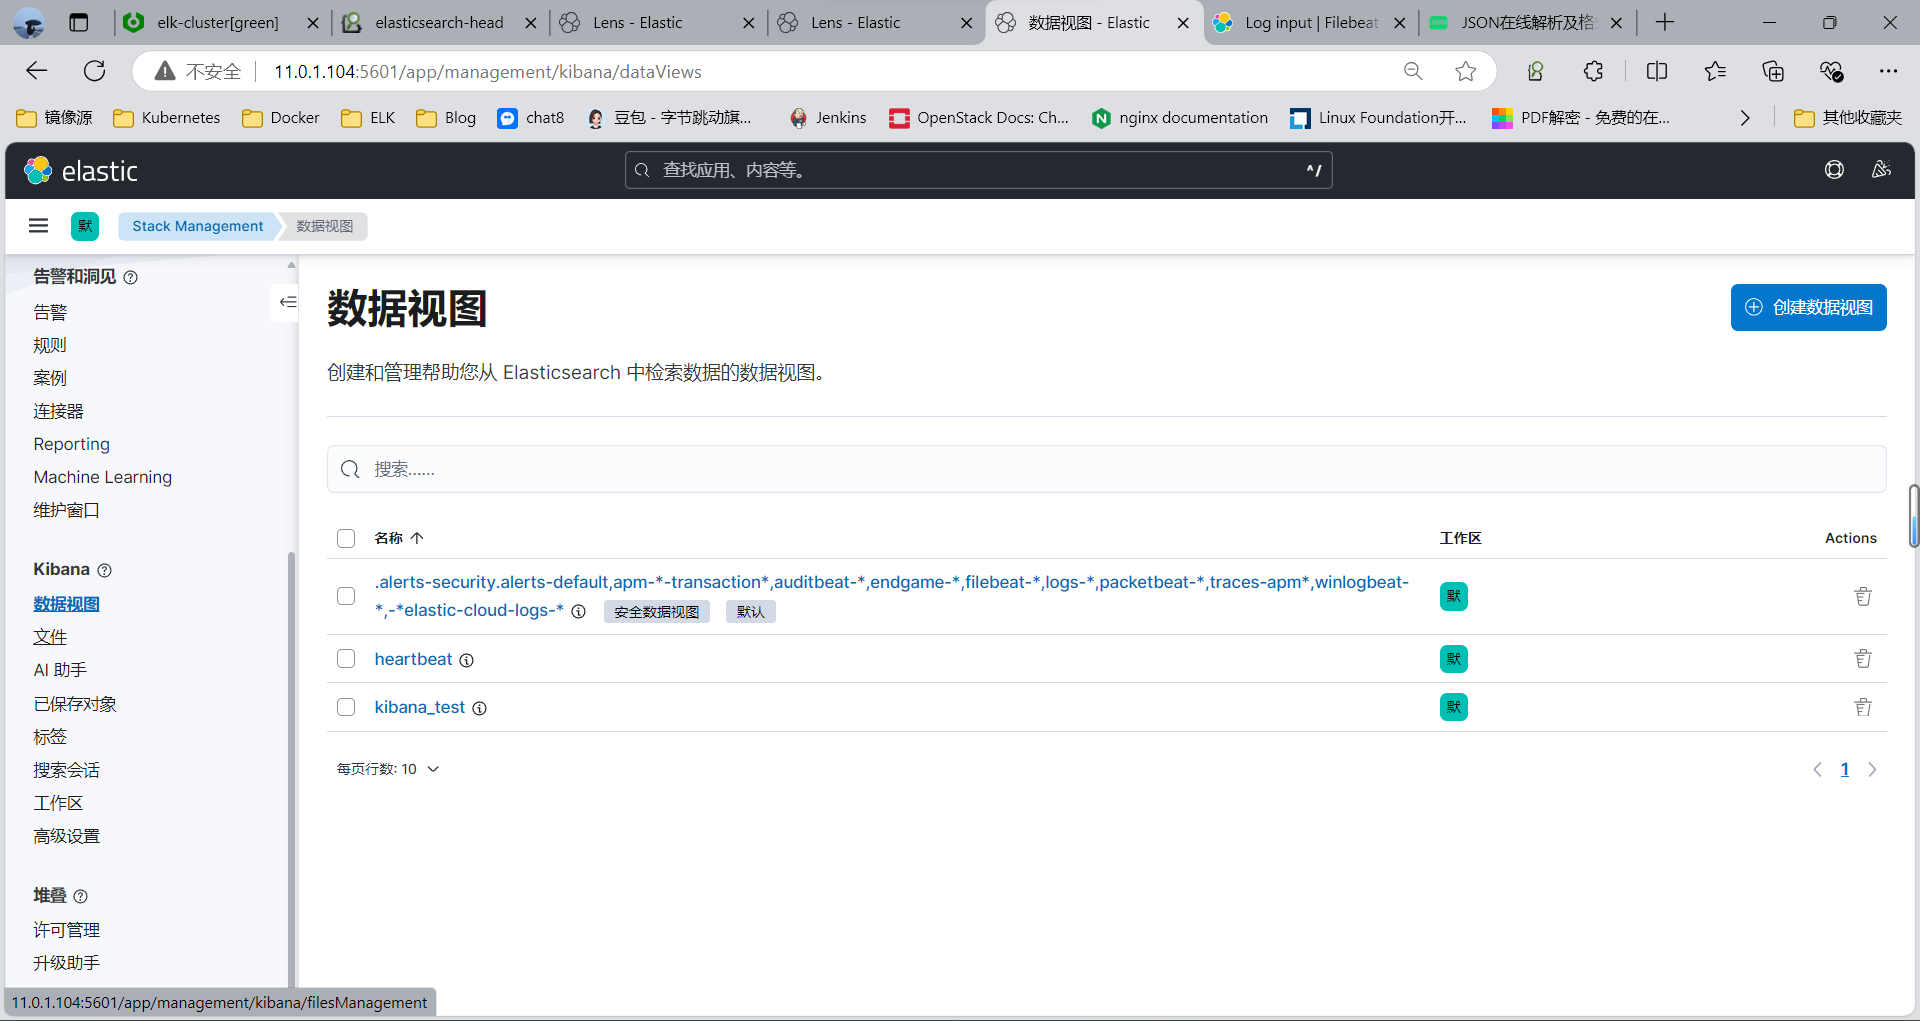
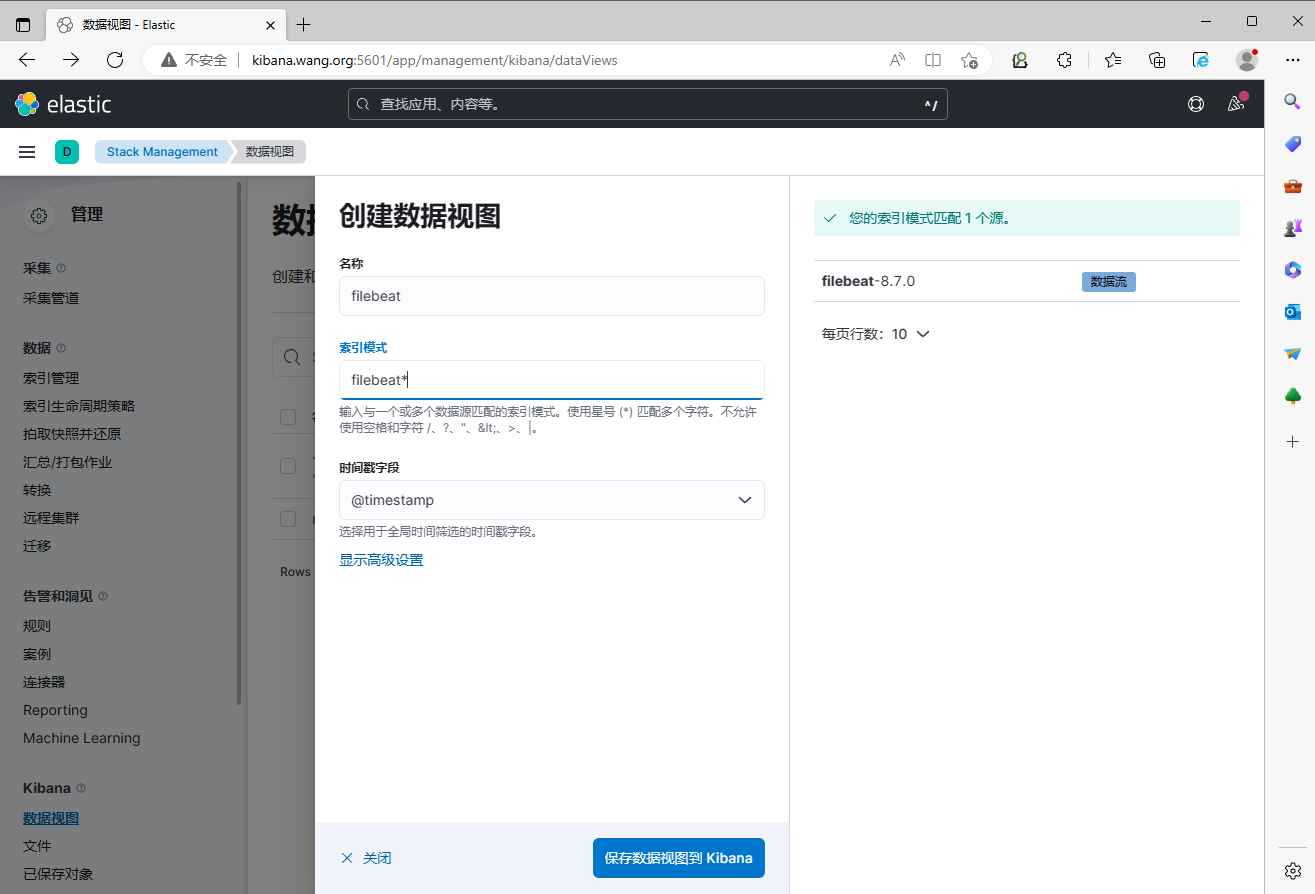
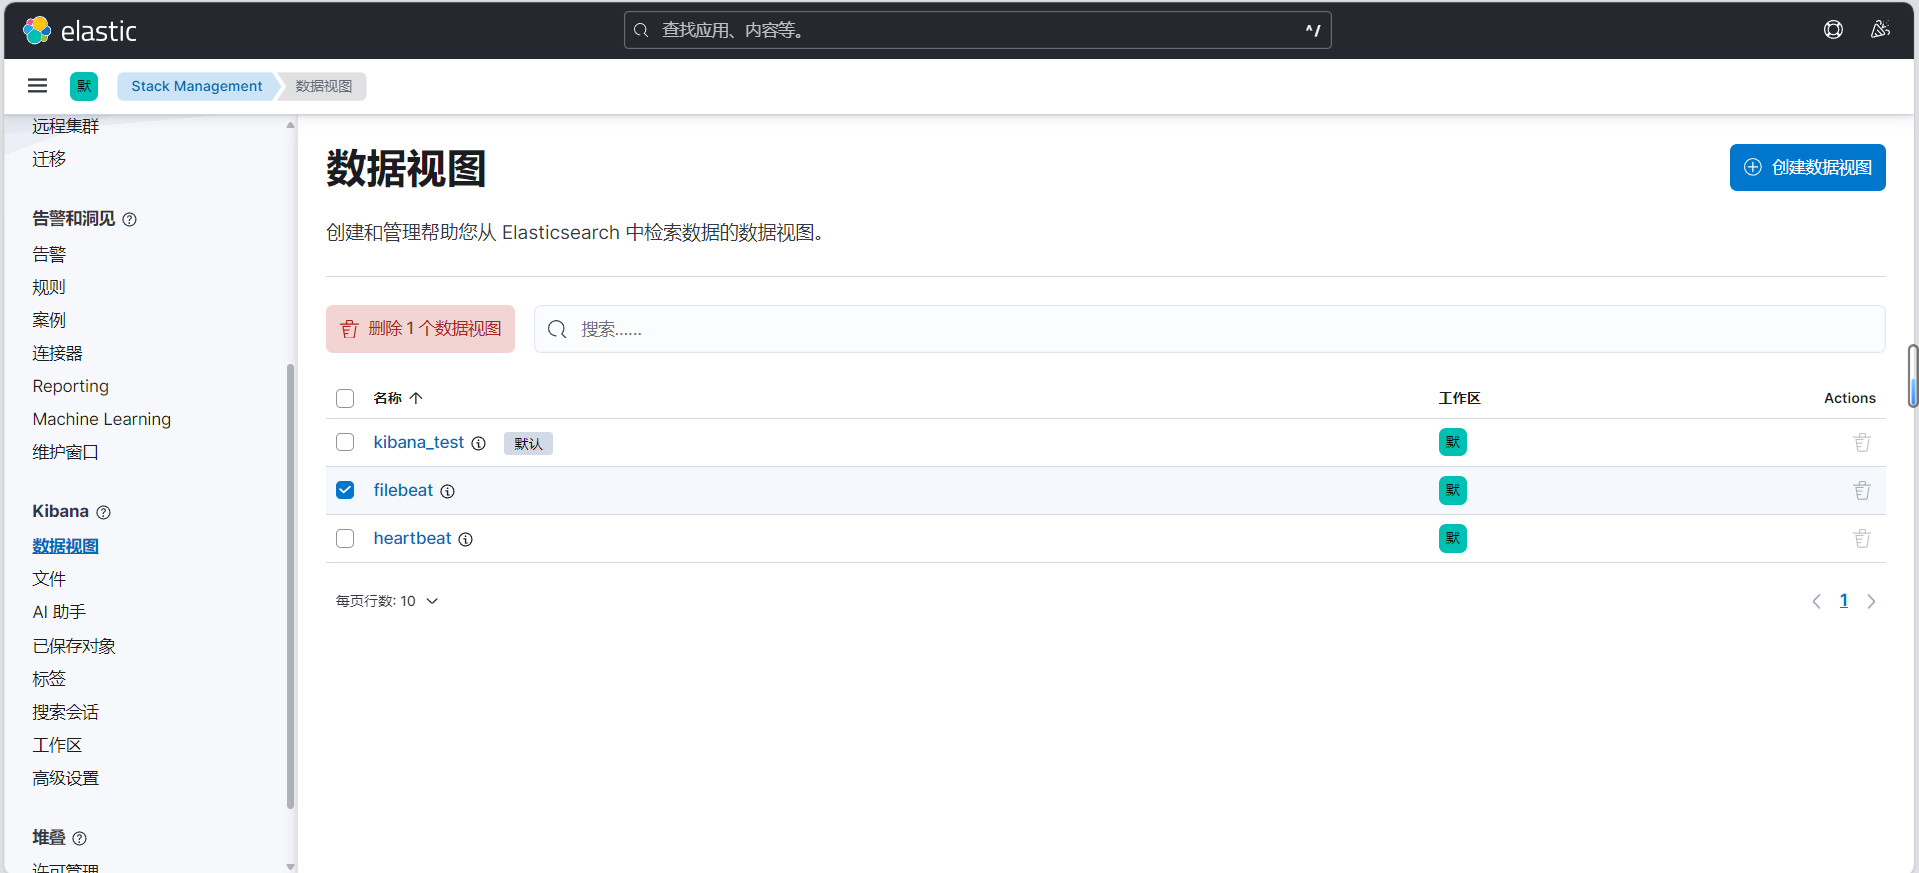
3.3.5.3 通过 Kibana 查看收集的日志信息
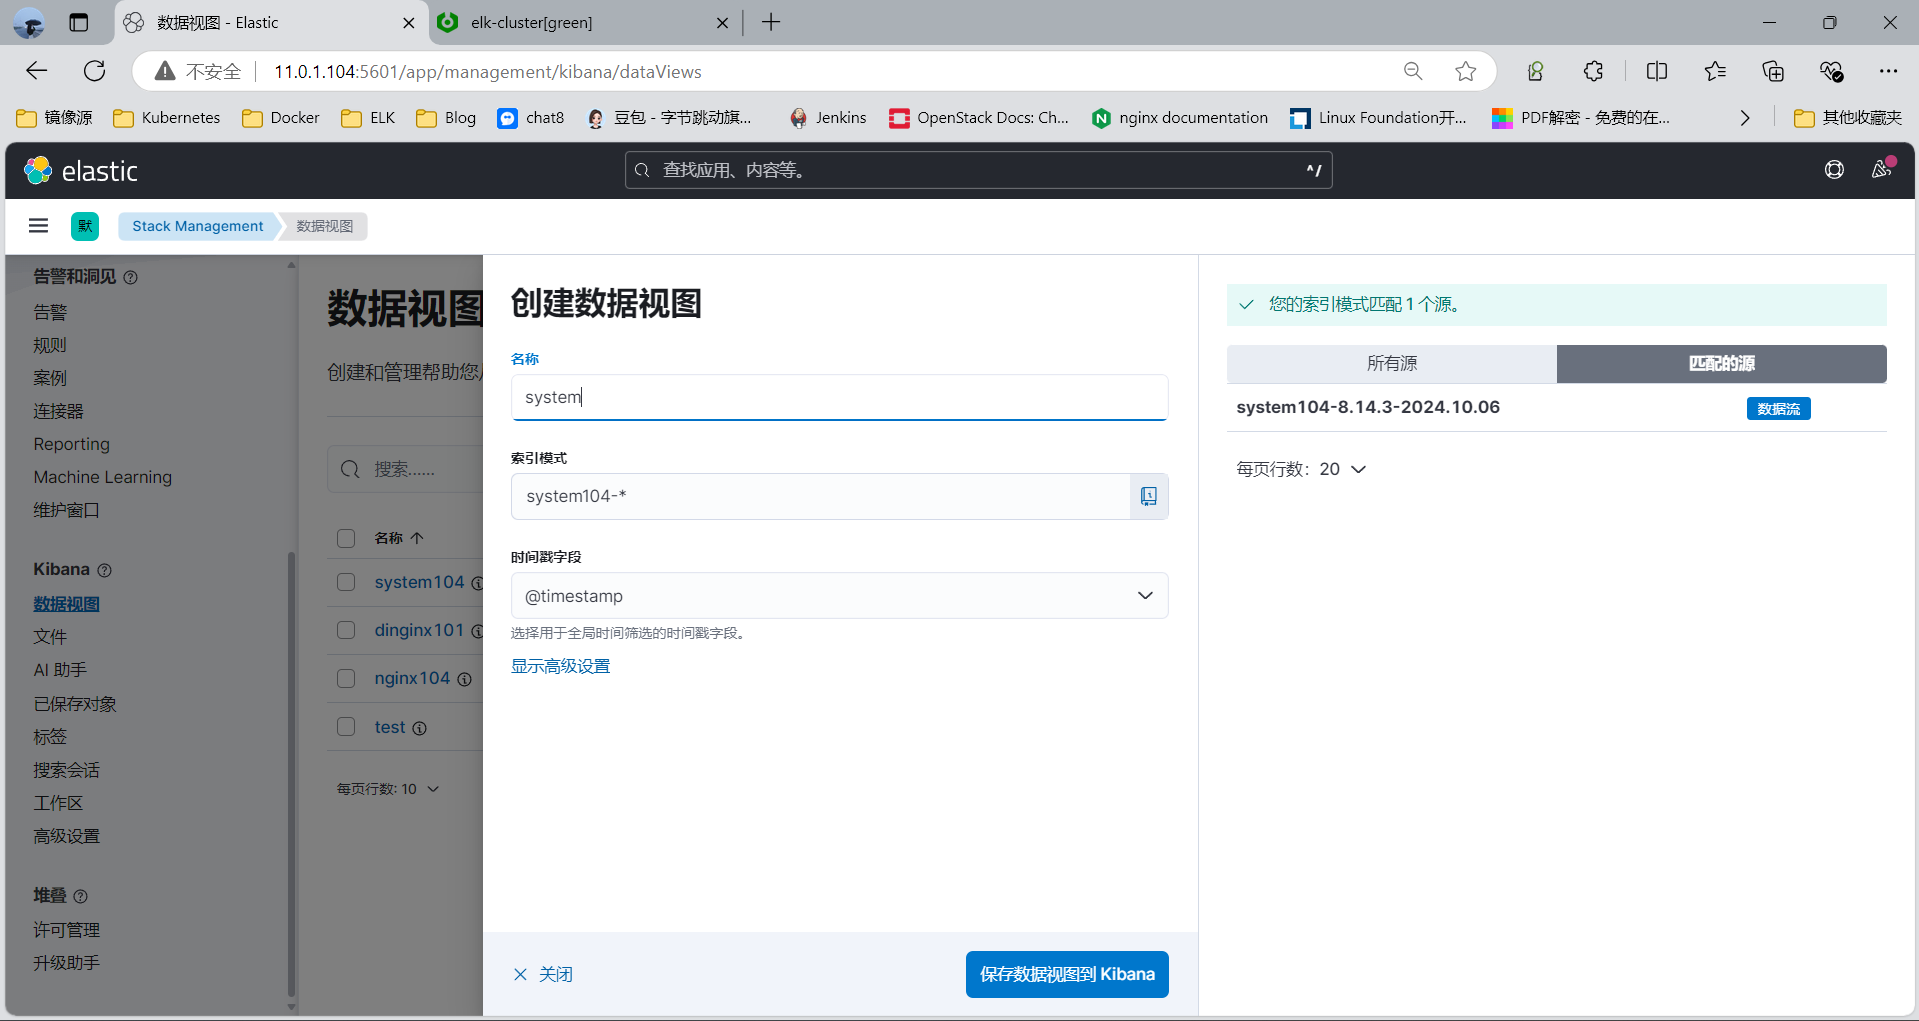
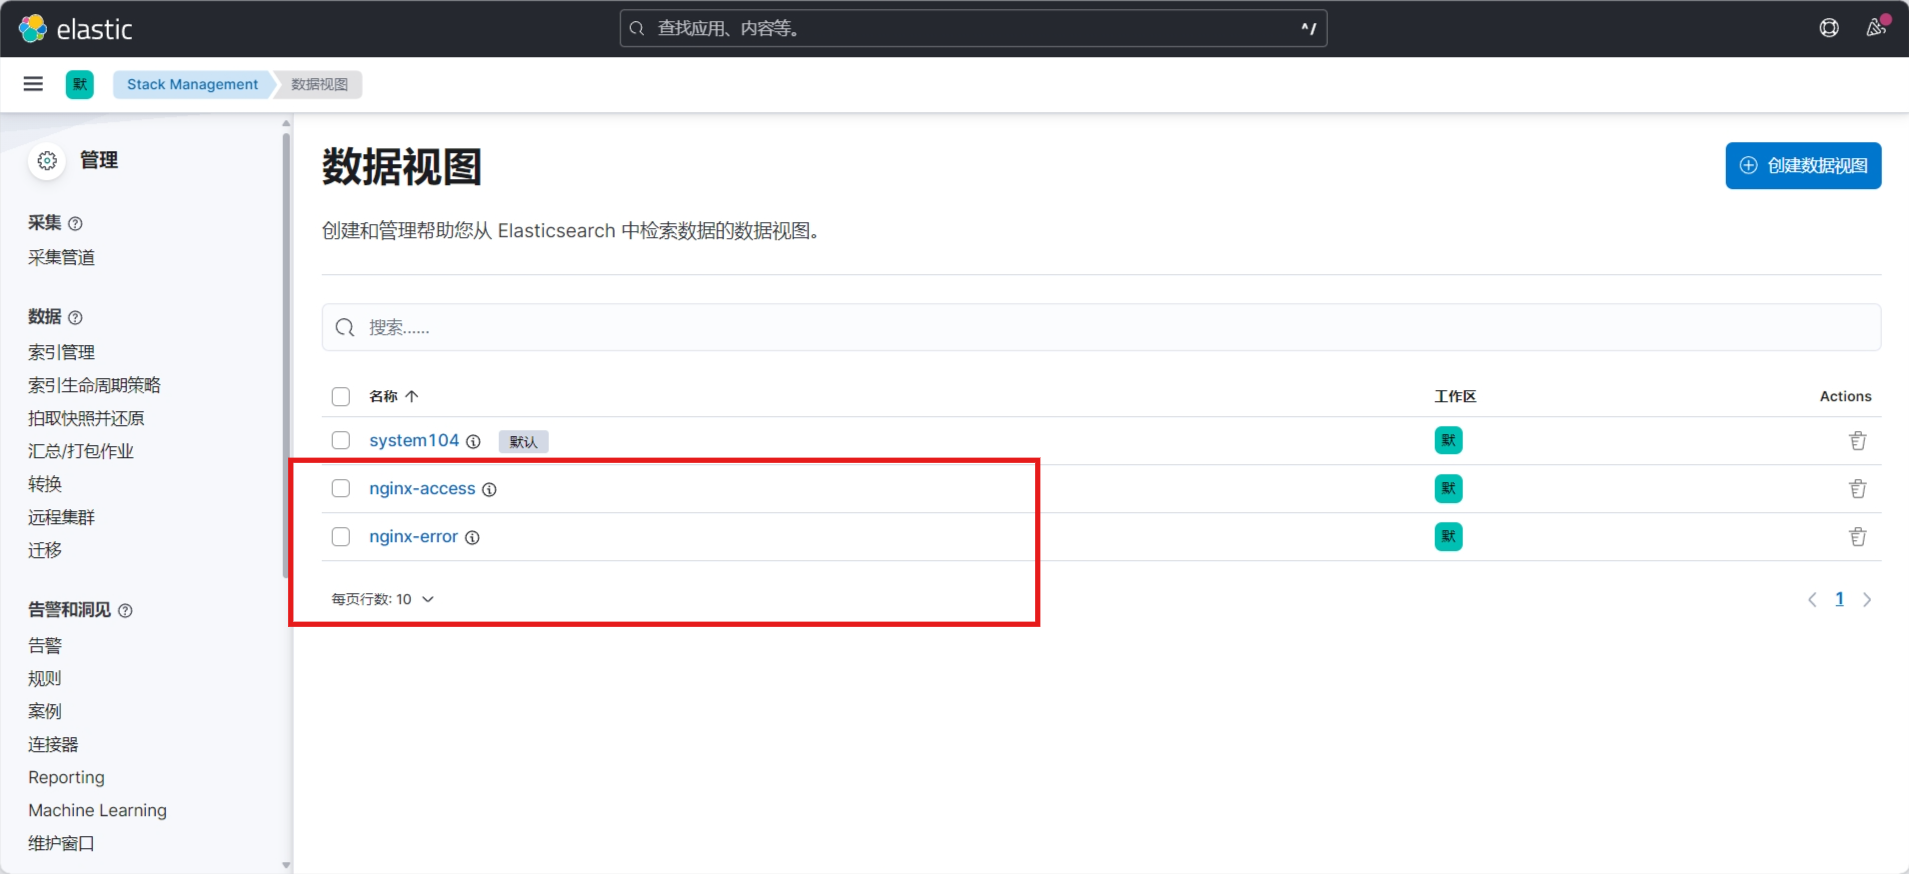
创建数据视图
新版
3.3.6 案例: 自定义索引名称收集日志到 ELasticsearch
3.3.6.1 修改配置
范例:自定义索引名称收集所有系统日志到 ELasticsearch
[root@kibana01 /etc/filebeat]#cat system104.yml
filebeat.inputs:
- type: log  # 定义输入类型为日志文件enabled: true  # 启用此输入项paths:- /var/log/system.log  # 指定要读取的日志文件路径,这里是 /var/log/system.log 文件include_lines: ['dinginx','failed','password']  # 仅采集包含这些关键词的行:'dinginx'、'failed'、'password'output.elasticsearch:hosts: ["11.0.1.101:9200"]  # 指定 Elasticsearch 集群的地址(此处指向单节点,IP 为 11.0.1.101,端口 9200)index: "system104-%{[agent.version]}-%{+yyyy.MM.dd}"  # 定义索引名称模板,格式为 "system104-Filebeat版本号-日期"setup.ilm.enabled: false  # 禁用 Elasticsearch 的 ILM(Index Lifecycle Management)功能
setup.template.name: "system104"  # 定义自定义模板的名称为 "system104"
setup.template.pattern: "system104-*"  # 指定模板匹配的索引模式,适用于所有以 "system104-" 开头的索引setup.template.settings:  # 定义 Elasticsearch 模板的配置选项index.number_of_shards: 3  # 设置每个索引的主分片数量为 3index.number_of_replicas: 1  # 设置每个分片的副本数量为 1
systemctl restart filebeat.service
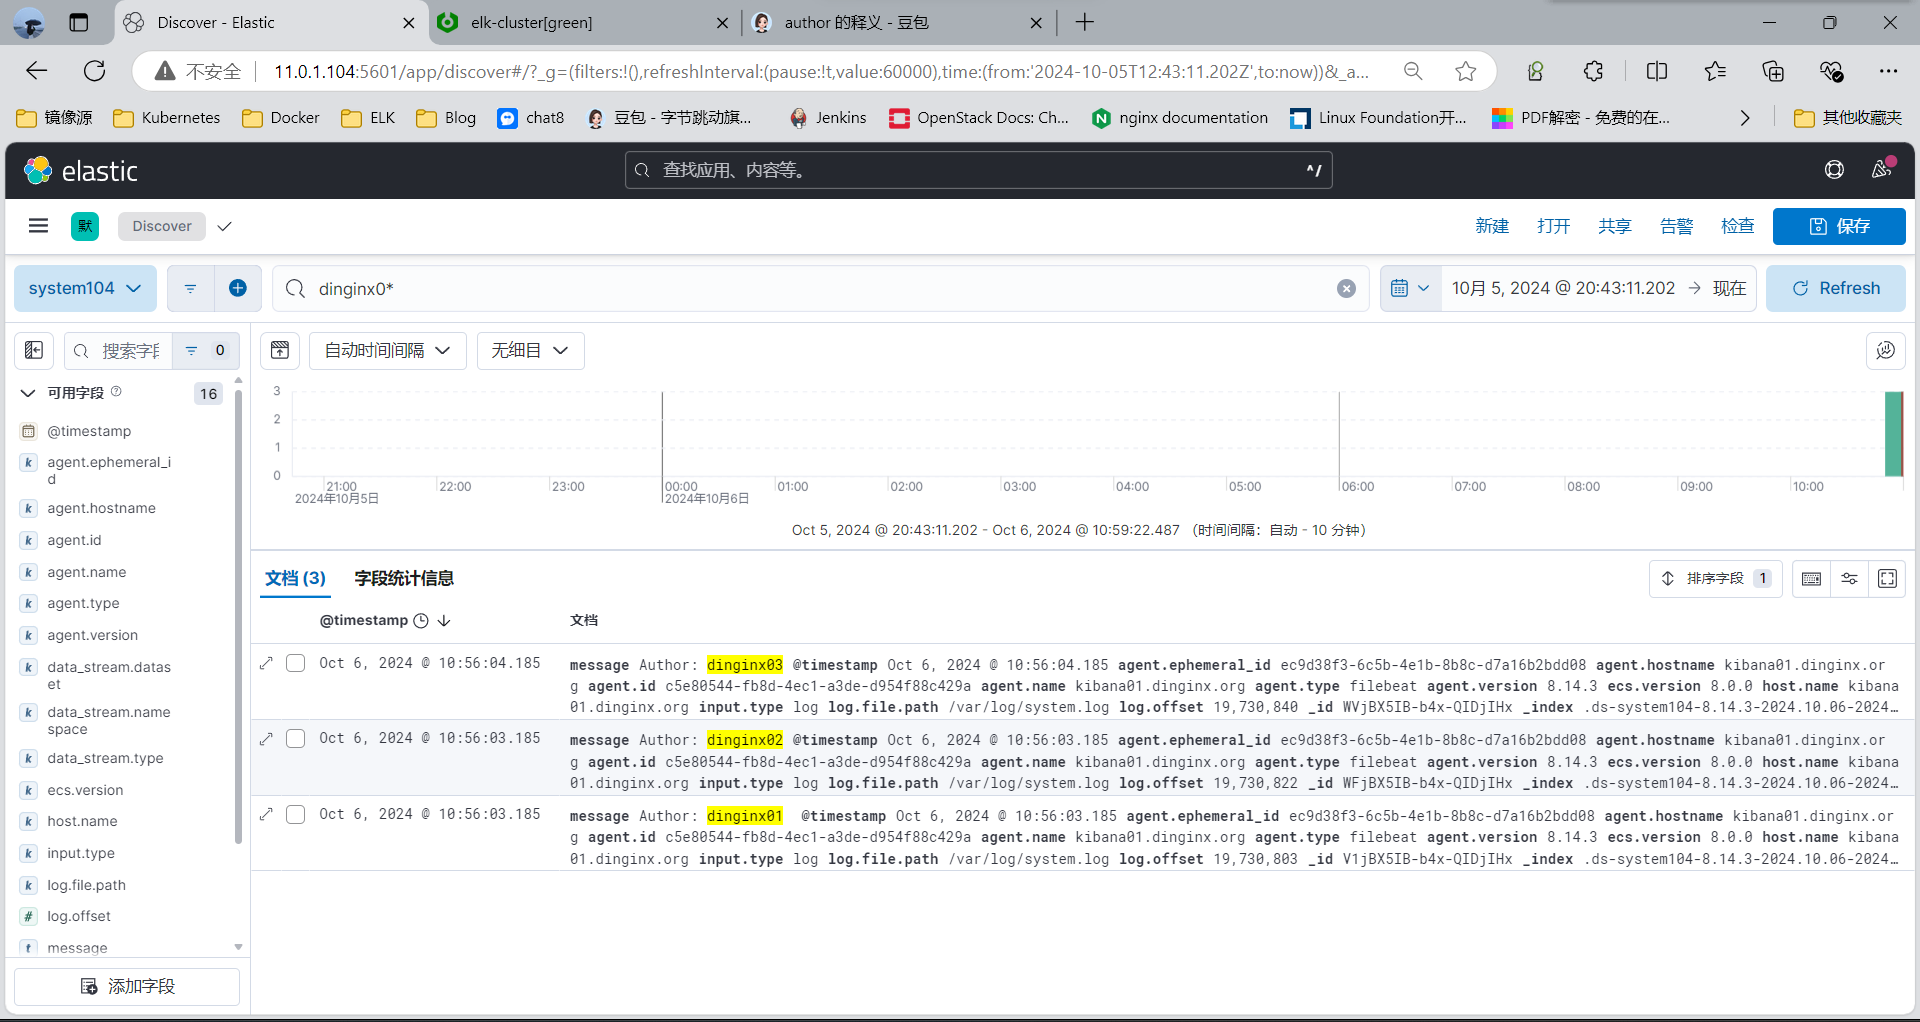
测试数据
[root@kibana01 ~]#echo "Author: dinginx01 " | tee -a /var/log/system.log
Author: dinginx01
[root@kibana01 ~]#echo "Author: dinginx02" | tee -a /var/log/system.log
Author: dinginx02
[root@kibana01 ~]#echo "Author: dinginx03" | tee -a /var/log/system.log
Author: dinginx03
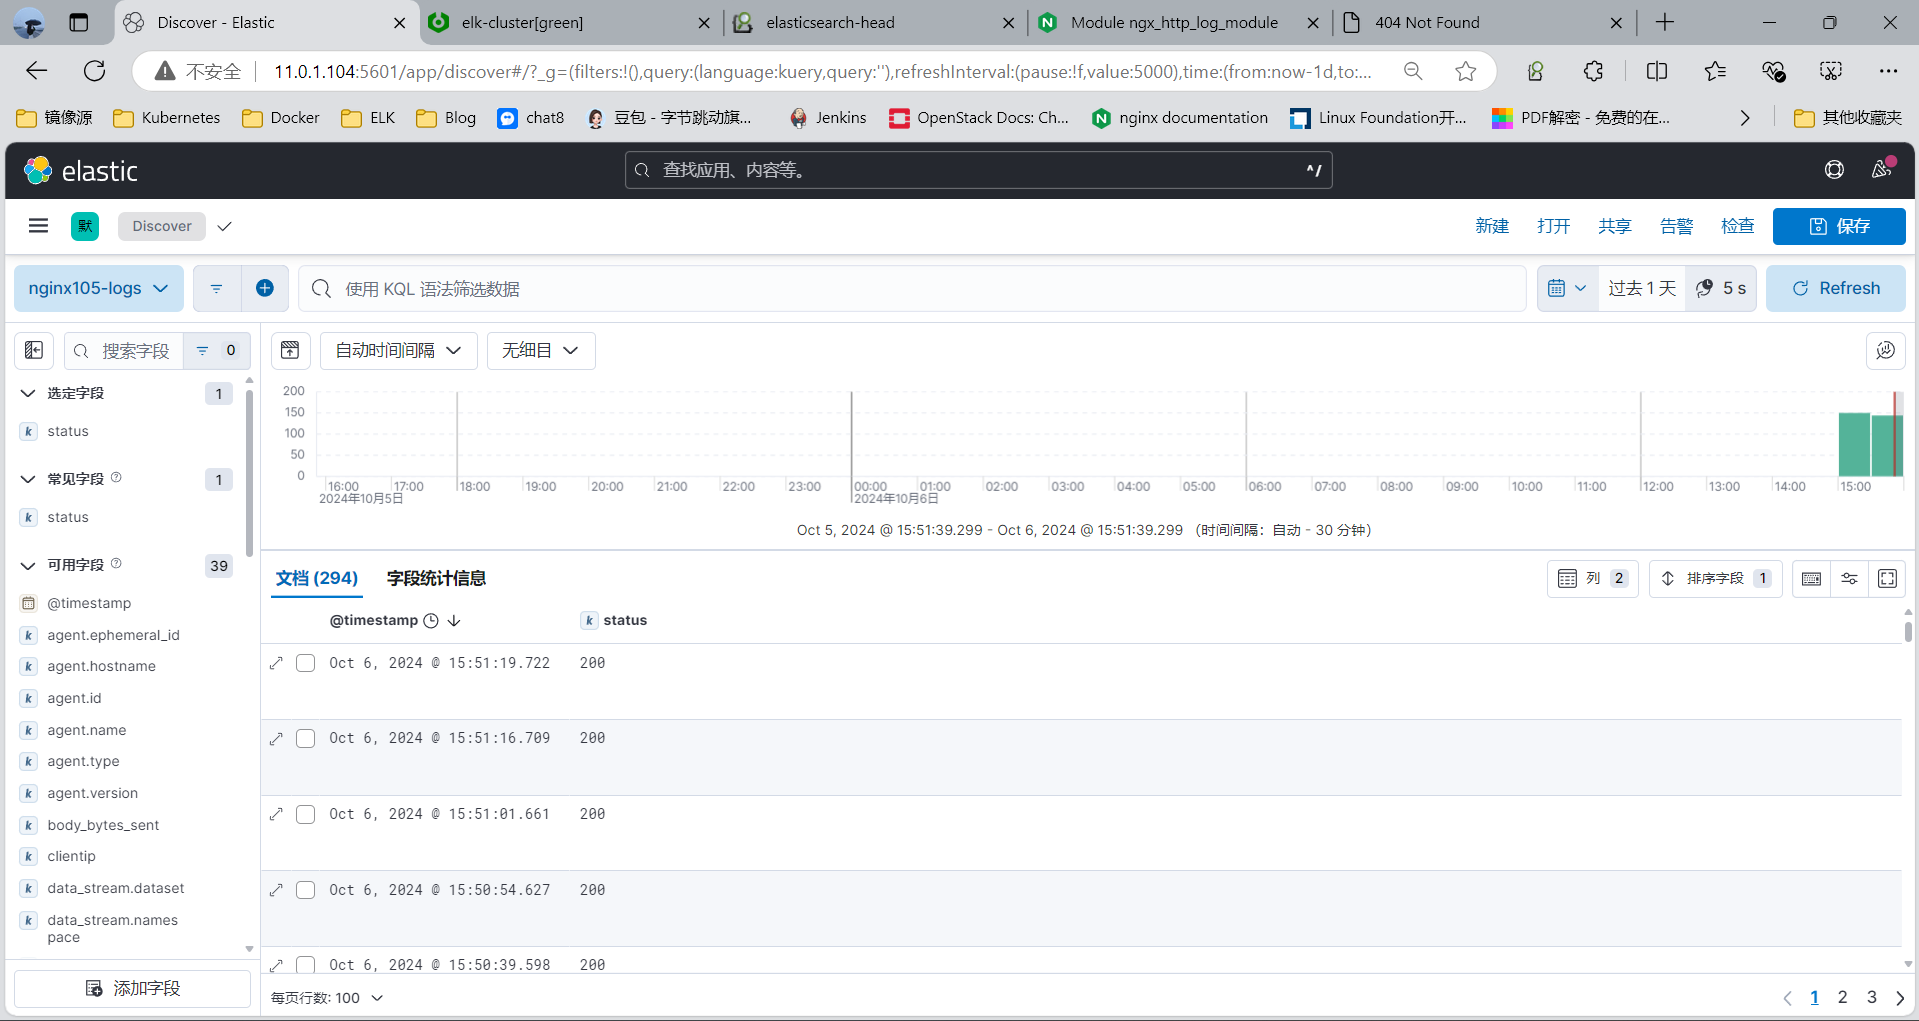
3.3.6.3 通过kibana查看收集的日志信息
3.3.6.4 修改es集群索引分片副本数
默认情况下 Filebeat 写入到 ES 的索引分片为1,副本数为1,如果需要修改分片和副本数,可以通过如下实现
#方法1,修改filebeat.yml配置文件,此方式只适合直接连接ES时才有效,适用度不高
#注意:如果模板已经存在,需要先删除模板和索引才能生效,利用kibana或者cerebro(8.X不支持)插件(more--index templates--existing templates--输入搜索的模板名wang)
vim /etc/filebeat/filebeat.yml
setup.template.settings:index.number_of_shards: 3index.number_of_replicas: 1
#生效后,在cerebro插件中more--index templates--existing templates--输入搜索的模板名wang 中可以看到以下的分片和副本配置,8.X不支持#settings中number_of_shards和number_of_replication
#方法2:也可以通过修下面方式修改,8.X不支持
1.停止filebeat服务
2.在cerebro web页面修改:修改模板settings 配置,调整分片以及副本
3.删除模板关联的索引
4.启动filebeat产生新的索引
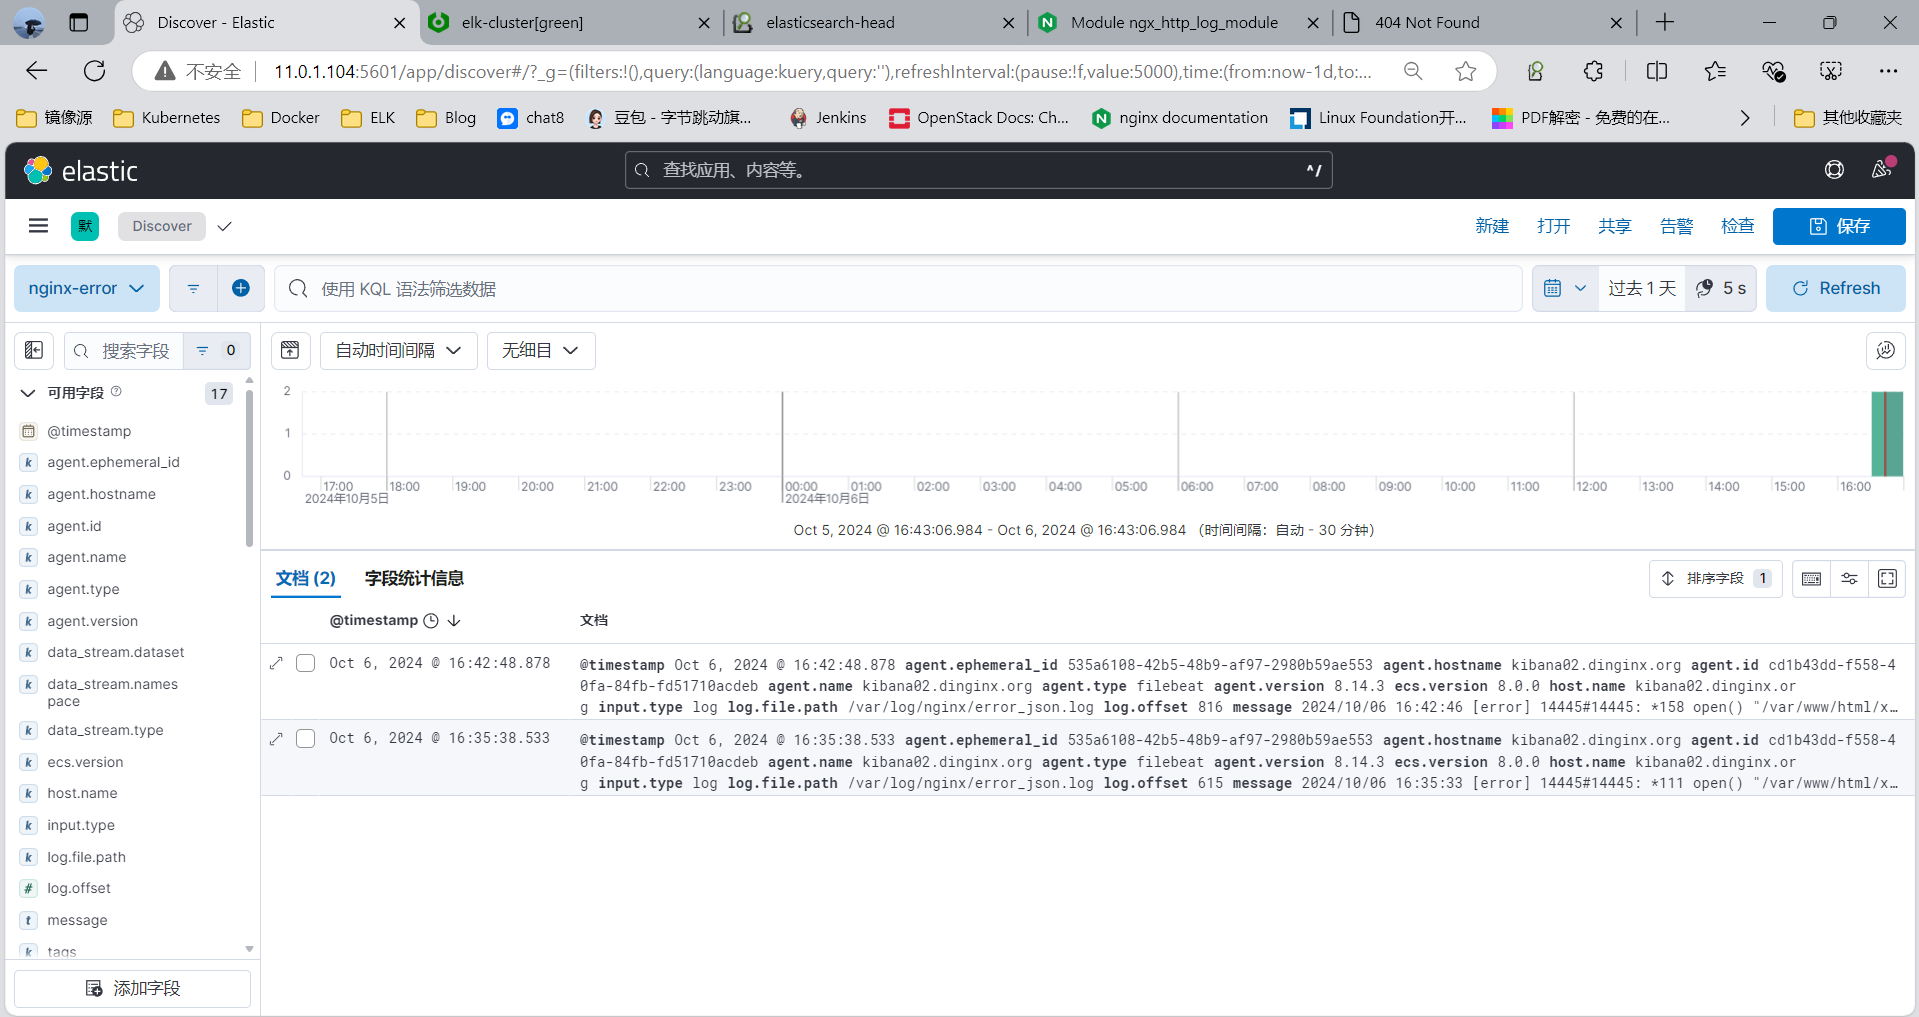
3.3.7 案例: 利用 Filebeat 收集 Nginx的 Json 格式访问日志和错误日志到 Elasticsearch 不同的索引
官方文档
https://www.elastic.co/guide/en/beats/filebeat/7.6/filebeat-input-log.html
https://www.elastic.co/guide/en/beats/filebeat/7.6/redis-output.html
生产环境中经常需要获取Web访问用户的信息,比如:网站的PV、UV、状态码、用户来自哪个地区,访问时间等
可以通过收集的Nginx的J访问日志实现
默认Nginx的每一次访问生成的访问日志是一行文本,ES没办法直接提取有效信息,不利于后续针对特定信息的分析
可以将Nginx访问日志转换为JSON格式解决这一问题
3.3.7.1 安装 nginx 配置访问日志使用 Json格式
#安装Nginx
[root@kibana02 ~]# apt update && apt -y install nginx#修改nginx访问日志为Json格式
[root@kibana02 ~]# cat /etc/nginx/nginx.conf ......http {# 定义自定义日志格式为 JSON 格式,并进行 JSON 字符转义log_format json_logs escape=json '{''"@timestamp":"$time_iso8601",'               # 记录 ISO 8601 格式的时间戳'"host":"$server_addr",'                      # 服务器地址'"clientip":"$remote_addr",'                  # 客户端 IP 地址'"size":$body_bytes_sent,'                    # 响应发送给客户端的字节数'"responsetime":$request_time,'               # 请求处理时间'"upstreamtime":"$upstream_response_time",'   # 上游服务器响应时间'"upstreamhost":"$upstream_addr",'            # 上游服务器地址'"http_host":"$host",'                        # 请求中的 Host 头部'"uri":"$uri",'                               # 请求的 URI'"domain":"$host",'                           # 请求中的域名'"xff":"$http_x_forwarded_for",'              # 客户端的 X-Forwarded-For 头,表示客户端的原始 IP'"referer":"$http_referer",'                  # 请求的 Referer 头'"tcp_xff":"$proxy_protocol_addr",'           # 通过 TCP 代理协议传递的原始客户端 IP 地址'"http_user_agent":"$http_user_agent",'       # 用户代理(客户端的浏览器或其他信息)'"status":"$status"}';                        # HTTP 响应状态码# 使用自定义的 JSON 格式记录访问日志access_log /var/log/nginx/access_json.log json_logs;# 指定错误日志的输出位置error_log /var/log/nginx/error_json.log;
}......#注意
#默认开启nginx的错误日志,但如果是ubuntu,还需要修改下面行才能记录错误日志
[root@kibana02 ~]# vim /etc/nginx/sites-available/default location / {# First attempt to serve request as file, then# as directory, then fall back to displaying a 404.#try_files $uri $uri/ =404; 		#将此行注释[root@kibana02 ~]# systemctl restart nginx.service
[root@kibana02 ~]# ll /var/log/nginx/*_json.log
-rw-r--r-- 1 root root 122291 Oct  6 15:49 /var/log/nginx/access_json.log
-rw-r--r-- 1 root root      0 Oct  6 15:09 /var/log/nginx/error_json.log[root@kibana02 /etc/filebeat]# cat filebeat.yml
# 配置 Filebeat 收集 NGINX 日志,并将其发送至 Elasticsearchfilebeat.inputs:
- type: logenabled: true  # 启用该日志输入配置json.keys_under_root: truepaths:- /var/log/nginx/*_json.log  # 指定 NGINX 访问日志的路径output.elasticsearch:hosts: ["11.0.1.101:9200","11.0.1.102:9200","11.0.1.103:9200"]  # 目标 Elasticsearch 的 IP 地址和端口index: "nginx-access-%{[agent.version]}-%{+yyyy.MM.dd}"  # 索引模式,按日期创建新索引setup.ilm.enabled: false  # 禁用 Elasticsearch 的索引生命周期管理(ILM)setup.template.name: "nginx"  # 模板名称,用于处理 NGINX 日志的字段映射
setup.template.pattern: "nginx-*"  # 模板匹配模式,应用于所有以 "nginx-" 开头的索引setup.template.settings:  # 定义 Elasticsearch 模板的配置选项index.number_of_shards: 3  # 设置每个索引的主分片数量为 3index.number_of_replicas: 1  # 设置每个分片的副本数量为 1
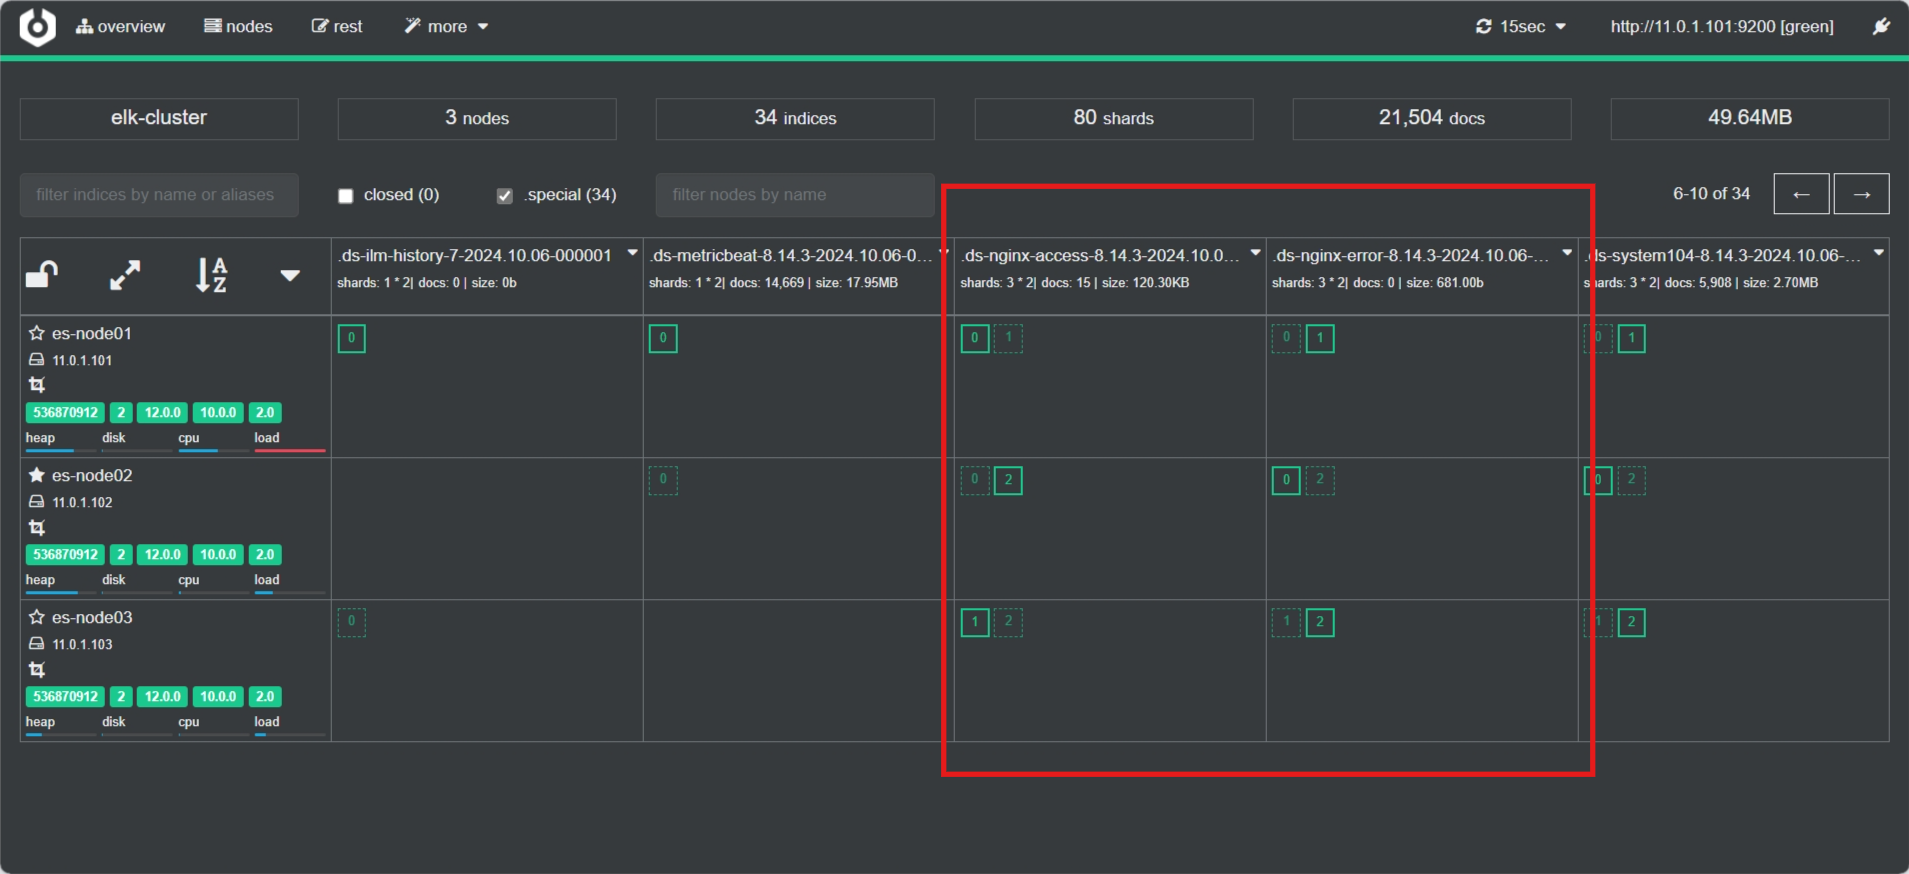
3.3.7.2 插件查看索引
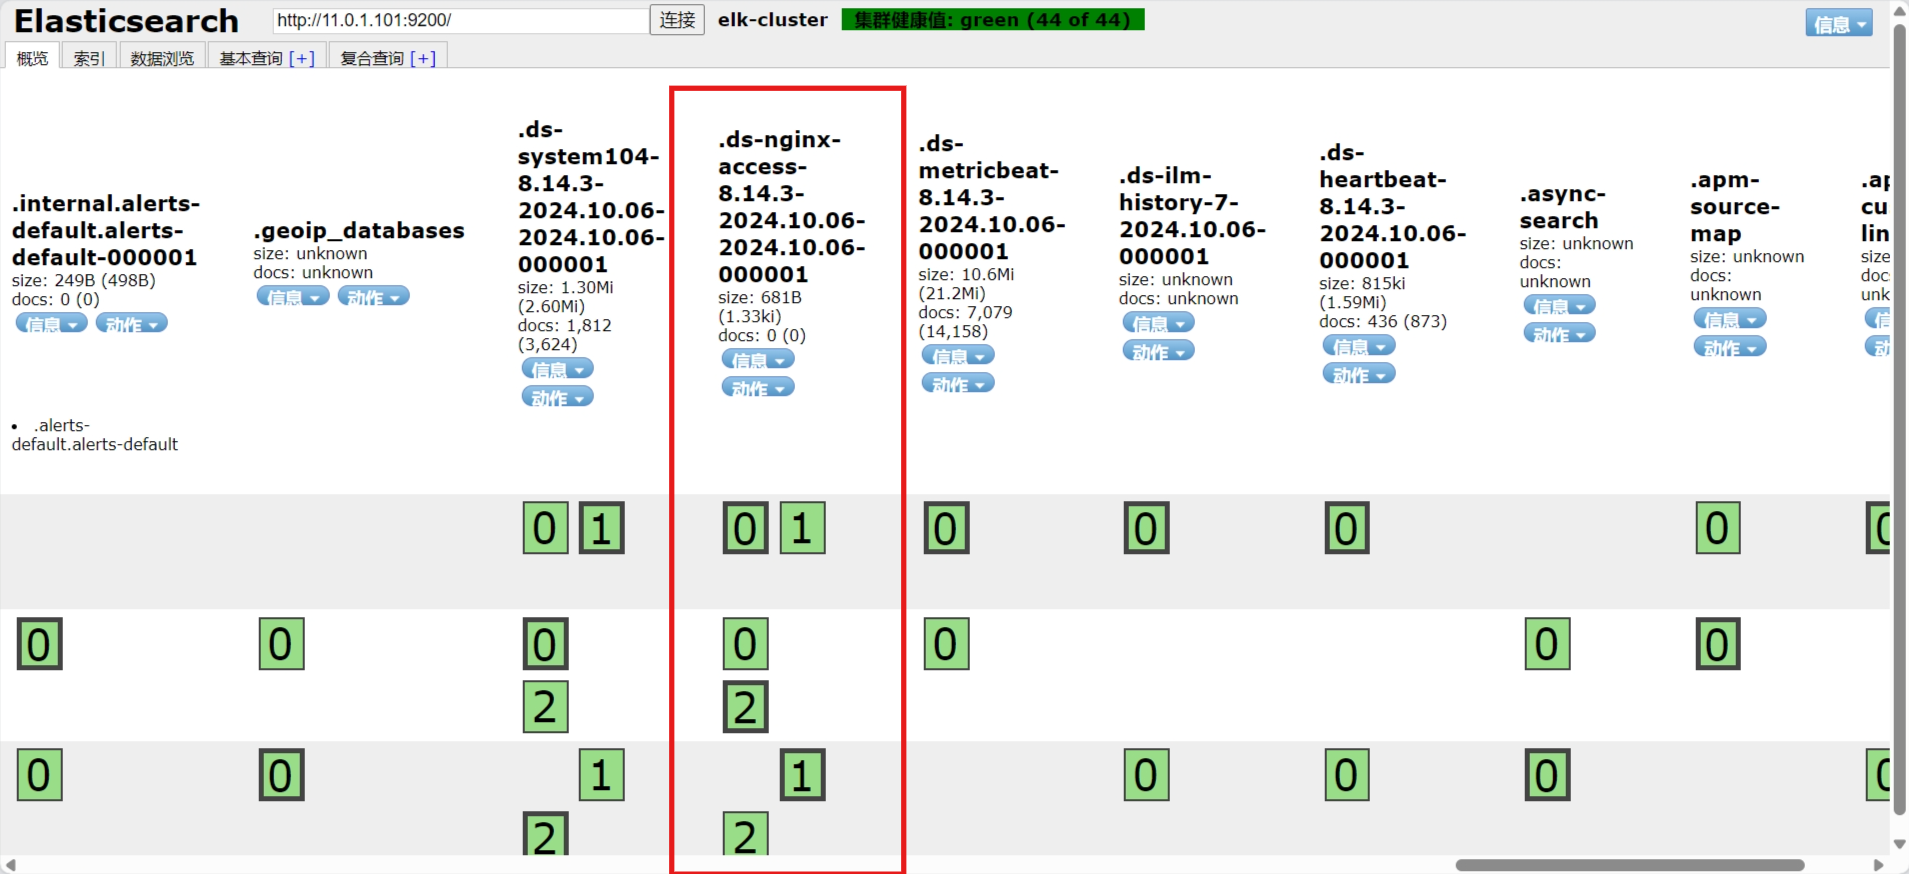
3.3.7.3 在 Kibana 验证日志数据
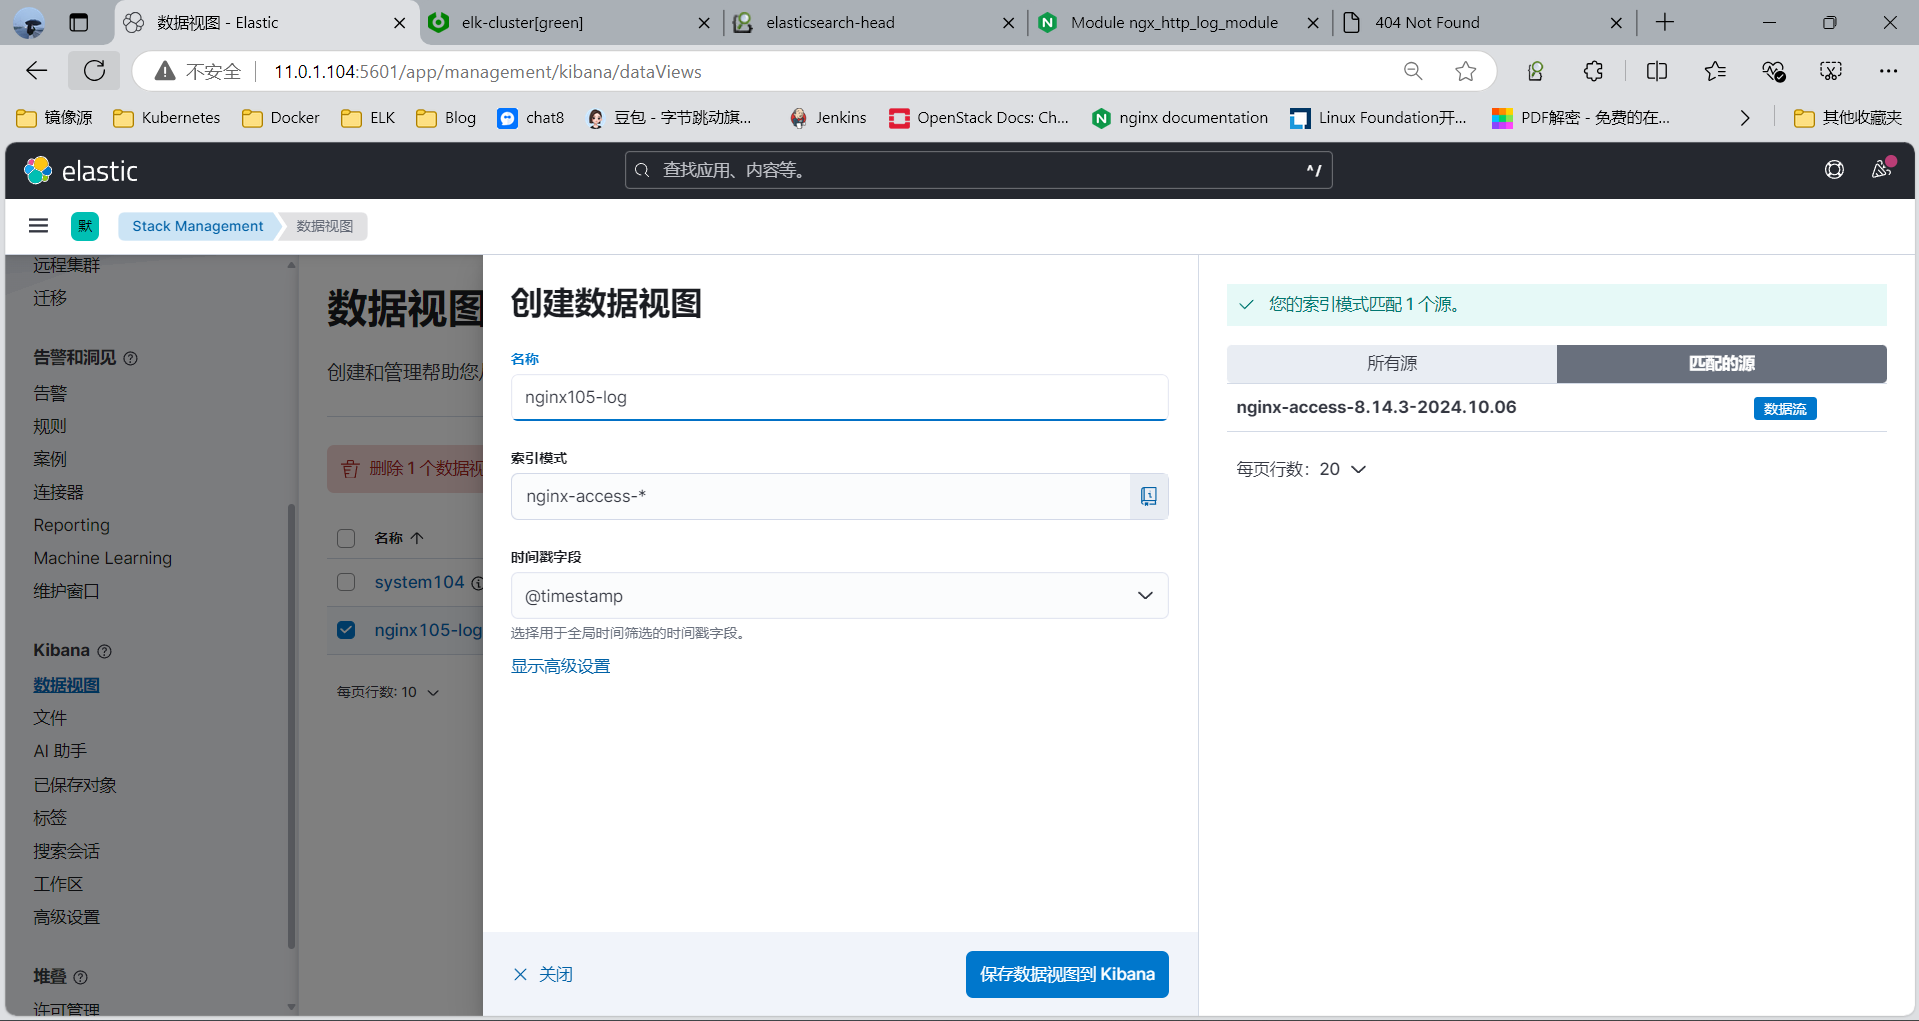
查看索引
3.3.8 范例: 利用 fields 实现索引的分类
3.3.8.1 filebeat配置文件
#方法一: 使用tags标签分类
[root@kibana02 /etc/filebeat]#vim filebeat.yml filebeat.inputs:
- type: logenabled: truepaths:- /var/log/nginx/access_json.logjson.keys_under_root: truetags: ["nginx-access"]- type: logenabled: truepaths:- /var/log/nginx/error_json.logjson.keys_under_root: truetags: ["nginx-error"]output.elasticsearch:hosts: ["11.0.1.101:9200", "11.0.1.102:9200", "11.0.1.103:9200"]indices:- index: "nginx-access-%{[agent.version]}-%{+yyyy.MM.dd}"when.contains:tags: "nginx-access"  # 匹配单个值,而非数组- index: "nginx-error-%{[agent.version]}-%{+yyyy.MM.dd}"when.contains:tags: "nginx-error"	 # 匹配单个值,而非数组setup.ilm.enabled: false  # 禁用 Elasticsearch 的索引生命周期管理(ILM)
setup.template.name: "nginx"  # 模板名称,用于处理 NGINX 日志的字段映射
setup.template.pattern: "nginx-*"  # 模板匹配模式,应用于所有以 "nginx-" 开头的索引setup.template.settings:  # 定义 Elasticsearch 模板的配置选项index.number_of_shards: 3  # 设置每个索引的主分片数量为 3index.number_of_replicas: 1  # 设置每个分片的副本数量为 1注意: 路径文件下须有内容方可生成对应索引#方法二: 使用状态码分类
[root@kibana02 /etc/filebeat]#vim filebeat.yml
filebeat.inputs:
- type: logenabled: truepaths:- /var/log/nginx/access_json.logjson.keys_under_root: trueinclude_lines: ['404']  # 仅包含 404 状态码的日志行fields:status_code: "404"- type: logenabled: truepaths:- /var/log/nginx/access_json.loginclude_lines: ['200']  # 仅包含 200 状态码的日志行fields:status_code: "200"- type: logenabled: truepaths:- /var/log/nginx/access_json.loginclude_lines: ['304']  # 仅包含 304 状态码的日志行fields:status_code: "304"# 输出到 Elasticsearch 配置
output.elasticsearch:hosts: ["http://11.0.1.101:9200"]  # 指定 Elasticsearch 集群地址# 指定索引的动态模板,根据状态码选择索引indices:- index: "nginx-error-404-%{+yyyy.MM.dd}"  # 404 错误的日志索引when.equals:fields.status_code: "404"- index: "nginx-ok-200-%{+yyyy.MM.dd}"  # 200 成功的日志索引when.equals:fields.status_code: "200"- index: "nginx-red-304-%{+yyyy.MM.dd}"  # 304 重定向的日志索引when.equals:fields.status_code: "304"setup.ilm.enabled: false  # 禁用 Elasticsearch 的索引生命周期管理(ILM)setup.template.name: "nginx"  # 模板名称,用于处理 NGINX 日志的字段映射
setup.template.pattern: "nginx-*"  # 模板匹配模式,应用于所有以 "nginx-" 开头的索引setup.template.settings:  # 定义 Elasticsearch 模板的配置选项index.number_of_shards: 3  # 设置每个索引的主分片数量为 3index.number_of_replicas: 1  # 设置每个分片的副本数量为 1
3.3.8.2 方法一实现如下,插件查看索引
注意: 路径文件下须有内容方可生成对应索引
3.3.8.3 kibana查看数据
模拟测试
[root@kibana02 ~]#curl 127.0.0.1/xxx.html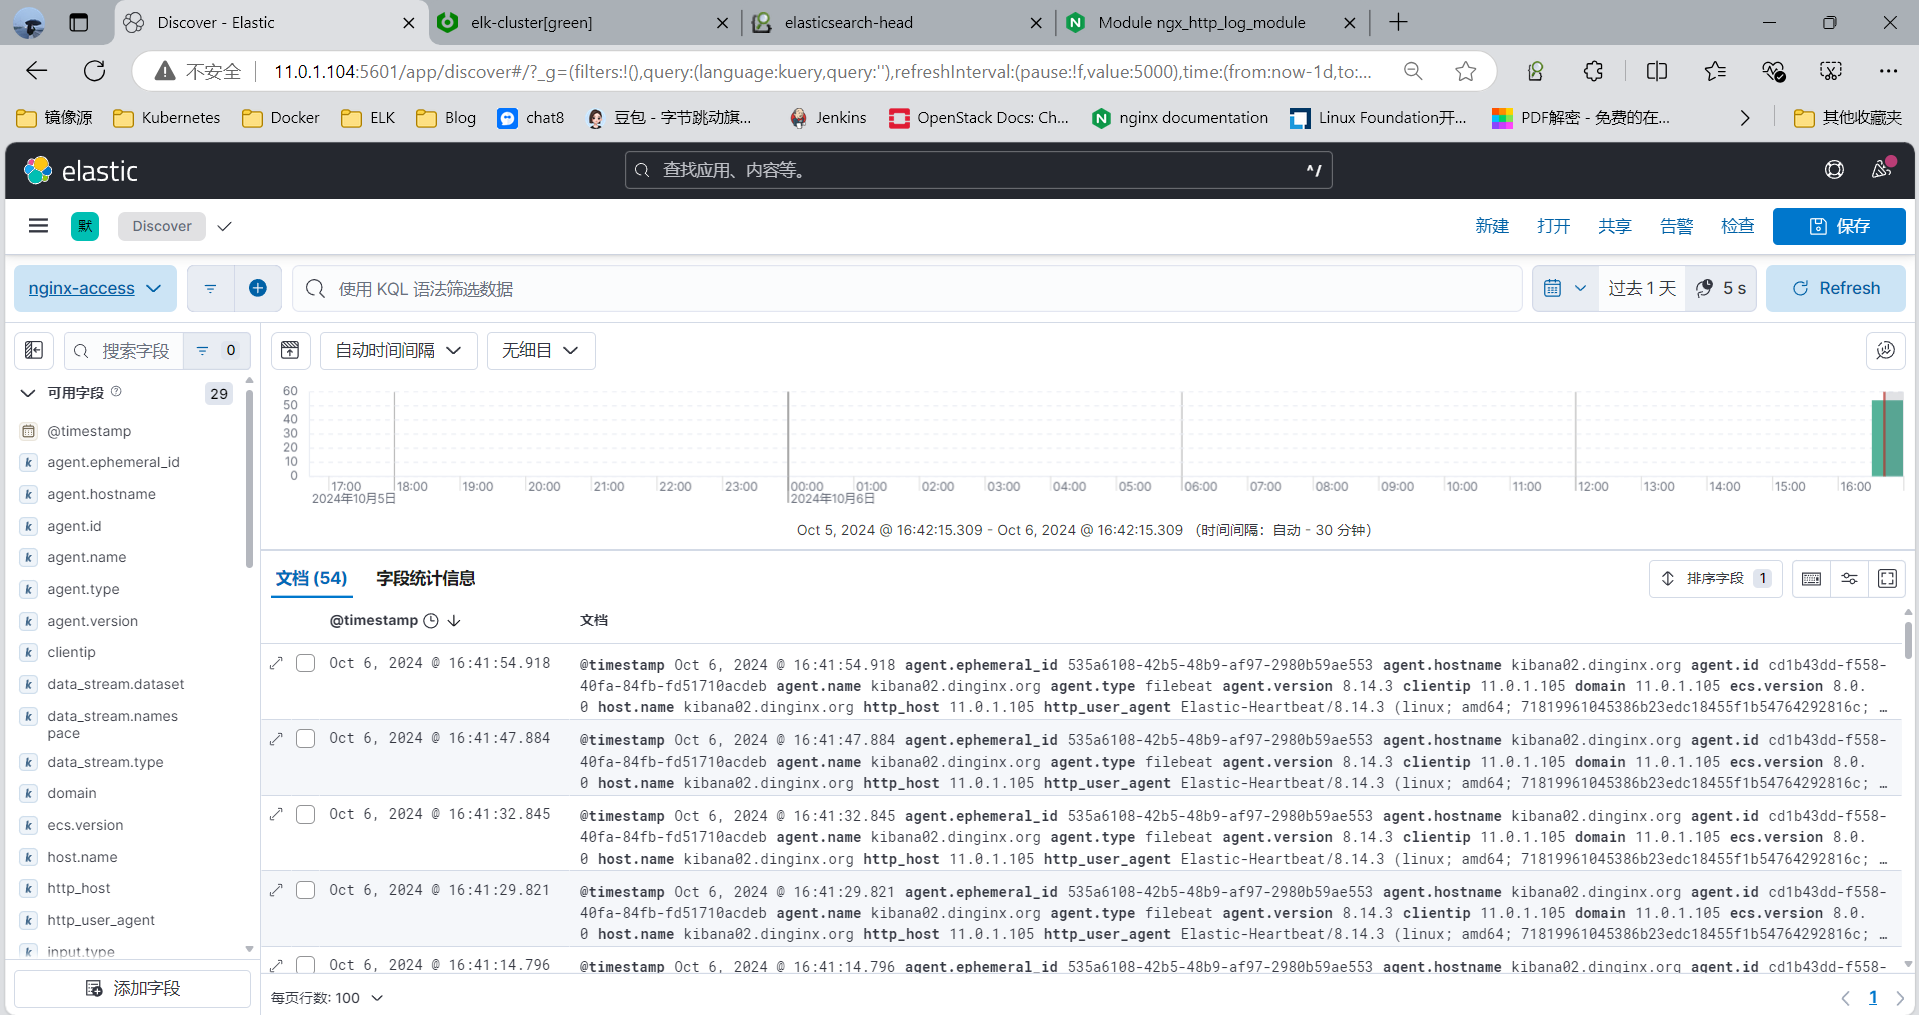
3.3.9 案例: 利用 Filebeat 收集 Tomat 的 Json 格式的访问日志和错误日志到 Elasticsearch
3.3.9.1 安装 Tomcat 并配置使用 Json 格式的访问日志
#安装Tomcat,可以包安装或者二进制安装
[root@web-server ~]#apt install -y tomcat9 tomcat9-admin#修改tomcat配置文件
[root@web-server ~]#vim /etc/tomcat9/server.xml......<!-- Access log processes all example.Documentation at: /docs/config/valve.htmlNote: The pattern used is equivalent to using pattern="common" --><Valve className="org.apache.catalina.valves.AccessLogValve" directory="logs"prefix="localhost_access_log" suffix=".txt"pattern=" {"clientip":"%h","ClientUser":"%l","authenticated":"%u","AccessTime":"%t","method":"%r","status":"%s","SendBytes":"%b","Query?string":"%q","partner":"%{Referer}i","AgentVersion":"%{User-Agent}i"}" /> #添加自定义日志格式......#日志路径
[root@web-server ~]#tail -f /var/log/tomcat9/localhost_access_log.2024-10-06.txt |jq
3.3.9.2 修改 Filebeat 配置文件
[root@web-server /etc/filebeat]#cat filebeat.yml
filebeat.inputs:
- type: logenabled: truepaths:- /var/log/tomcat9/localhost_access_log.2024-10-06.txtjson.keys_under_root: truetags: ["tomcat-access"]- type: logenabled: truepaths:- /var/log/tomcat9/localhost_access_log.2024-10-06.txtjson.keys_under_root: truetags: ["tomcat-error"]output.elasticsearch:hosts: ["11.0.1.101:9200", "11.0.1.102:9200", "11.0.1.103:9200"]indices:- index: "tomcat-access-%{[agent.version]}-%{+yyyy.MM.dd}"when.contains:tags: "tomcat-access"  # 匹配单个值,而非数组- index: "tomcat-error-%{[agent.version]}-%{+yyyy.MM.dd}"when.contains:tags: "tomcat-error"	 # 匹配单个值,而非数组setup.ilm.enabled: false  # 禁用 Elasticsearch 的索引生命周期管理(ILM)
setup.template.name: "tomcat"  # 模板名称,用于处理 NGINX 日志的字段映射
setup.template.pattern: "tomcat-*"  # 模板匹配模式,应用于所有以 "tomcat-" 开头的索引setup.template.settings:  # 定义 Elasticsearch 模板的配置选项index.number_of_shards: 3  # 设置每个索引的主分片数量为 3index.number_of_replicas: 1  # 设置每个分片的副本数量为 1#启动服务
systemctl restart filebeat
3.3.9.3 插件查看索引
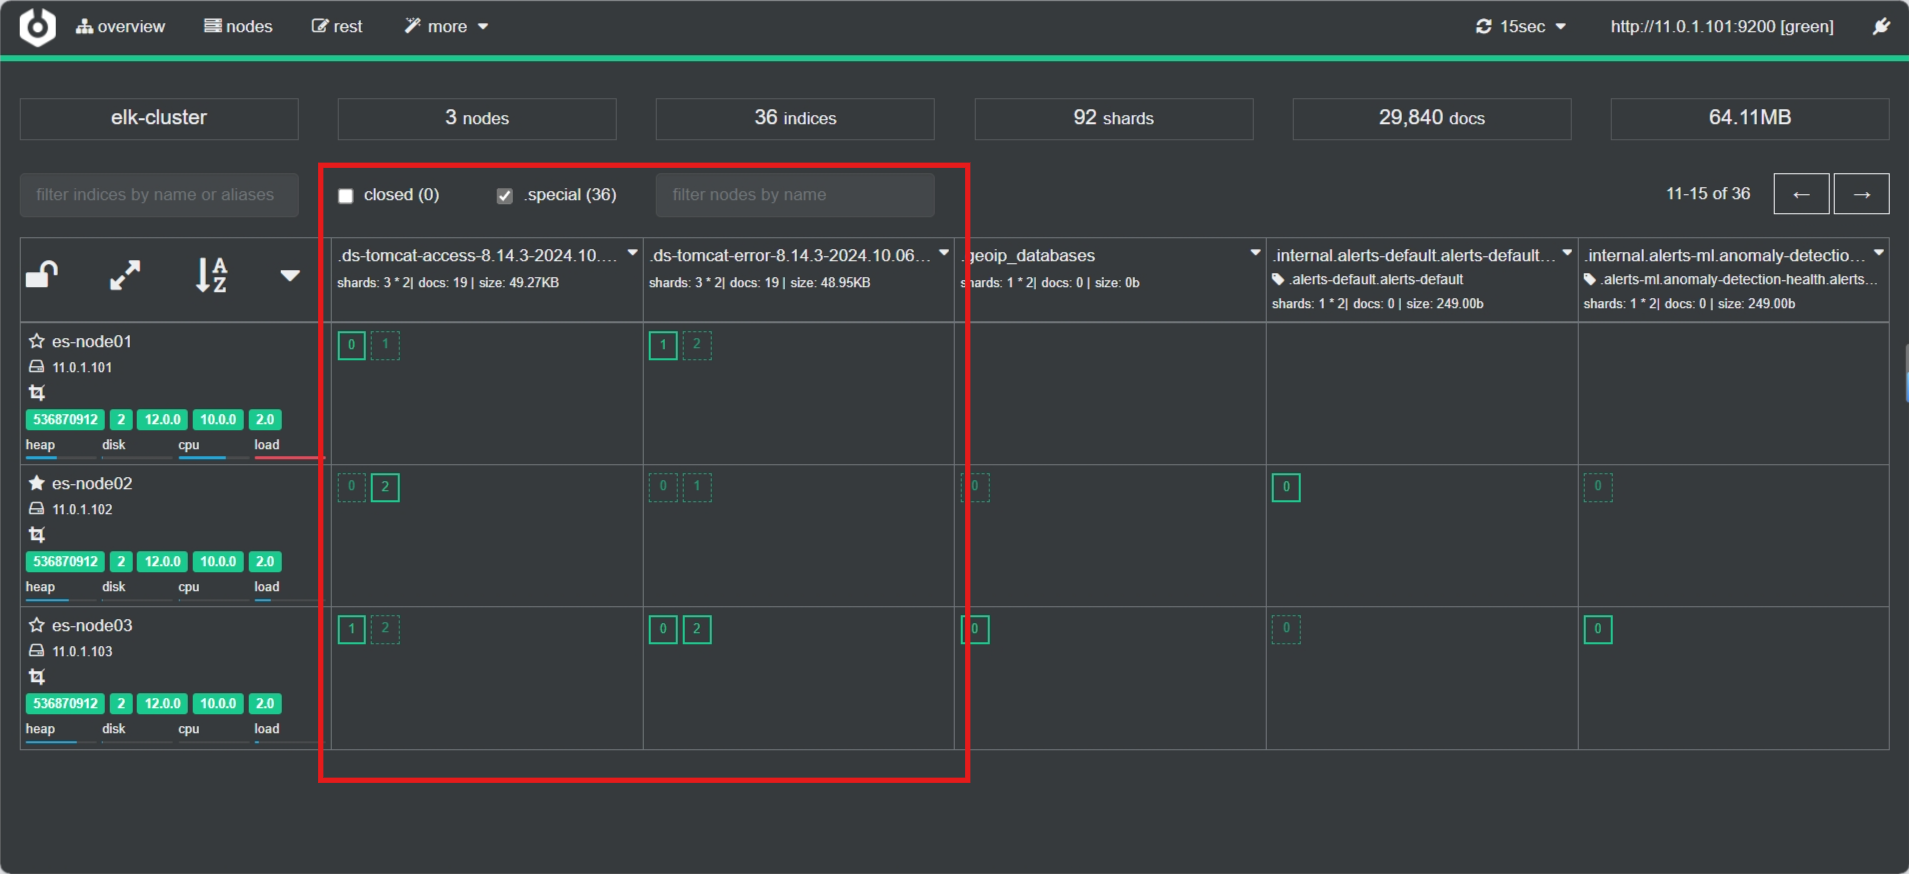
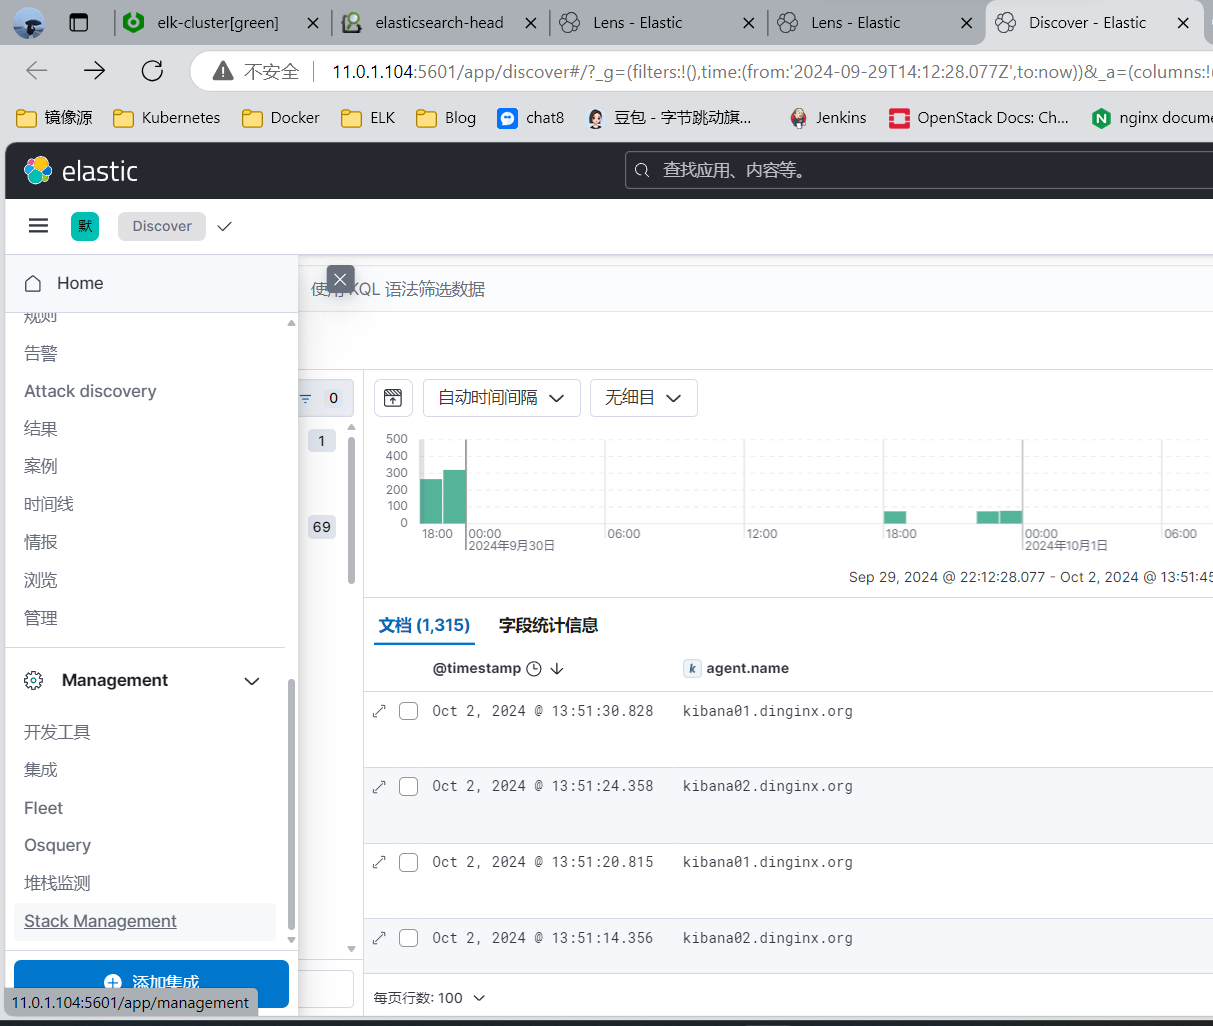
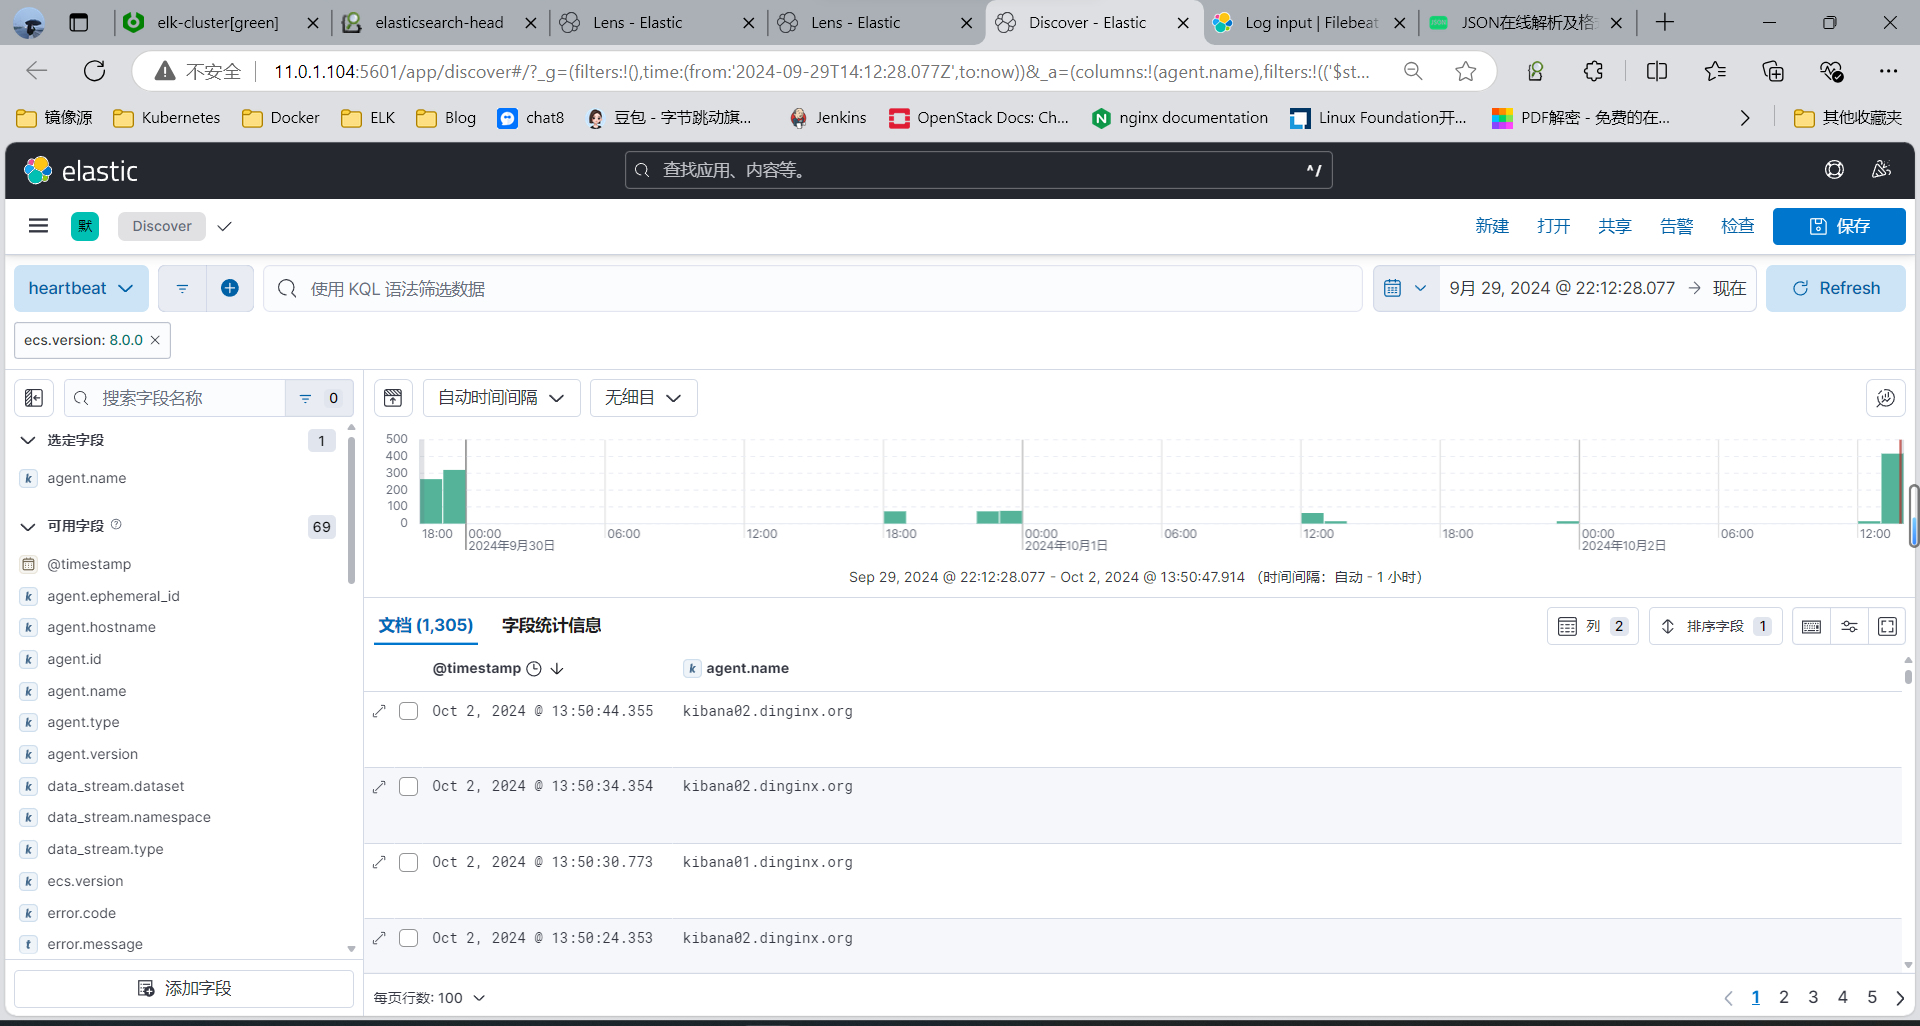
3.3.9.4 通过 Kibana 查看收集的日志信息
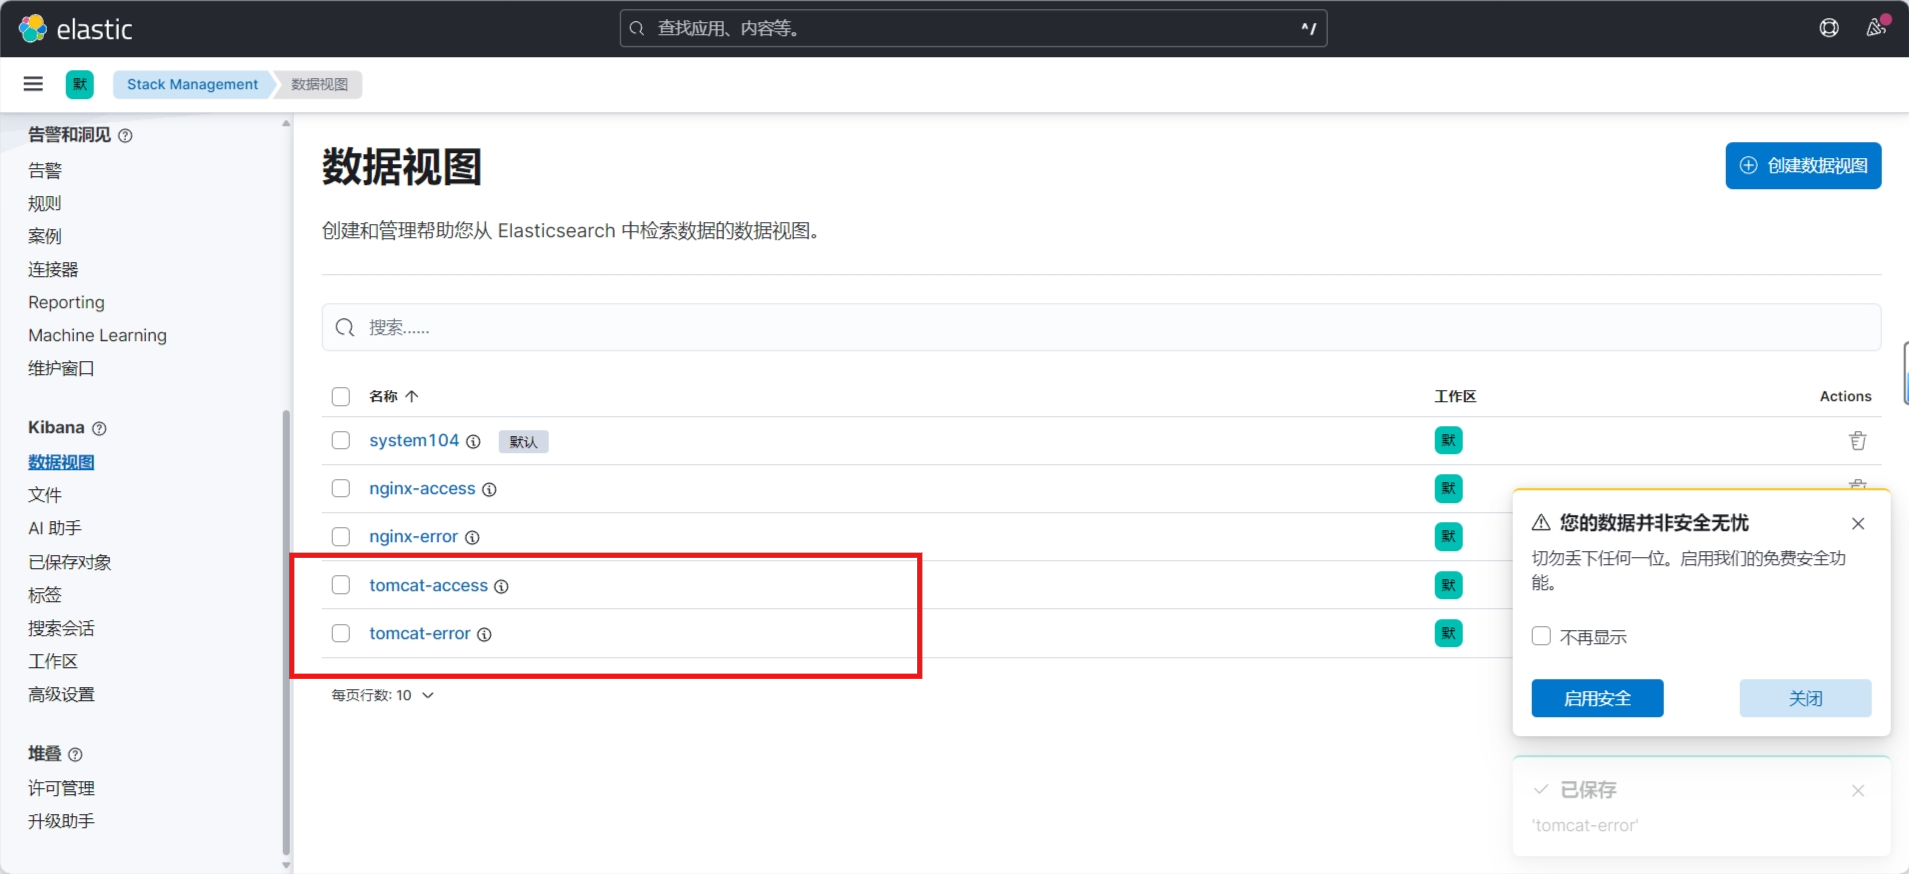
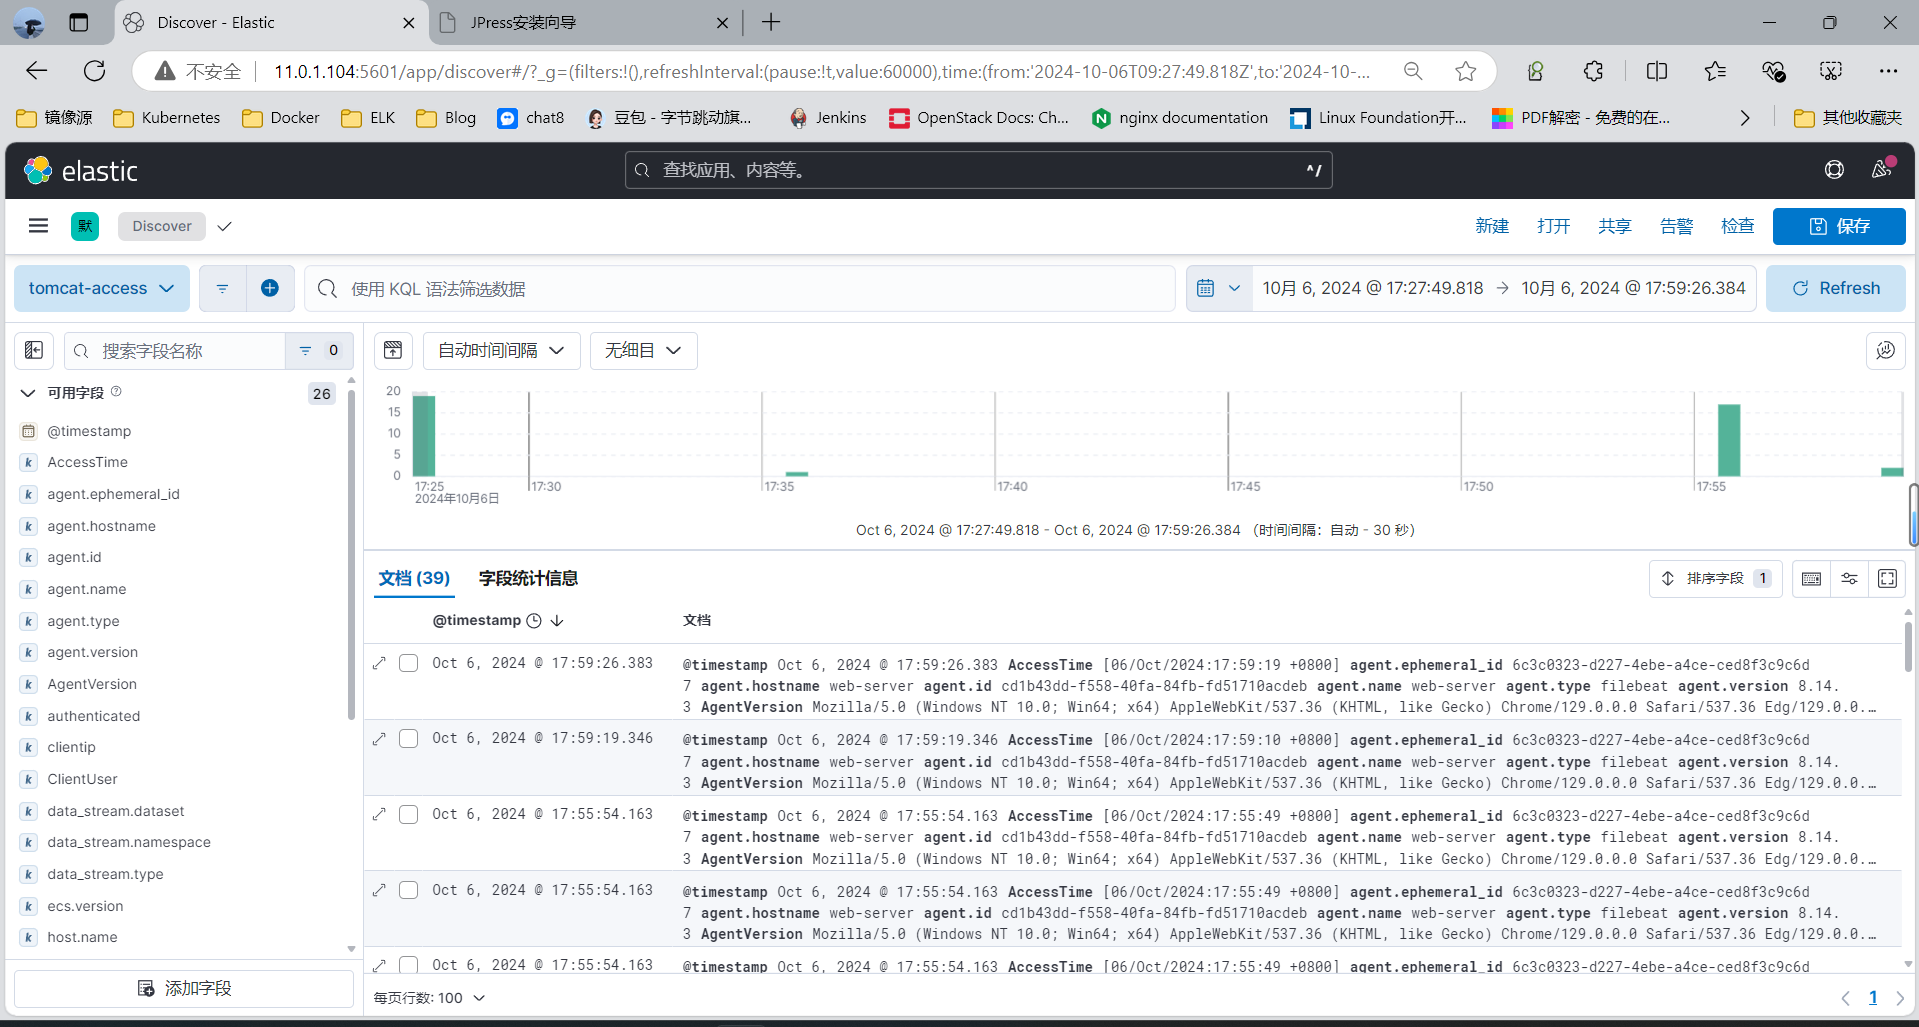
选中agent.name字段
只显示指定字段,所以可以将多个tomcat主机的日志合并成一个索引,利用,再利用此字段区别不同的主机
3.3.10 案例: 利用 Filebeat 收集 Tomat 的多行错误日志到Elasticsearch
3.3.10.1 Tomcat 错误日志解析
Tomcat 是 Java 应用,当只出现一个错误时,会显示很多行的错误日志,如下所示
[root@web-server ~]#cat /var/log/tomcat9/catalina.2024-10-06.log ......06-Oct-2024 19:10:46.060 SEVERE [main] org.apache.catalina.startup.ContextConfig.beforeStart Exception fixing docBase for context [/jpress]java.io.IOException: Unable to create the directory [/data/website/jpress]at org.apache.catalina.startup.ExpandWar.expand(ExpandWar.java:115)at org.apache.catalina.startup.ContextConfig.fixDocBase(ContextConfig.java:615)at org.apache.catalina.startup.ContextConfig.beforeStart(ContextConfig.java:747)at org.apache.catalina.startup.ContextConfig.lifecycleEvent(ContextConfig.java:303)at org.apache.catalina.util.LifecycleBase.fireLifecycleEvent(LifecycleBase.java:123)at org.apache.catalina.util.LifecycleBase.setStateInternal(LifecycleBase.java:423)at org.apache.catalina.util.LifecycleBase.start(LifecycleBase.java:182)at org.apache.catalina.core.ContainerBase.addChildInternal(ContainerBase.java:717)at org.apache.catalina.core.ContainerBase.addChild(ContainerBase.java:690)at org.apache.catalina.core.StandardHost.addChild(StandardHost.java:705)at org.apache.catalina.startup.HostConfig.deployWAR(HostConfig.java:978)at org.apache.catalina.startup.HostConfig$DeployWar.run(HostConfig.java:1849)at java.util.concurrent.Executors$RunnableAdapter.call(Executors.java:511)at java.util.concurrent.FutureTask.run(FutureTask.java:266)at org.apache.tomcat.util.threads.InlineExecutorService.execute(InlineExecutorService.java:75)at java.util.concurrent.AbstractExecutorService.submit(AbstractExecutorService.java:112)at org.apache.catalina.startup.HostConfig.deployWARs(HostConfig.java:773)at org.apache.catalina.startup.HostConfig.deployApps(HostConfig.java:427)at org.apache.catalina.startup.HostConfig.start(HostConfig.java:1576)at org.apache.catalina.startup.HostConfig.lifecycleEvent(HostConfig.java:309)at org.apache.catalina.util.LifecycleBase.fireLifecycleEvent(LifecycleBase.java:123)at org.apache.catalina.util.LifecycleBase.setStateInternal(LifecycleBase.java:423)at org.apache.catalina.util.LifecycleBase.setState(LifecycleBase.java:366)at org.apache.catalina.core.ContainerBase.startInternal(ContainerBase.java:936)at org.apache.catalina.core.StandardHost.startInternal(StandardHost.java:841)at org.apache.catalina.util.LifecycleBase.start(LifecycleBase.java:183)at org.apache.catalina.core.ContainerBase$StartChild.call(ContainerBase.java:1384)at org.apache.catalina.core.ContainerBase$StartChild.call(ContainerBase.java:1374)at java.util.concurrent.FutureTask.run(FutureTask.java:266)at org.apache.tomcat.util.threads.InlineExecutorService.execute(InlineExecutorService.java:75)at java.util.concurrent.AbstractExecutorService.submit(AbstractExecutorService.java:134)at org.apache.catalina.core.ContainerBase.startInternal(ContainerBase.java:909)at org.apache.catalina.core.StandardEngine.startInternal(StandardEngine.java:262)at org.apache.catalina.util.LifecycleBase.start(LifecycleBase.java:183)at org.apache.catalina.core.StandardService.startInternal(StandardService.java:421)at org.apache.catalina.util.LifecycleBase.start(LifecycleBase.java:183)at org.apache.catalina.core.StandardServer.startInternal(StandardServer.java:930)at org.apache.catalina.util.LifecycleBase.start(LifecycleBase.java:183)at org.apache.catalina.startup.Catalina.start(Catalina.java:633)at sun.reflect.NativeMethodAccessorImpl.invoke0(Native Method)at sun.reflect.NativeMethodAccessorImpl.invoke(NativeMethodAccessorImpl.java:62)at sun.reflect.DelegatingMethodAccessorImpl.invoke(DelegatingMethodAccessorImpl.java:43)at java.lang.reflect.Method.invoke(Method.java:498)at org.apache.catalina.startup.Bootstrap.start(Bootstrap.java:343)at org.apache.catalina.startup.Bootstrap.main(Bootstrap.java:478)
Java 应用的一个错误导致生成的多行日志其实是同一个事件的日志的内容
而ES默认是根据每一行来区别不同的日志,就会导致一个错误对应多行错误信息会生成很多行的ES文档记录
可以将一个错误对应的多个行合并成一个ES的文档记录来解决此问题
官方文档
https://www.elastic.co/guide/en/beats/filebeat/current/multiline-examples.html
https://www.elastic.co/guide/en/beats/filebeat/7.0/multiline-examples.html
3.3.10.2 安装 Tomcat 并配置
#安装配置
[root@web-server ~]#apt update && apt install -y tomcat9 tomcat9-admin#修改日志格式,添加pattern="......
[root@web-server ~]#vim /etc/tomcat9/server.xml ......<!-- Access log processes all example.Documentation at: /docs/config/valve.htmlNote: The pattern used is equivalent to using pattern="common" --><Valve className="org.apache.catalina.valves.AccessLogValve" directory="logs"prefix="localhost_access_log" suffix=".txt"pattern="{"clientip":"%h","ClientUser":"%l","authenticated":"%u","AccessTime":"%t","method":"%r","status":"%s","SendBytes":"%b","Query?string":"%q","partner":"%{Referer}i","AgentVersion":"%{User-Agent}i"}" /></Host><Host name="website.dingbh.top" appBase="/data/website/"unpackWARs="true" autoDeploy="true"></Host>......[root@web-server ~]#systemctl enable --now tomcat9.service
3.3.10.3 修改 Filebeat 配置文件
[root@web-server ~]#vim /etc/filebeat/filebeat.ymlfilebeat.inputs:
- type: logenabled: true  # 启用该日志输入paths:- /var/log/tomcat9/localhost_access_log.*.txt  # 指定 Tomcat 访问日志的路径json.keys_under_root: true  # 将 JSON 键放在根级别而不是嵌套tags: ["tomcat-access"]  # 为此日志源指定标签 "tomcat-access"- type: logenabled: true  # 启用该日志输入paths:- /var/log/tomcat9/catalina.*.log  # 指定 Tomcat 错误日志的路径json.keys_under_root: true  # 将 JSON 键放在根级别tags: ["tomcat-error"]  # 为此日志源指定标签 "tomcat-error"# 多行日志配置,适用于 Tomcat 的错误日志合并处理multiline.pattern: '^[0-9][0-9]-'  # 正则表达式匹配以日期开头的日志行multiline.negate: true  # 当不匹配模式时,将行附加到上一行multiline.match: after  # 匹配模式后的行将附加到前一行multiline.max_lines: 5000  # 允许合并的最大行数,设置为 5000 行# 添加 message_key 配置json.message_key: "message"  # 指定从 JSON 中提取消息的字段# 输出到 Elasticsearch
output.elasticsearch:hosts: ["11.0.1.101:9200", "11.0.1.102:9200", "11.0.1.103:9200"]  # 定义 Elasticsearch 集群的节点地址列表# 根据日志标签选择合适的索引indices:- index: "tomcat-access-%{[agent.version]}-%{+yyyy.MM.dd}"  # 将访问日志发送到 "tomcat-access-日期" 索引when.contains:tags: "tomcat-access"  # 当日志标签包含 "tomcat-access" 时,输出到此索引- index: "tomcat-error-%{[agent.version]}-%{+yyyy.MM.dd}"  # 将错误日志发送到 "tomcat-error-日期" 索引when.contains:tags: "tomcat-error"  # 当日志标签包含 "tomcat-error" 时,输出到此索引# 禁用 Elasticsearch 的 ILM(Index Lifecycle Management),手动管理索引
setup.ilm.enabled: false# 定义 Elasticsearch 索引模板,确保适用于 Tomcat 的所有日志
setup.template.name: "tomcat"  # 为模板命名为 "tomcat"
setup.template.pattern: "tomcat-*"  # 模板适用于所有以 "tomcat-" 开头的索引# 定义模板设置,包括分片和副本配置
setup.template.settings:index.number_of_shards: 3  # 每个索引的主分片数量为 3index.number_of_replicas: 1  # 每个分片的副本数为 1,确保高可用性
3.3.10.4 插件查看索引
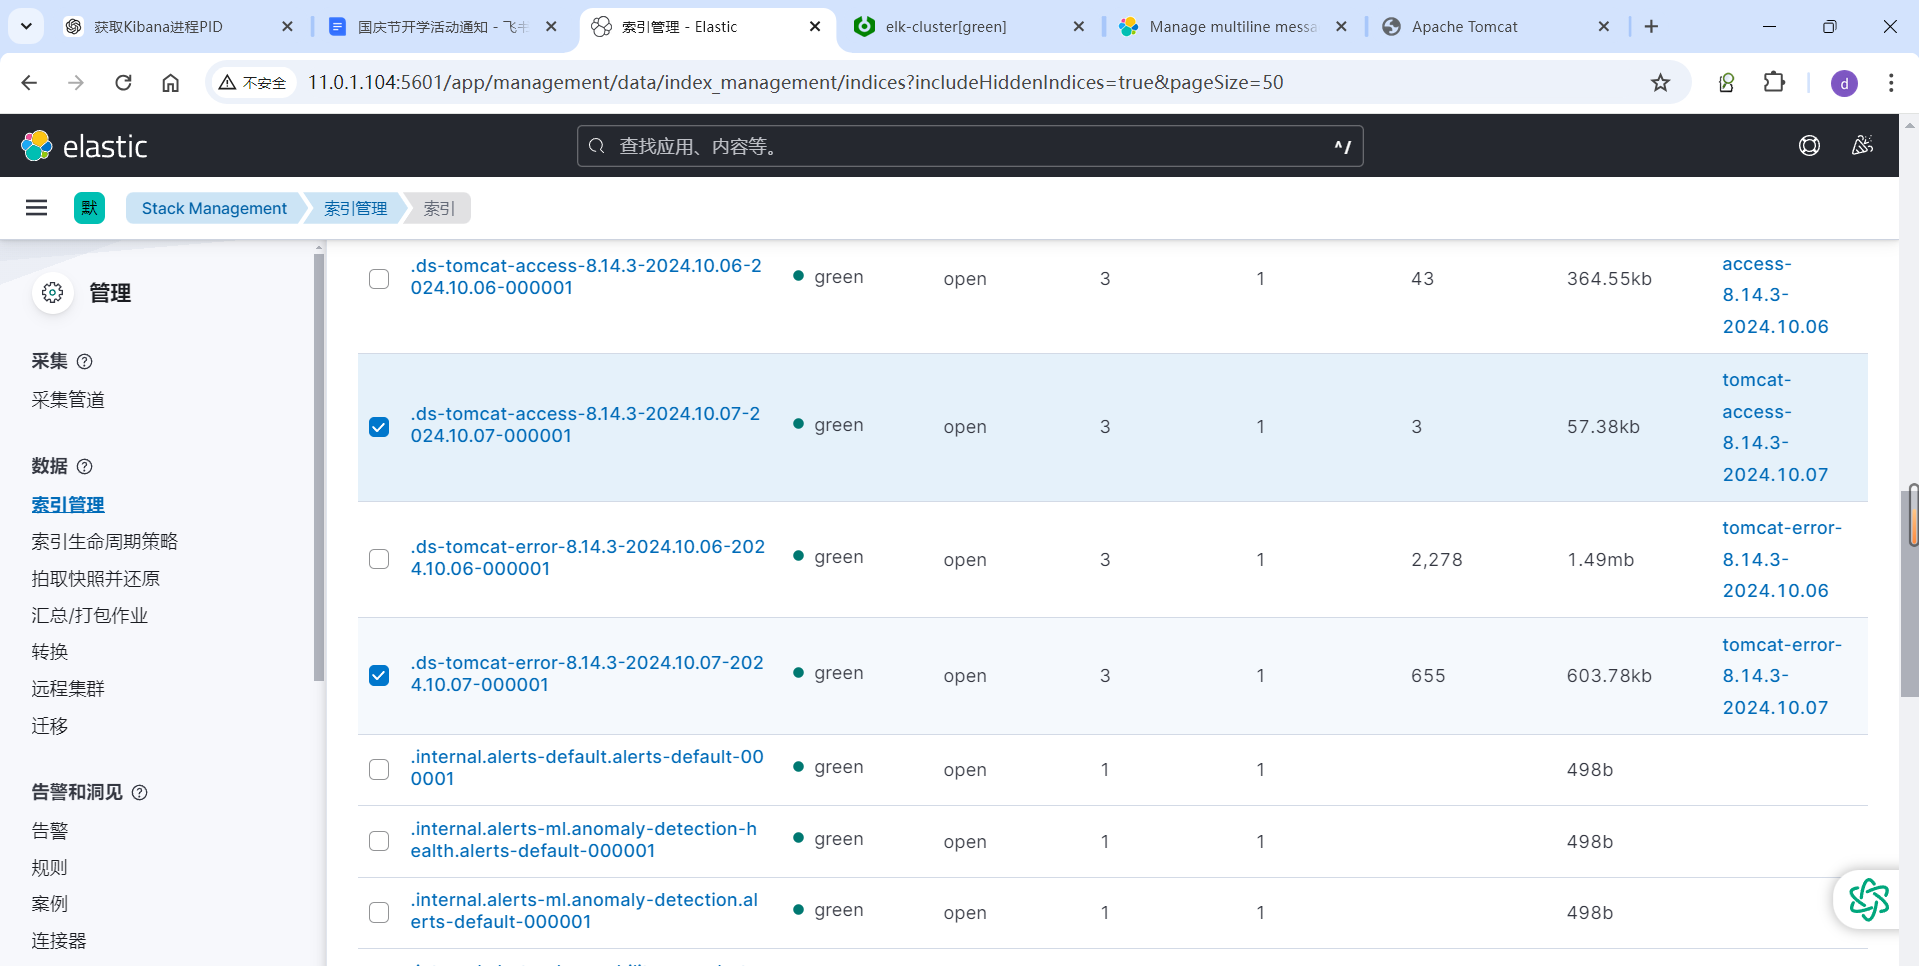
3.3.10.5 通过 Kibana 查看收集的日志信息
创建访问日志的索引模式
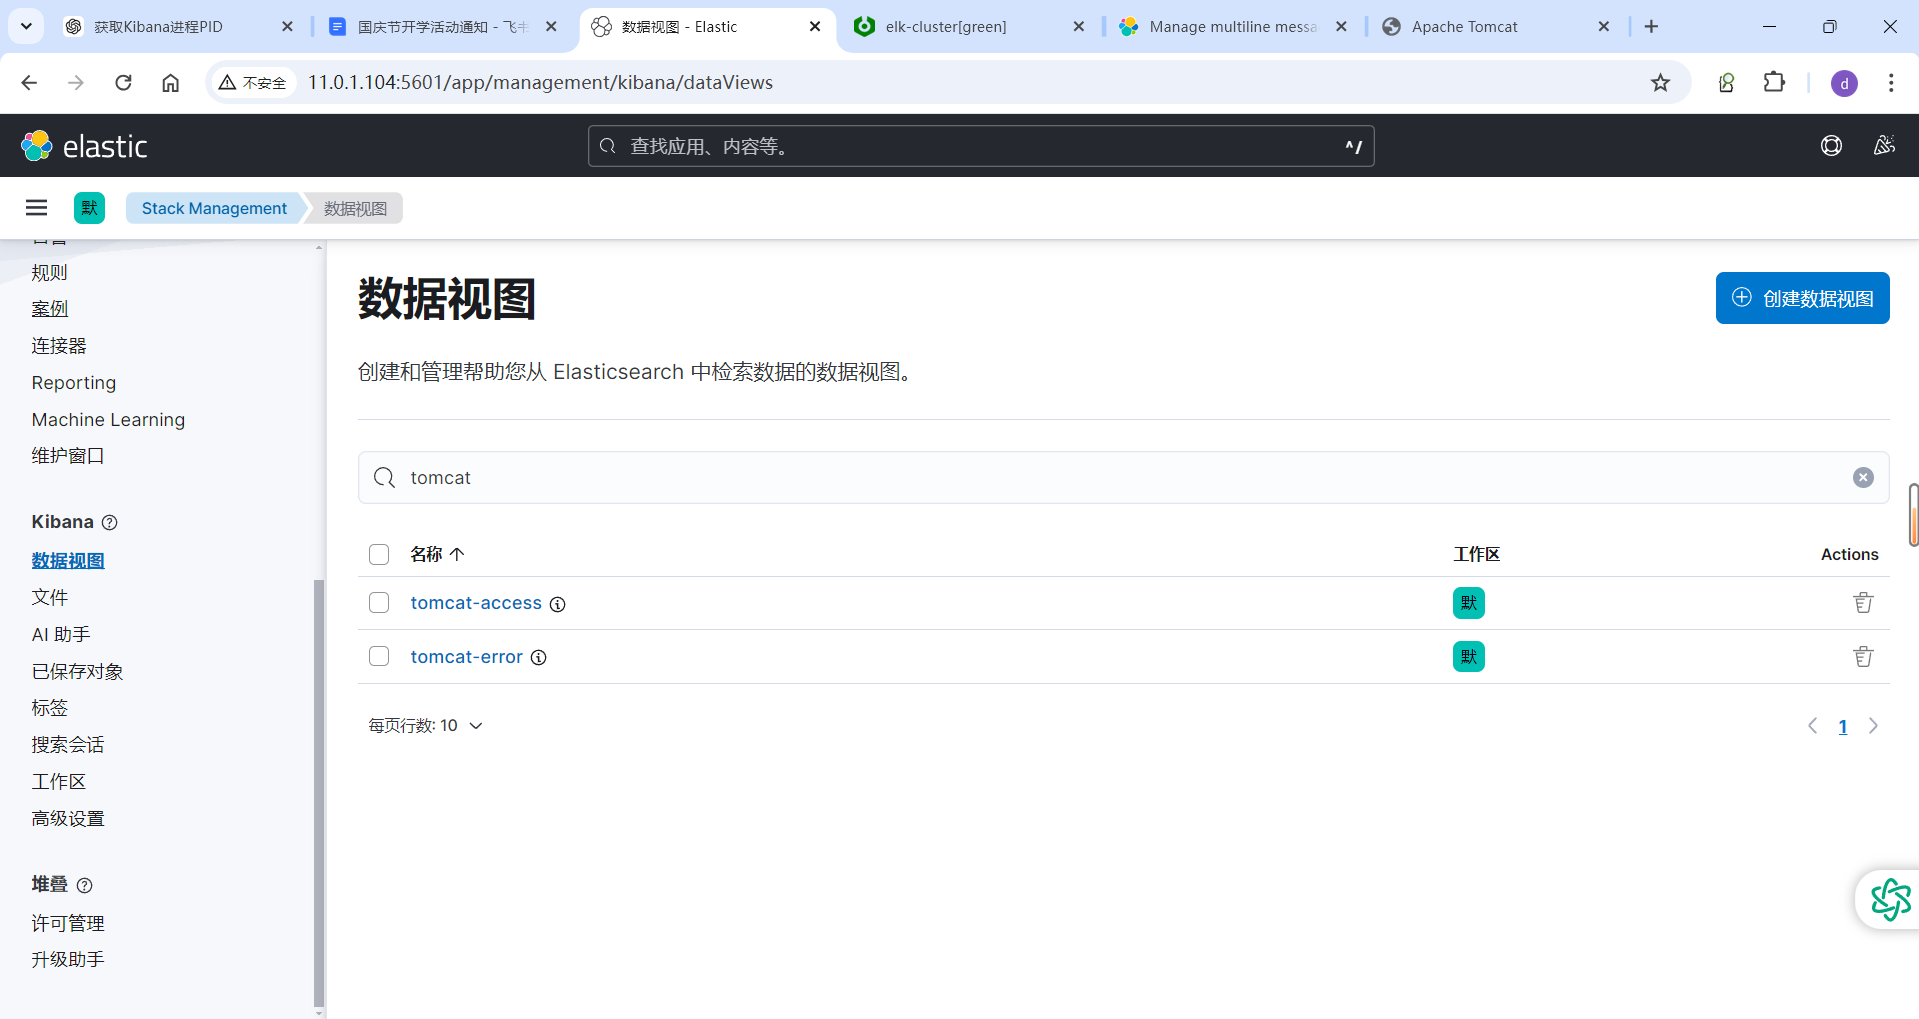
查看错误索引,可以看到多行合并为一个日志
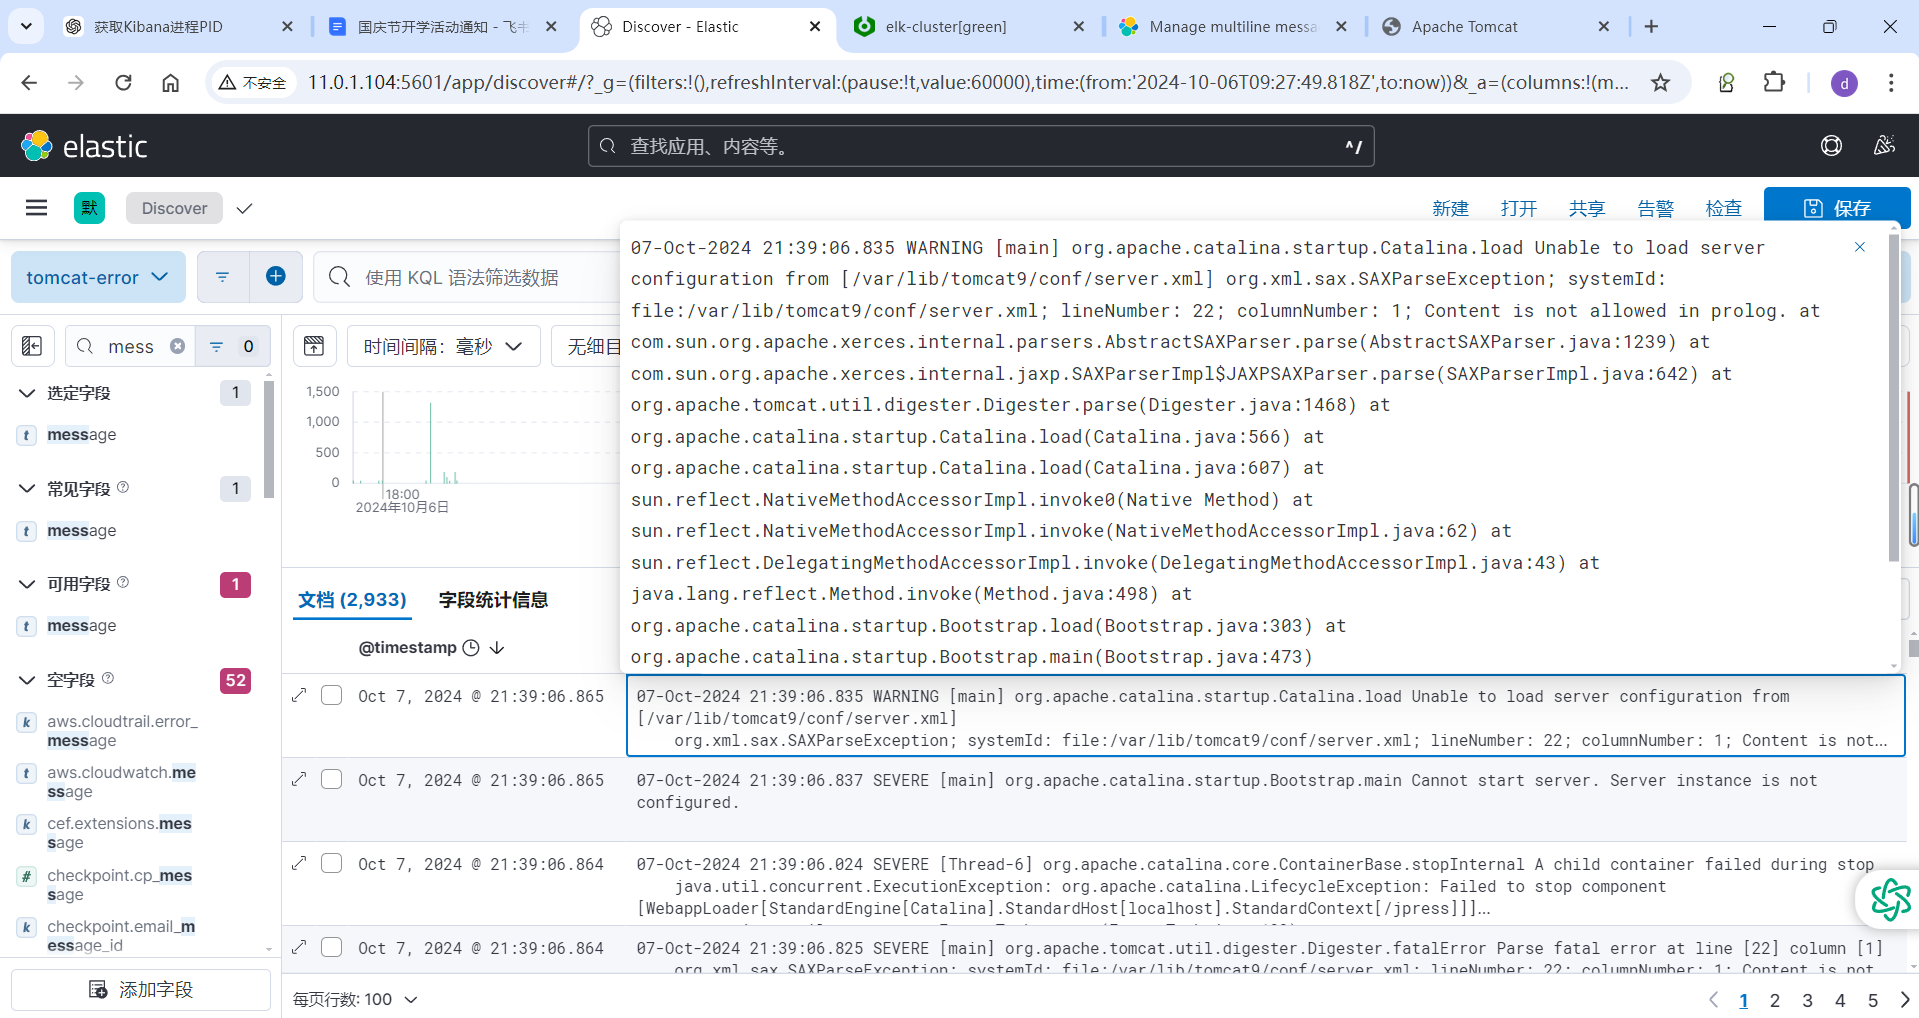
3.3.11 案例: 从标准输入读取再输出至 Logstash
3.3.12 案例: 利用 Filebeat 收集 Nginx 日志到 Redis
官方文档
https://www.elastic.co/guide/en/beats/filebeat/master/redis-output.html
https://www.elastic.co/guide/en/beats/filebeat/7.6/filebeat-input-log.html
https://www.elastic.co/guide/en/beats/filebeat/7.6/redis-output.html
将 filebeat收集的日志,发送至Redis 格式如下
output.redis:hosts: ["localhost:6379"]password: "my_password"key: "filebeat"db: 0timeout: 5
范例:
环境准备
11.0.1.101  es-node01
11.0.1.102  es-node02
11.0.1.103  es-node0311.0.1.104  nginx-server、kibana
11.0.1.105  tomcat-server11.0.1.10  redis-master
11.0.1.11  kafka-node01
11.0.1.12  kafka-node02
11.0.1.13  kafka-node03
3.3.12.1 安装 Nginx 配置访问日志使用 Json格式
[root@kibana01 ~]#grep -Ev '^#|^$' /etc/nginx/nginx.conf
user www-data;
worker_processes auto;
pid /run/nginx.pid;
include /etc/nginx/modules-enabled/*.conf;
events {worker_connections 768;
}
http {sendfile on;tcp_nopush on;tcp_nodelay on;keepalive_timeout 65;types_hash_max_size 2048;default_type application/octet-stream;ssl_protocols TLSv1 TLSv1.1 TLSv1.2 TLSv1.3; # Dropping SSLv3, ref: POODLEssl_prefer_server_ciphers on;# 定义自定义日志格式为 JSON 格式,并进行 JSON 字符转义log_format json_logs escape=json '{''"@timestamp":"$time_iso8601",'               # 记录 ISO 8601 格式的时间戳'"host":"$server_addr",'                      # 服务器地址'"clientip":"$remote_addr",'                  # 客户端 IP 地址'"size":$body_bytes_sent,'                    # 响应发送给客户端的字节数'"responsetime":$request_time,'               # 请求处理时间'"upstreamtime":"$upstream_response_time",'   # 上游服务器响应时间'"upstreamhost":"$upstream_addr",'            # 上游服务器地址'"http_host":"$host",'                        # 请求中的 Host 头部'"uri":"$uri",'                               # 请求的 URI'"domain":"$host",'                           # 请求中的域名'"xff":"$http_x_forwarded_for",'              # 客户端的 X-Forwarded-For 头,表示客户端的原始 IP'"referer":"$http_referer",'                  # 请求的 Referer 头'"tcp_xff":"$proxy_protocol_addr",'           # 通过 TCP 代理协议传递的原始客户端 IP 地址'"http_user_agent":"$http_user_agent",'       # 用户代理(客户端的浏览器或其他信息)'"status":"$status"}';                        # HTTP 响应状态码# 使用自定义的 JSON 格式记录访问日志access_log /var/log/nginx/access_json.log json_logs;# 指定错误日志的输出位置error_log /var/log/nginx/error_json.log;gzip on;include /etc/nginx/conf.d/*.conf;include /etc/nginx/sites-enabled/*;
}[root@kibana01 ~]#ls /var/log/nginx/*json* -l
-rw-r--r-- 1 root root 312 Oct  8 01:28 /var/log/nginx/access_json.log
-rw-r--r-- 1 root root   0 Oct  8 01:27 /var/log/nginx/error_json.log[root@kibana01 ~]#tail -f /var/log/nginx/access_json.log
{"@timestamp":"2024-10-08T01:28:33+08:00","host":"127.0.0.1","clientip":"127.0.0.1","size":17,"responsetime":0.000,"upstreamtime":"","upstreamhost":"","http_host":"127.0.0.1","uri":"/index.nginx-debian.html","domain":"127.0.0.1","xff":"","referer":"","tcp_xff":"","http_user_agent":"curl/7.68.0","status":"200"}
3.3.12.2 安装和配置 Redis
root@redis-master:~# apt -y install redis
root@redis-master:~# sed -i.bak '/^bind.*/c bind 0.0.0.0' /etc/redis/redis.conf
root@redis-master:~# echo 'requirepass 123456' >> /etc/redis/redis.conf
root@redis-master:~# systemctl restart redis
3.3.12.3 修改 Filebeat 配置文件
[root@kibana01 ~]# vim /etc/filebeat/filebeat.ymlfilebeat.inputs:
- type: logenabled: truepaths:- /var/log/nginx/access_json.logjson.keys_under_root: true	#默认False会将json数据存储至message,改为true则会独立message外存储json.overwrite_keys: true  #设为true,覆盖默认的message字段,使用自定义json格式中的keytags: ["nginx104-access"]- type: logenabled: truepaths:- /var/log/nginx/error_json.logjson.keys_under_root: truetags: ["nginx104-error"]output.redis:hosts: ["11.0.1.10:6379"]key: "nginx104"password: "123456"db: "0"timeout: 5[root@kibana01 ~]# systemctl restart filebeat.service
3.3.12.4 在 Redis 验证日志数据
root@redis-master:~# redis-cli -a 123456
Warning: Using a password with '-a' or '-u' option on the command line interface may not be safe.
127.0.0.1:6379> KEYS *
1) "nginx104"
127.0.0.1:6379> TYPE nginx104
list
127.0.0.1:6379> LLEN nginx104
(integer) 3
127.0.0.1:6379> LINDEX nginx104 3
(nil)
127.0.0.1:6379> LINDEX nginx104 2
"{\"@timestamp\":\"2024-10-07T17:47:56.437Z\",\"@metadata\":{\"beat\":\"filebeat\",\"type\":\"_doc\",\"version\":\"8.14.3\"},\"input\":{\"type\":\"log\"},\"agent\":{\"ephemeral_id\":\"373d58b4-9621-43b0-b0f9-4c62cd619c44\",\"id\":\"c5e80544-fb8d-4ec1-a3de-d954f88c429a\",\"name\":\"kibana01.dinginx.org\",\"type\":\"filebeat\",\"version\":\"8.14.3\"},\"xff\":\"\",\"size\":17,\"tcp_xff\":\"\",\"upstreamtime\":\"\",\"status\":\"200\",\"http_host\":\"11.0.1.104\",\"clientip\":\"11.0.1.104\",\"uri\":\"/index.nginx-debian.html\",\"log\":{\"file\":{\"path\":\"/var/log/nginx/access_json.log\"},\"offset\":628},\"responsetime\":0,\"http_user_agent\":\"curl/7.68.0\",\"tags\":[\"nginx104-access\"],\"domain\":\"11.0.1.104\",\"upstreamhost\":\"\",\"ecs\":{\"version\":\"8.0.0\"},\"host\":{\"name\":\"kibana01.dinginx.org\"},\"referer\":\"\"}"
127.0.0.1:6379>
3.3.13 案例: 从标准输入读取再输出至 Kafka
https://www.elastic.co/guide/en/beats/filebeat/current/kafka-output.html
[root@kibana01 ~]#vim /etc/filebeat/filebeat.yml# Filebeat Inputs
filebeat.inputs:
- type: logenabled: truepaths:- /var/log/nginx/access_json.logjson.keys_under_root: true       # 将JSON键值提升到根级别json.overwrite_keys: true        # 如果键值存在,允许覆盖tags: ["nginx104-access"]        # 给日志打上标签,便于区分- type: logenabled: truepaths:- /var/log/nginx/error_json.logjson.keys_under_root: true       # 将JSON键值提升到根级别tags: ["nginx104-error"]         # 给日志打上标签,便于区分# Kafka Output Configuration
output.kafka:hosts: ["11.0.1.11:9092", "11.0.1.12:9092", "11.0.1.13:9092"]  # Kafka broker 列表topic: filebeat104-log                                          # 指定 Kafka topicpartition.round_robin:reachable_only: true                                          # 仅发送到可用的分区required_acks: 1                                                # 等待主分区的确认compression: gzip                                               # 使用 gzip 压缩消息max_message_bytes: 11.0.10                                      # 每条消息最大1MB[root@kibana01 ~]#systemctl restart filebeat.service && systemctl status filebeat.service ##生成nginx测试数据
[root@kibana01 ~]#for i in {1..100};do curl 11.0.1.104 && sleep 1;done
kafka客户端验证数据
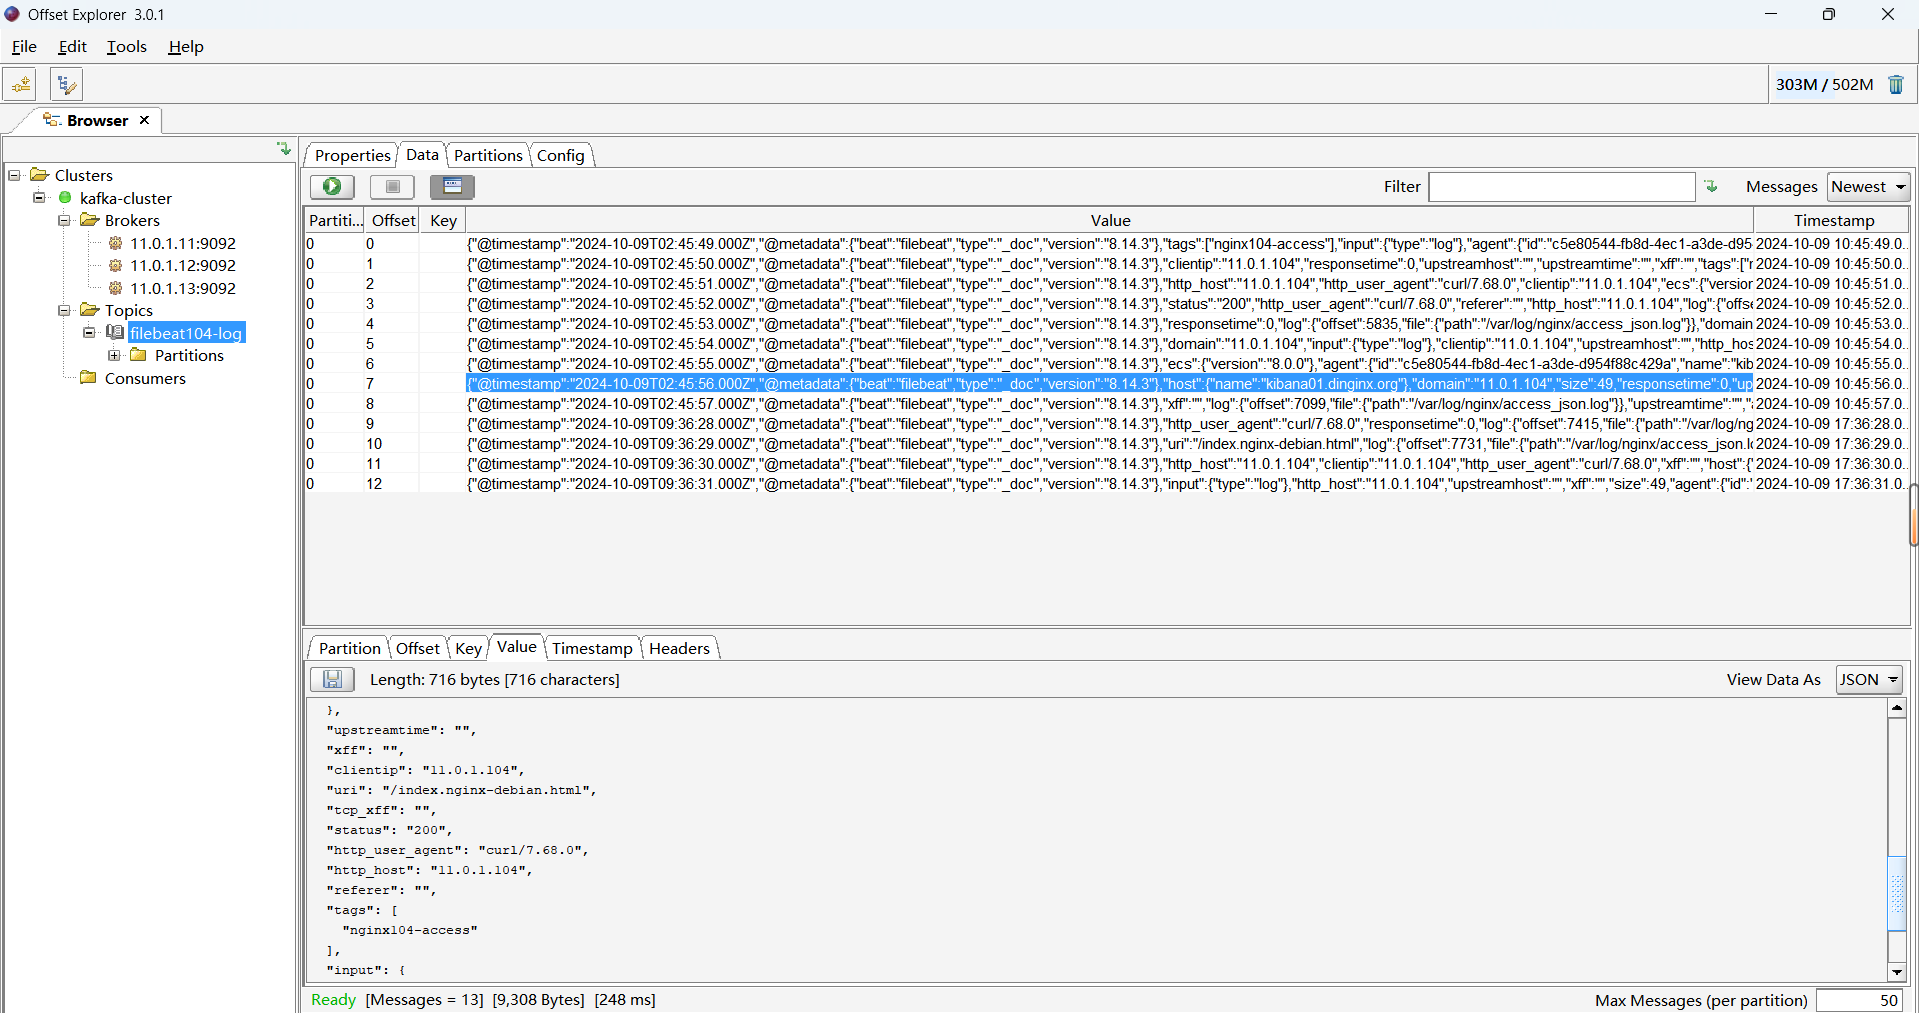
4 Logstash 过滤
4.1 Logstash 介绍
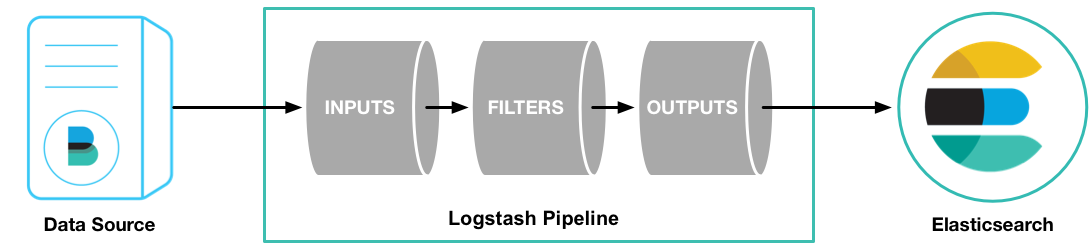
Logstash 是免费且开放的服务器端数据处理管道,能够从多个来源采集数据,转换数据,然后将数据发送到您最喜欢的一个或多个“存储库”中
Logstash 可以水平伸缩,而且logstash是整个ELK中拥有最多插件的一个组件
Logstash 基于 Java 和 Ruby 语言开发
Logstash 官网:
#官方介绍
https://www.elastic.co/cn/logstash/#Logstash 官方说明
https://www.elastic.co/guide/en/logstash/7.6/index.html
Logstash 架构:
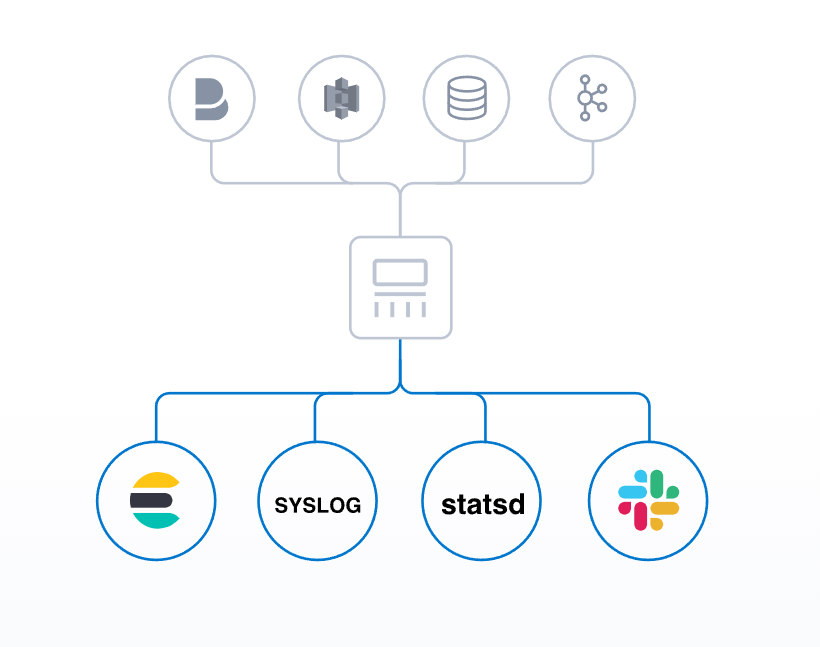
- 输入 Input:用于日志收集,常见插件: Stdin、File、Kafka、Redis、Filebeat、Http
- 过滤 Filter:日志过滤和转换,常用插件: grok、date、geoip、mutate、useragent
- 输出 Output:将过滤转换过的日志输出, 常见插件: File,Stdout,Elasticsearch,MySQL,Redis,Kafka
Logstash 和 Filebeat 比较
- Logstash 功能更丰富,可以支持直接将非Josn 格式的日志统一转换为Json格式,且支持多目标输出,和filebeat相比有更为强大的过滤转换功能
- Logstash 资源消耗更多,不适合在每个日志主机上安装
4.2 Logstash 安装
安装要求
https://www.elastic.co/guide/en/logstash/current/getting-started-with-logstash.html
安装方法
https://www.elastic.co/guide/en/logstash/current/installing-logstash.html
可以支持下面安装方法
- 二进制
- 包仓库
- Docker 容器
4.2.1 环境准备安装 Java 环境
注意: 新版logstash包已经内置了JDK无需安装;新版 Logstash 要求 JAVA 要求 11和17
https://www.elastic.co/guide/en/logstash/current/getting-started-with-logstash.html
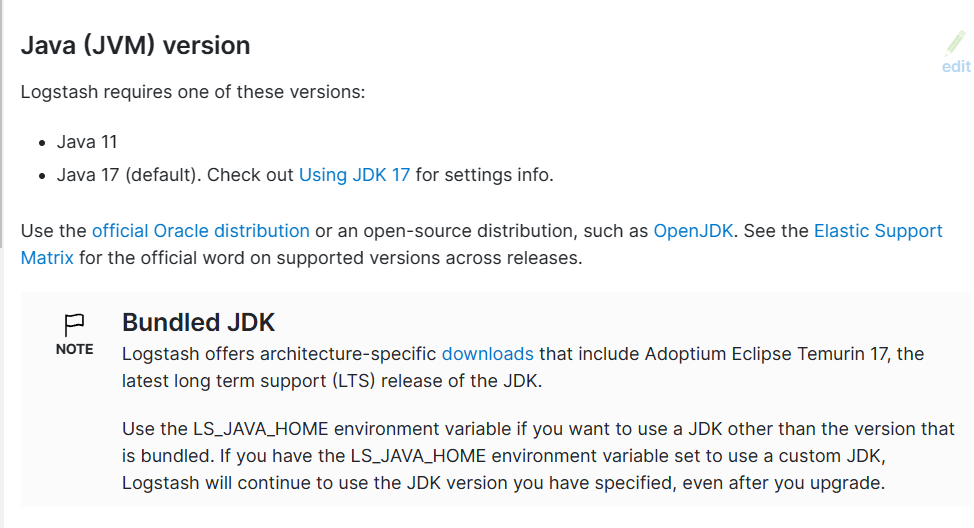
4.2.1.1 Ubuntu 环境准备
#8.X要求安装JDK11或17,新版logstash包已经内置了JDK无需安装
[root@logstash ~]#apt update && apt -y install openjdk-17-jdk
[root@logstash ~]#apt update && apt -y install openjdk-11-jdk#7.X 要求安装JDK8
[root@logstash ~]#apt -y install openjdk-8-jdk
4.2.1.2 CentOS 环境准备
关闭防火墙和 SELinux
[root@logstash ~]# systemctl disable --now firewalld
[root@logstash ~]# sed -i '/SELINUX/s/enforcing/disabled/' /etc/selinux/config
[root@logstash ~]# setenforce 0
安装 Java 环境
#安装oracle 的JDK
[root@logstash ~]# yum install jdk-8u121-linux-x64.rpm
[root@logstash ~]# java -version
java version "1.8.0_121"
Java(TM) SE Runtime Environment (build 1.8.0_121-b13)
Java HotSpot(TM) 64-Bit Server VM (build 25.121-b13, mixed mode)#或者安装OpenJDK
[root@logstash ~]# yum -y install java-1.8.0-openjdk
[root@logstash ~]# java -version
openjdk version "1.8.0_302"
OpenJDK Runtime Environment (build 1.8.0_302-b08)
OpenJDK 64-Bit Server VM (build 25.302-b08, mixed mode)
4.2.2 安装 Logstash
注意: Logstash 版本要和 Elasticsearch 相同的版本,否则可能会出错
Logstash 官方下载链接:
https://www.elastic.co/cn/downloads/logstash
https://www.elastic.co/cn/downloads/past-releases#logstash
#下载二进制包
root@logstash:~# waget https://mirrors.tuna.tsinghua.edu.cn/elasticstack/8.x/apt/pool/main/l/logstash/logstash-8.14.3-amd64.deb#安装
root@logstash:~# dpkg -i logstash-8.14.3-amd64.deb #启动服务
root@logstash:~# systemctl enable --now logstash.service #生成专有用户logstash,以此用户启动服务,后续使用时可能会存在权限问题
root@logstash:~# id  logstash
uid=999(logstash) gid=999(logstash) groups=999(logstash)#如需本机收集日志需修改用户权限
root@logstash:~# vim /lib/systemd/system/logstash.service [Unit]
Description=logstash[Service]
Type=simple
#User=logstash	#注释用户名、用户组
#Group=logstash......root@logstash:~# systemctl daemon-reload && systemctl restart logstash.service #进程信息
root@logstash:~# ps aux|grep logstash
logstash    5007  185 19.8 3670836 391808 ?      SNsl 18:39   0:18 /usr/share/logstash/jdk/bin/java -Xms1g -Xmx1g -Djava.awt.headless=true -Dfile.encoding=UTF-8 -Djruby.compile.invokedynamic=true -XX:+HeapDumpOnOutOfMemoryError -Djava.security.egd=file:/dev/urandom -Dlog4j2.isThreadContextMapInheritable=true -Dlogstash.jackson.stream-read-constraints.max-string-length=200000000 -Dlogstash.jackson.stream-read-constraints.max-number-length=10000 -Djruby.regexp.interruptible=true -Djdk.io.File.enableADS=true --add-exports=jdk.compiler/com.sun.tools.javac.api=ALL-UNNAMED --add-exports=jdk.compiler/com.sun.tools.javac.file=ALL-UNNAMED --add-exports=jdk.compiler/com.sun.tools.javac.parser=ALL-UNNAMED --add-exports=jdk.compiler/com.sun.tools.javac.tree=ALL-UNNAMED --add-exports=jdk.compiler/com.sun.tools.javac.util=ALL-UNNAMED --add-opens=java.base/java.security=ALL-UNNAMED --add-opens=java.base/java.io=ALL-UNNAMED --add-opens=java.base/java.nio.channels=ALL-UNNAMED --add-opens=java.base/sun.nio.ch=ALL-UNNAMED --add-opens=java.management/sun.management=ALL-UNNAMED -Dio.netty.allocator.maxOrder=11 -cp /usr/share/logstash/vendor/jruby/lib/jruby.jar:/usr/share/logstash/logstash-core/lib/jars/checker-qual-3.33.0.jar:/usr/share/logstash/logstash-core/lib/jars/commons-codec-1.15.jar:/usr/share/logstash/logstash-core/lib/jars/commons-compiler-3.1.0.jar:/usr/share/logstash/logstash-core/lib/jars/commons-logging-1.2.jar:/usr/share/logstash/logstash-core/lib/jars/error_prone_annotations-2.18.0.jar:/usr/share/logstash/logstash-core/lib/jars/failureaccess-1.0.1.jar:/usr/share/logstash/logstash-core/lib/jars/google-java-format-1.15.0.jar:/usr/share/logstash/logstash-core/lib/jars/guava-32.1.2-jre.jar:/usr/share/logstash/logstash-core/lib/jars/httpclient-4.5.13.jar:/usr/share/logstash/logstash-core/lib/jars/httpcore-4.4.14.jar:/usr/share/logstash/logstash-core/lib/jars/jackson-annotations-2.15.3.jar:/usr/share/logstash/logstash-core/lib/jars/jackson-core-2.15.3.jar:/usr/share/logstash/logstash-core/lib/jars/jackson-databind-2.15.3.jar:/usr/share/logstash/logstash-core/lib/jars/jackson-dataformat-cbor-2.15.3.jar:/usr/share/logstash/logstash-core/lib/jars/janino-3.1.0.jar:/usr/share/logstash/logstash-core/lib/jars/javassist-3.29.0-GA.jar:/usr/share/logstash/logstash-core/lib/jars/jsr305-3.0.2.jar:/usr/share/logstash/logstash-core/lib/jars/jvm-options-parser-8.14.3.jar:/usr/share/logstash/logstash-core/lib/jars/listenablefuture-9999.0-empty-to-avoid-conflict-with-guava.jar:/usr/share/logstash/logstash-core/lib/jars/log4j-1.2-api-2.17.1.jar:/usr/share/logstash/logstash-core/lib/jars/log4j-api-2.17.1.jar:/usr/share/logstash/logstash-core/lib/jars/log4j-core-2.17.1.jar:/usr/share/logstash/logstash-core/lib/jars/log4j-jcl-2.17.1.jar:/usr/share/logstash/logstash-core/lib/jars/log4j-slf4j-impl-2.17.1.jar:/usr/share/logstash/logstash-core/lib/jars/logstash-core.jar:/usr/share/logstash/logstash-core/lib/jars/reflections-0.10.2.jar:/usr/share/logstash/logstash-core/lib/jars/slf4j-api-1.7.32.jar:/usr/share/logstash/logstash-core/lib/jars/snakeyaml-2.2.jar org.logstash.Logstash --path.settings /etc/logstash
root        5061  0.0  0.1  12304  2288 pts/2    R+   18:39   0:00 grep --color=auto logstash
4.2.2.2 RHEL系列安装 Logstash
[root@logstash ~]#wget https://mirrors.tuna.tsinghua.edu.cn/elasticstack/7.x/yum/7.6.2/logstash-7.6.2.rpm
[root@logstash ~]#yum install logstash-7.6.2.rpm
[root@logstash ~]#chown logstash.logstash /usr/share/logstash/data/queue –R #权限更改为logstash用户和组,否则启动的时候日志报错
4.2.2.3 修改 Logstash 配置(可选)
#默认配置可以不做修改
#默认配置可以不做修改
[root@logstash ~]#vim /etc/logstash/logstash.yml
[root@logstash ~]#grep -Ev '#|^$' /etc/logstash/logstash.yml
node.name: logstash-node01
pipeline.workers: 2
pipeline.batch.size: 1000    #批量从IPNPUT读取的消息个数,可以根据ES的性能做性能优化
pipeline.batch.delay: 5      #处理下一个事件前的最长等待时长,以毫秒ms为单位,可以根据ES的性能做性能优化
path.data: /var/lib/logstash #默认值
path.logs: /var/log/logstash #默认值
#内存优化
[root@logstash ~]#vim /etc/logstash/jvm.options
-Xms1g
-Xmx1g
#Logstash默认以logstash用户运行,如果logstash需要收集本机的日志,可能会有权限问题,可以修改为root
[root@logstash ~]#vim /etc/systemd/system/logstash.service
[Service]
User=root
Group=root
#子配置文件路径
[root@logstash ~]#cat /etc/logstash/pipelines.yml
# This file is where you define your pipelines. You can define multiple.
# For more information on multiple pipelines, see the documentation:
#   https://www.elastic.co/guide/en/logstash/current/multiple-pipelines.html
- pipeline.id: mainpath.config: "/etc/logstash/conf.d/*.conf"
[root@logstash ~]#systemctl daemon-reload;systemctl restart logstash
4.3 Logstash 使用
4.3.1 Logstash 命令
官方文档
https://www.elastic.co/guide/en/logstash/current/first-event.html
#各种插件
https://www.elastic.co/guide/en/logstash/current/input-plugins.html
https://www.elastic.co/guide/en/logstash/current/filter-plugins.html
https://www.elastic.co/guide/en/logstash/current/output-plugins.html
https://www.elastic.co/guide/en/logstash/7.6/input-plugins.html
https://www.elastic.co/guide/en/logstash/7.6/filter-plugins.html
https://www.elastic.co/guide/en/logstash/7.6/output-plugins.html
范例: 查看帮助
[root@logstash ~]#/usr/share/logstash/bin/logstash --help#常用选项
-e 指定配置内容
-f 指定配置文件,支持绝对路径,如果用相对路径,是相对于/usr/share/logstash/的路径
-t 语法检查
-r 修改配置文件后自动加载生效,注意:有时候修改配置还需要重新启动生效
#服务方式启动,由于默认没有配置文件,所以7.X无法启动,8.X可以启动#各种插件帮助
https://www.elastic.co/guide/en/logstash/current/index.html
范例: 列出所有插件
[root@logstash ~]#/usr/share/logstash/bin/logstash-plugin list
Github logstash插件链接
https://github.com/logstash-plugins
4.3.2 Logstash 输入 Input 插件
#官方链接
https://www.elastic.co/guide/en/logstash/7.6/input-plugins.html
4.3.2.1 标准输入
codec 用于输入数据的编解码器,默认值为plain表示单行字符串,若设置为json,表示按照json方式解析
范例: 交互式实现标准输入
#标准输入和输出,codec => rubydebug指输出格式,是默认值,可以省略,也支持设为json,以json格式输出
root@logstash:~# /usr/share/logstash/bin/logstash -e 'input{ stdin {} } output{ stdout{ codec => rubydebug } }'......hello world
{"@version" => "1","event" => {"original" => "hello world"},"message" => "hello world","@timestamp" => 2024-10-10T11:11:09.658273096Z,"host" => {"hostname" => "logstash"}
}#json输出
root@logstash:~# /usr/share/logstash/bin/logstash -e 'input{ stdin {} } output{ stdout{ codec => "json" } }'
hello world
{"event":{"original":"hello world"},"message":"hello world","@timestamp":"2024-10-10T11:15:02.665531820Z","host":{"hostname":"logstash"},"@version":"1"}#json输入,rubydebug输出
root@logstash:~# /usr/share/logstash/bin/logstash -e 'input{ stdin{codec => "json"}} output{stdourubydebug }}'{"event":{"original":"hello world"},"message":"hello world","@timestamp":"2024-10-10T11:15:02.665531820Z","host":{"hostname":"logstash"},"@version":"1"}
{"@version" => "1","message" => "hello world","@timestamp" => 2024-10-10T11:15:02.665531820Z,"host" => {"hostname" => "logstash"},"event" => {"original" => "hello world"}
}#输入非Json格式信息,告警提示无法自动解析,存放message字段
范例: 以配置文件实现标准输入
#配置文件
[root@logstash ~]#cat /etc/logstash/conf.d/stdin_to_stdout.conf
input {stdin {type => "stdin_type"      #自定义事件类型,可用于后续判断tags => "stdin_tag"       #自定义事件tag,可用于后续判断codec => "json"           #指定Json 格式}
}
output {stdout {codec => "rubydebug" #输出格式,此为默认值,可省略}
}
#语法检查
root@logstash:/etc/logstash# /usr/share/logstash/bin/logstash -f /etc/logstash/conf.d/stdin_to_stdout.conf -t
Configuration OK#执行logstash,选项-r表示动态加载配,测试数据 { "name":"dinginx","age": "18"}root@logstash:/etc/logstash/conf.d# /usr/share/logstash/bin/logstash -f /etc/logstash/conf.d/stdin_file.conf -r......{ "name":"dinginx","age": "18"}
{"event" => {"original" => " { \"name\":\"dinginx\",\"age\": \"18\"}\n"},"tags" => [[0] "stdin_tag"],"@timestamp" => 2024-10-12T02:56:31.320970754Z,"name" => "dinginx","type" => "stdin_type","@version" => "1","host" => {"hostname" => "logstash"},"age" => "18"
}
4.3.2.2 从文件输入
Logstash 会记录每个文件的读取位置,下次自动从此位置继续向后读取
每个文件的读取位置记录在 /var/lib/logstash/plugins/inputs/file/.sincedb_xxxx对应的文件中
此文件包括文件的 inode号, 大小等信息
范例:
root@ubuntu2204:/etc/logstash/conf.d# cat file_to_stdout.conf # 从文件读取 -> Logstash -> 输出到标准输出 (stdout) 的管道。input {# 输入部分 - 第一个输入块读取 nginx 日志文件file {# 指定要读取的文件路径,这里匹配 /tmp 下 dinginx 开头的文件path => "/tmp/dinginx.*"# 定义日志类型,方便后续过滤或处理type => "dinginxlog"# 排除以 .txt 结尾的文件exclude => "*.txt"# 从文件开始处读取("beginning" 表示从文件开头读取)start_position => "beginning"# 定时检查文件是否更新,默认1sstat_interval => "3"# 如果文件是Json格式,需要指定此项才能解析,如果不是Json格式而添加此行也不会影响结果codec => json}# 输入部分 - 第二个输入块读取系统日志(/var/log/syslog)file {# 指定要读取的系统日志文件路径path => "/var/log/syslog"# 定义日志类型为 "syslog"type => "syslog"# 同样从文件开头读取start_position => "beginning"# 每 3 秒检查文件的变化stat_interval => "3"}
}output {# 输出部分 - 将日志输出到标准输出(stdout),使用 rubydebug 编解码器以便于调试stdout {# 使用 rubydebug 编解码器格式化输出,便于查看详细的日志信息codec => rubydebug}
}#语法检查
root@ubuntu2204:/etc/logstash# /usr/share/logstash/bin/logstash -f /etc/logstash/conf.d/file_to_stdout.conf -t#执行
##测试数据
root@logstash:~# echo "line3" |tee -a /var/log/syslog
line3#观察logstash变化
root@logstash:~# /usr/share/logstash/bin/logstash -f /etc/logstash/conf.d/file_to_stdout.conf -r......{"type" => "syslog","event" => {"original" => "line3"},"log" => {"file" => {"path" => "/var/log/syslog"}},"message" => "line3","@version" => "1","host" => {"name" => "logstash"},"@timestamp" => 2024-10-12T13:16:58.333059026Z
}#追加json数据
##测试数据
root@logstash:~# echo '{ "name":"digninx","age": "18","gender":"male"}' |tee -a /tmp/dinginx.log
{ "name":"digninx","age": "18","gender":"male"}#可以看到logstash会输出自动解析出来的下面内容
{"age" => "18","@timestamp" => 2024-10-12T13:22:57.134371346Z,"name" => "digninx","type" => "dinginxlog","log" => {"file" => {"path" => "/tmp/dinginx.log"}},"@version" => "1","event" => {"original" => "{ \"name\":\"digninx\",\"age\": \"18\",\"gender\":\"male\"}"},"gender" => "male","host" => {"name" => "logstash"}
}
logstash利用 sincedb 文件记录了logstash收集的记录文件的信息,比如位置,以方便下次接着从此位置继续收集日志
root@logstash:~# cat /usr/share/logstash/data/plugins/inputs/file/.sincedb_5167ddd5944dfbda224a6318b7413e59
1835027 0 2050 5398 1728739377.1349 /tmp/dinginx.log		 #记录了收集文件的inode和大小等信息#1835027 - inode(文件节点号)
#0 - major device number(主设备号)
#2050 - minor device number(次设备号)
#5398 - 文件偏移量(file offset)
#1728739377.1349 - 时间戳
#/tmp/dinginx.log - 文件路径root@logstash:~# ls -li /tmp/dinginx.log
1835027 -rw-r--r-- 1 root root 5398 10月 12 13:22 /tmp/dinginx.log
4.3.2.3 从 Http 请求买取数据
root@logstash:~# vim /etc/logstash/conf.d/http_to_stdout.confinput {http {port => 6666codec => "json"}
}output {stdout {codec => "rubydebug"}
}#查看监听端口
root@logstash:~# ss -ntl|grep 6666
LISTEN 0      128                     *:6666            *:*   #执行下面访问可以看到上面信息
root@logstash:~# curl -XPOST -d'welcome to dinginx-website' http://logstash.dinginx.org:6666#在logstash显示数据如下......{"tags" => [[0] "_jsonparsefailure"],"url" => {"domain" => "logstash.dinginx.org","port" => 6666,"path" => "/"},"user_agent" => {"original" => "curl/7.81.0"},"message" => "welcome to dinginx-website","http" => {"request" => {"body" => {"bytes" => "26"},"mime_type" => "application/x-www-form-urlencoded"},"method" => "POST","version" => "HTTP/1.1"},"@version" => "1","@timestamp" => 2024-10-12T13:45:37.302543185Z,"host" => {"ip" => "11.0.1.10"}
}#提交Json格式数据,可以自动解析
curl -XPOST -d'{ "name":"dinginx","age": "18","gender":"male"}'  http://logstash.dinginx.org:6666 #在logstash显示数据如下
{"url" => {"domain" => "logstash.dinginx.org","port" => 6666,"path" => "/"},"user_agent" => {"original" => "curl/7.81.0"},"name" => "dinginx","age" => "18","event" => {"original" => "{ \"name\":\"dinginx\",\"age\": \"18\",\"gender\":\"male\"}"},"http" => {"request" => {"body" => {"bytes" => "47"},"mime_type" => "application/x-www-form-urlencoded"},"method" => "POST","version" => "HTTP/1.1"},"gender" => "male","@version" => "1","@timestamp" => 2024-10-12T13:50:24.927146244Z,"host" => {"ip" => "11.0.1.10"}
}
4.3.2.4 从 Filebeat 读取数据
#filebeat配置
[root@kibana01 ~]#vim /etc/filebeat/filebeat.yml
filebeat.inputs:
- type: logenabled: truepaths:- /var/log/nginx/access_json.logjson.keys_under_root: true       # 将JSON键值提升到根级别json.overwrite_keys: true        # 如果键值存在,允许覆盖tags: ["nginx104-access"]        # 给日志打上标签,便于区分- type: logenabled: truepaths:- /var/log/nginx/error_json.logjson.keys_under_root: true       # 将JSON键值提升到根级别tags: ["nginx104-error"]         # 给日志打上标签,便于区分output.logstash:hosts: ["11.0.1.10:5044"]#logstash配置文件
root@logstash:~# vim /etc/logstash/conf.d/filebeat_to_stdout.confinput {beats {port => 5044}
}output {stdout {codec => rubydebug}
}#访问filebeat生成日志
#在logstash可以看到如下数据
[root@kibana01 ~]#while true ;do curl http://11.0.1.104/ && sleep 2;doneroot@logstash:~# /usr/share/logstash/bin/logstash -f /etc/logstash/conf.d/filebeat_to_stdout.conf -t
root@logstash:~# /usr/share/logstash/bin/logstash -f /etc/logstash/conf.d/filebeat_to_stdout.conf -r
{"ecs" => {"version" => "8.0.0"},"agent" => {"version" => "8.14.3","id" => "c5e80544-fb8d-4ec1-a3de-d954f88c429a","ephemeral_id" => "f3b623b5-06ff-4e79-99d2-bb1ac27f7b9f","name" => "kibana01.dinginx.org","type" => "filebeat"},"@timestamp" => 2024-10-12T14:32:52.000Z,"tags" => [[0] "nginx104-access",[1] "beats_input_raw_event"],"responsetime" => 0,"status" => "200","tcp_xff" => "","referer" => "","xff" => "","upstreamtime" => "","clientip" => "11.0.1.104","http_host" => "11.0.1.104","domain" => "11.0.1.104","http_user_agent" => "curl/7.68.0","host" => {"name" => "kibana01.dinginx.org"},"log" => {"offset" => 19904,"file" => {"path" => "/var/log/nginx/access_json.log"}},"size" => 49,"@version" => "1","upstreamhost" => "","input" => {"type" => "log"},"uri" => "/index.nginx-debian.html"
}
{"agent" => {"id" => "c5e80544-fb8d-4ec1-a3de-d954f88c429a","version" => "8.14.3","ephemeral_id" => "f3b623b5-06ff-4e79-99d2-bb1ac27f7b9f","name" => "kibana01.dinginx.org","type" => "filebeat"},"tags" => [[0] "nginx104-access",[1] "beats_input_raw_event"],"@timestamp" => 2024-10-12T14:33:57.000Z,"ecs" => {"version" => "8.0.0"},"status" => "404","responsetime" => 0,"tcp_xff" => "","referer" => "","xff" => "","upstreamtime" => "","clientip" => "11.0.1.104","http_host" => "11.0.1.104","domain" => "11.0.1.104","http_user_agent" => "curl/7.68.0","host" => {"name" => "kibana01.dinginx.org"},"log" => {"offset" => 26300,"file" => {"path" => "/var/log/nginx/access_json.log"}},"size" => 162,"@version" => "1","upstreamhost" => "","input" => {"type" => "log"},"uri" => "/index.html"
}
4.3.2.5 从 Redis 中读取数据
支持由多个 Logstash 从 Redis 读取日志,提高性能
Logstash 从 Redis 收集完数据后,将删除对应的列表Key
官方链接:
https://www.elastic.co/guide/en/logstash/current/plugins-inputs-redis.html
https://www.elastic.co/guide/en/logstash/7.6/plugins-inputs-redis.html
范例:
#filebeat配置
[root@kibana01 ~]#cat /etc/filebeat/filebeat.yml
# Filebeat Inputs
filebeat.inputs:
- type: logenabled: truepaths:- /var/log/nginx/access_json.logjson.keys_under_root: true       # 将JSON键值提升到根级别json.overwrite_keys: true        # 如果键值存在,允许覆盖tags: ["nginx104-access"]        # 给日志打上标签,便于区分- type: logenabled: truepaths:- /var/log/nginx/error_json.logjson.keys_under_root: true       # 将JSON键值提升到根级别tags: ["nginx104-error"]         # 给日志打上标签,便于区分# redis为标准输出
output.redis:hosts: ["11.0.1.10:6379"]key: "nginx104"password: "123456"db: "0"timeout: 5#redis数据验证
127.0.0.1:6379> KEYS *
1) "nginx104"
127.0.0.1:6379> LLEN nginx104
(integer) 24
127.0.0.1:6379> TYPE nginx104
list
127.0.0.1:6379> LINDEX nginx104 23
"{\"@timestamp\":\"2024-10-12T14:41:09.000Z\",\"@metadata\":{\"beat\":\"filebeat\",\"type\":\"_doc\",\"version\":\"8.14.3\"},\"http_host\":\"11.0.1.104\",\"upstreamhost\":\"\",\"uri\":\"/index.html\",\"upstreamtime\":\"\",\"input\":{\"type\":\"log\"},\"ecs\":{\"version\":\"8.0.0\"},\"host\":{\"name\":\"kibana01.dinginx.org\"},\"size\":162,\"responsetime\":0,\"log\":{\"file\":{\"path\":\"/var/log/nginx/access_json.log\"},\"offset\":41804},\"clientip\":\"11.0.1.104\",\"xff\":\"\",\"status\":\"404\",\"domain\":\"11.0.1.104\",\"tcp_xff\":\"\",\"referer\":\"\",\"http_user_agent\":\"curl/7.68.0\",\"tags\":[\"nginx104-access\"],\"agent\":{\"version\":\"8.14.3\",\"ephemeral_id\":\"87316aa0-0059-46f0-a0a9-5679cc5740a5\",\"id\":\"c5e80544-fb8d-4ec1-a3de-d954f88c429a\",\"name\":\"kibana01.dinginx.org\",\"type\":\"filebeat\"}}"
127.0.0.1:6379> LINDEX nginx104 22
"{\"@timestamp\":\"2024-10-12T14:41:07.000Z\",\"@metadata\":{\"beat\":\"filebeat\",\"type\":\"_doc\",\"version\":\"8.14.3\"},\"responsetime\":0,\"log\":{\"offset\":41500,\"file\":{\"path\":\"/var/log/nginx/access_json.log\"}},\"referer\":\"\",\"upstreamtime\":\"\",\"upstreamhost\":\"\",\"tags\":[\"nginx104-access\"],\"ecs\":{\"version\":\"8.0.0\"},\"domain\":\"11.0.1.104\",\"uri\":\"/index.html\",\"http_host\":\"11.0.1.104\",\"xff\":\"\",\"input\":{\"type\":\"log\"},\"agent\":{\"version\":\"8.14.3\",\"ephemeral_id\":\"87316aa0-0059-46f0-a0a9-5679cc5740a5\",\"id\":\"c5e80544-fb8d-4ec1-a3de-d954f88c429a\",\"name\":\"kibana01.dinginx.org\",\"type\":\"filebeat\"},\"status\":\"404\",\"host\":{\"name\":\"kibana01.dinginx.org\"},\"http_user_agent\":\"curl/7.68.0\",\"tcp_xff\":\"\",\"clientip\":\"11.0.1.104\",\"size\":162}"
127.0.0.1:6379> LINDEX nginx104 21
"{\"@timestamp\":\"2024-10-12T14:41:05.000Z\",\"@metadata\":{\"beat\":\"filebeat\",\"type\":\"_doc\",\"version\":\"8.14.3\"},\"tcp_xff\":\"\",\"domain\":\"11.0.1.104\",\"tags\":[\"nginx104-access\"],\"input\":{\"type\":\"log\"},\"ecs\":{\"version\":\"8.0.0\"},\"status\":\"404\",\"upstreamtime\":\"\",\"http_user_agent\":\"curl/7.68.0\",\"agent\":{\"version\":\"8.14.3\",\"ephemeral_id\":\"87316aa0-0059-46f0-a0a9-5679cc5740a5\",\"id\":\"c5e80544-fb8d-4ec1-a3de-d954f88c429a\",\"name\":\"kibana01.dinginx.org\",\"type\":\"filebeat\"},\"http_host\":\"11.0.1.104\",\"upstreamhost\":\"\",\"size\":162,\"responsetime\":0,\"referer\":\"\",\"uri\":\"/index.html\",\"log\":{\"file\":{\"path\":\"/var/log/nginx/access_json.log\"},\"offset\":41196},\"clientip\":\"11.0.1.104\",\"xff\":\"\",\"host\":{\"name\":\"kibana01.dinginx.org\"}}"
127.0.0.1:6379> LINDEX nginx104 20
"{\"@timestamp\":\"2024-10-12T14:41:03.000Z\",\"@metadata\":{\"beat\":\"filebeat\",\"type\":\"_doc\",\"version\":\"8.14.3\"},\"size\":162,\"upstreamtime\":\"\",\"upstreamhost\":\"\",\"http_host\":\"11.0.1.104\",\"referer\":\"\",\"status\":\"404\",\"http_user_agent\":\"curl/7.68.0\",\"tcp_xff\":\"\",\"tags\":[\"nginx104-access\"],\"xff\":\"\",\"log\":{\"file\":{\"path\":\"/var/log/nginx/access_json.log\"},\"offset\":40892},\"domain\":\"11.0.1.104\",\"clientip\":\"11.0.1.104\",\"responsetime\":0,\"uri\":\"/index.html\",\"input\":{\"type\":\"log\"},\"ecs\":{\"version\":\"8.0.0\"},\"agent\":{\"version\":\"8.14.3\",\"ephemeral_id\":\"87316aa0-0059-46f0-a0a9-5679cc5740a5\",\"id\":\"c5e80544-fb8d-4ec1-a3de-d954f88c429a\",\"name\":\"kibana01.dinginx.org\",\"type\":\"filebeat\"},\"host\":{\"name\":\"kibana01.dinginx.org\"}}"
127.0.0.1:6379> #logstash配置
root@logstash:~# cat /etc/logstash/conf.d/redis_to_stdout.conf
input {redis {host => "11.0.1.10"         # 这里填写 Redis 服务器的 IP 地址port => 6379               # Redis 默认端口password => "123456"        # Redis 的密码,如果没有密码认证,可以删除此行db => 0                    # 选择 Redis 数据库,0 为默认数据库data_type => "list"         # Redis 数据类型为 listkey => "nginx104"    # 从 Redis 的 list 中读取数据的 key}
}output {stdout {codec => rubydebug          # 使用 rubydebug 编解码器进行调试输出}
}root@logstash:~# /usr/share/logstash/bin/logstash -f /etc/logstash/conf.d/redis_to_stdout.conf -t
root@logstash:~# /usr/share/logstash/bin/logstash -f /etc/logstash/conf.d/redis_to_stdout.conf -t
#logstash显示如下{"input" => {"type" => "log"},"tags" => [[0] "nginx104-access"],"@timestamp" => 2024-10-12T14:49:23.000Z,"@version" => "1","xff" => "","status" => "404","agent" => {"id" => "c5e80544-fb8d-4ec1-a3de-d954f88c429a","version" => "8.14.3","type" => "filebeat","name" => "kibana01.dinginx.org","ephemeral_id" => "87316aa0-0059-46f0-a0a9-5679cc5740a5"},"http_host" => "11.0.1.104","ecs" => {"version" => "8.0.0"},"responsetime" => 0,"referer" => "","uri" => "/index.html","upstreamhost" => "","tcp_xff" => "","event" => {"original" => "{\"@timestamp\":\"2024-10-12T14:49:23.000Z\",\"@metadata\":{\"beat\":\"filebeat\",\"type\":\"_doc\",\"version\":\"8.14.3\"},\"log\":{\"file\":{\"path\":\"/var/log/nginx/access_json.log\"},\"offset\":70988},\"tcp_xff\":\"\",\"http_host\":\"11.0.1.104\",\"size\":162,\"host\":{\"name\":\"kibana01.dinginx.org\"},\"upstreamhost\":\"\",\"clientip\":\"11.0.1.104\",\"domain\":\"11.0.1.104\",\"responsetime\":0,\"status\":\"404\",\"ecs\":{\"version\":\"8.0.0\"},\"agent\":{\"version\":\"8.14.3\",\"ephemeral_id\":\"87316aa0-0059-46f0-a0a9-5679cc5740a5\",\"id\":\"c5e80544-fb8d-4ec1-a3de-d954f88c429a\",\"name\":\"kibana01.dinginx.org\",\"type\":\"filebeat\"},\"input\":{\"type\":\"log\"},\"http_user_agent\":\"curl/7.68.0\",\"referer\":\"\",\"upstreamtime\":\"\",\"xff\":\"\",\"uri\":\"/index.html\",\"tags\":[\"nginx104-access\"]}"},"log" => {"offset" => 70988,"file" => {"path" => "/var/log/nginx/access_json.log"}},"domain" => "11.0.1.104","host" => {"name" => "kibana01.dinginx.org"},"size" => 162,"clientip" => "11.0.1.104","upstreamtime" => "","http_user_agent" => "curl/7.68.0"
}
4.3.2.6 从 Kafka 中读取数据
官方链接:
https://www.elastic.co/guide/en/logstash/current/plugins-inputs-kafka.html
https://www.elastic.co/guide/en/logstash/7.6/plugins-inputs-kafka.html
# filebeat配置
[root@kibana01 ~]#vim /etc/filebeat/filebeat.yml
# Filebeat Inputs
filebeat.inputs:
- type: logenabled: truepaths:- /var/log/nginx/access_json.logjson.keys_under_root: true       # 将JSON键值提升到根级别json.overwrite_keys: true        # 如果键值存在,允许覆盖tags: ["nginx104-access"]        # 给日志打上标签,便于区分- type: logenabled: truepaths:- /var/log/nginx/error_json.logjson.keys_under_root: true       # 将JSON键值提升到根级别tags: ["nginx104-error"]         # 给日志打上标签,便于区分#output.logstash:#  hosts: ["11.0.1.1  0:5044"]# Kafka Output Configuration
output.kafka:hosts: ["11.0.1.11:9092", "11.0.1.12:9092", "11.0.1.13:9092"]  # Kafka broker 列表topic: filebeat104-log                                          # 指定 Kafka topicpartition.round_robin:reachable_only: true                                          # 仅发送到可用的分区required_acks: 1                                                # 等待主分区的确认compression: gzip                                               # 使用 gzip 压缩消息max_message_bytes: 11.0.10                                      # 每条消息最大1MB# logstash配置
root@logstash:~# cat /etc/logstash/conf.d/kafka_to_stdout.conf
input {kafka {# Kafka 集群的 broker 地址和端口bootstrap_servers => "11.0.1.11:9092,11.0.1.12:9092,11.0.1.11:9092"# 指定消费组 ID,所有相同 group_id 的消费者属于同一消费组group_id => "logstash"# 订阅的 Kafka 主题列表topics => ["filebeat104-log"]# 使用 JSON 编解码器解析消息codec => "json"# 使用的消费者线程数consumer_threads => 8}
}output {# 将结果输出到标准输出,并使用 rubydebug 编解码器格式化输出stdout {codec => rubydebug}
}
4.3.3 Logstash 过滤 Filter 插件
数据从源传输到存储库的过程中,Logstash 过滤器能够解析各个事件,识别已命名的字段以构建结构,并将它们转换成通用格式,以便进行更强大的分析和实现商业价值。
Logstash 能够动态地转换和解析数据,不受格式或复杂度的影响
常见的 Filter 插件:
- 利用 Grok 从非结构化数据中转化为结构数据
- 利用 GEOIP 根据 IP 地址找出对应的地理位置坐标
- 利用 useragent 从请求中分析操作系统、设备类型
- 简化整体处理,不受数据源、格式或架构的影响
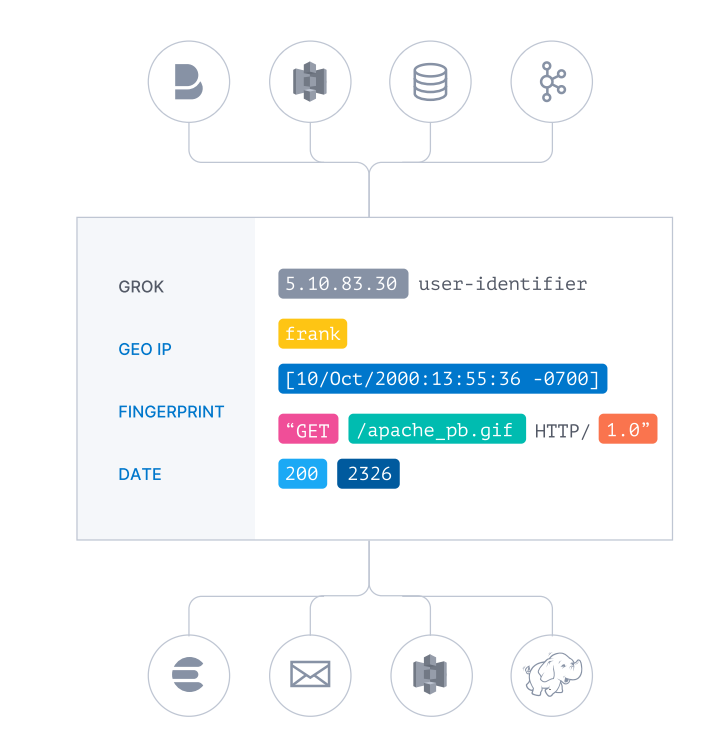
官方链接:
https://www.elastic.co/guide/en/logstash/current/filter-plugins.html
https://www.elastic.co/guide/en/logstash/7.6/filter-plugins.html
4.3.3.1 Grok 插件
4.3.3.1.1 Grok 介绍
Grok 是一个过滤器插件,可帮助您描述日志格式的结构。有超过200种 grok模式抽象概念,如IPv6地址,UNIX路径和月份名称。
为了将日志行与格式匹配, 生产环境常需要将非结构化的数据解析成 json 结构化数据格式
比如下面行:
2016-09-19T18:19:00 [8.8.8.8:prd] DEBUG this is an example log message
使用 Grok 插件可以基于正则表达式技术利用其内置的正则表达式的别名来表示和匹配上面的日志,如下效果
%{TIMESTAMP_ISO8601:timestamp} \[%{IPV4:ip};%{WORD:environment}\] %{LOGLEVEL:log_level} %{GREEDYDATA:message}
转化结果
{"timestamp": "2016-09-19T18:19:00","ip": "8.8.8.8","environment": "prd","log_level": "DEBUG","message": "this is an example log message"
}
参考网站
https://www.elastic.co/cn/blog/do-you-grok-grok
https://grokconstructor.appspot.com/
https://grokconstructor.appspot.com/do/match#result
范例: 利用 grokconstructor 网站将nginx日志自动生成grok的内置格式代码
#nginx服务log日志
root@logstash:~# cat /var/log/nginx/access.log
11.0.1.10 - - [14/Oct/2024:06:06:23 +0000] "GET / HTTP/1.1" 200 612 "-" "curl/7.81.0"#基于上面生成的代码转化为 Json 格式
%{COMBINEDAPACHELOG}
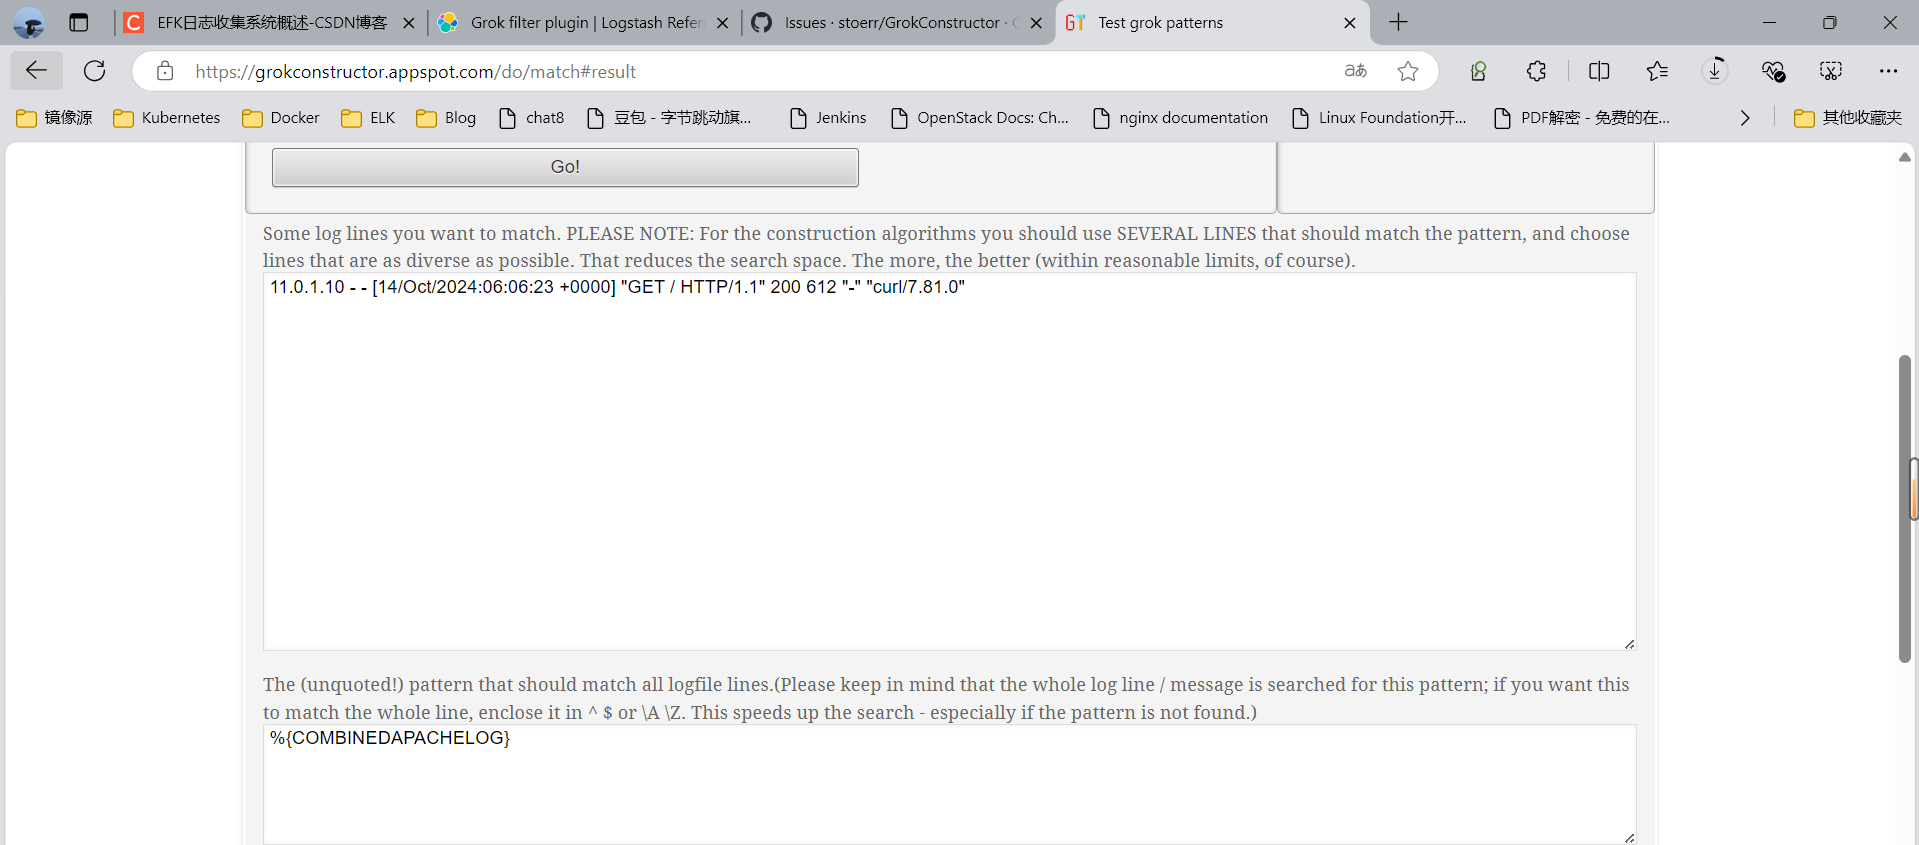
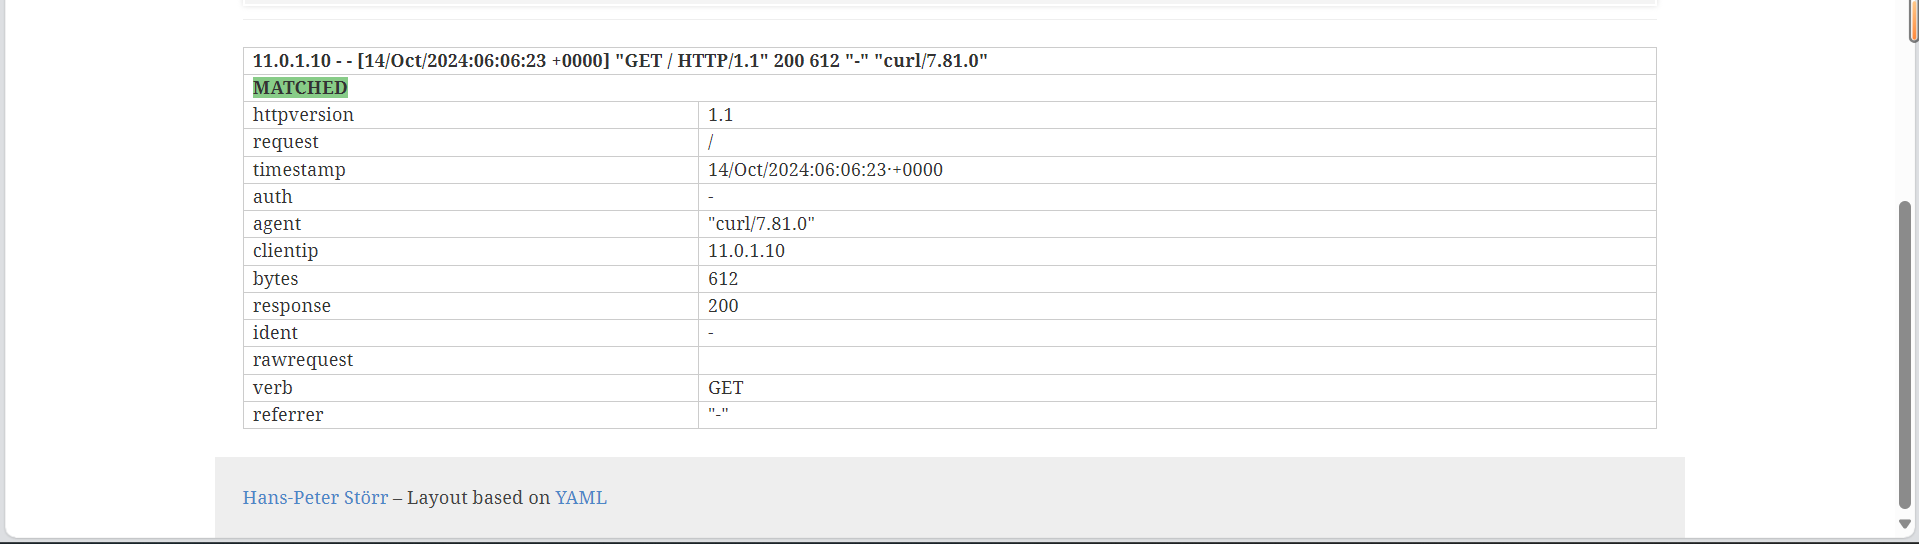
或者使作Kibana 实现上面功能
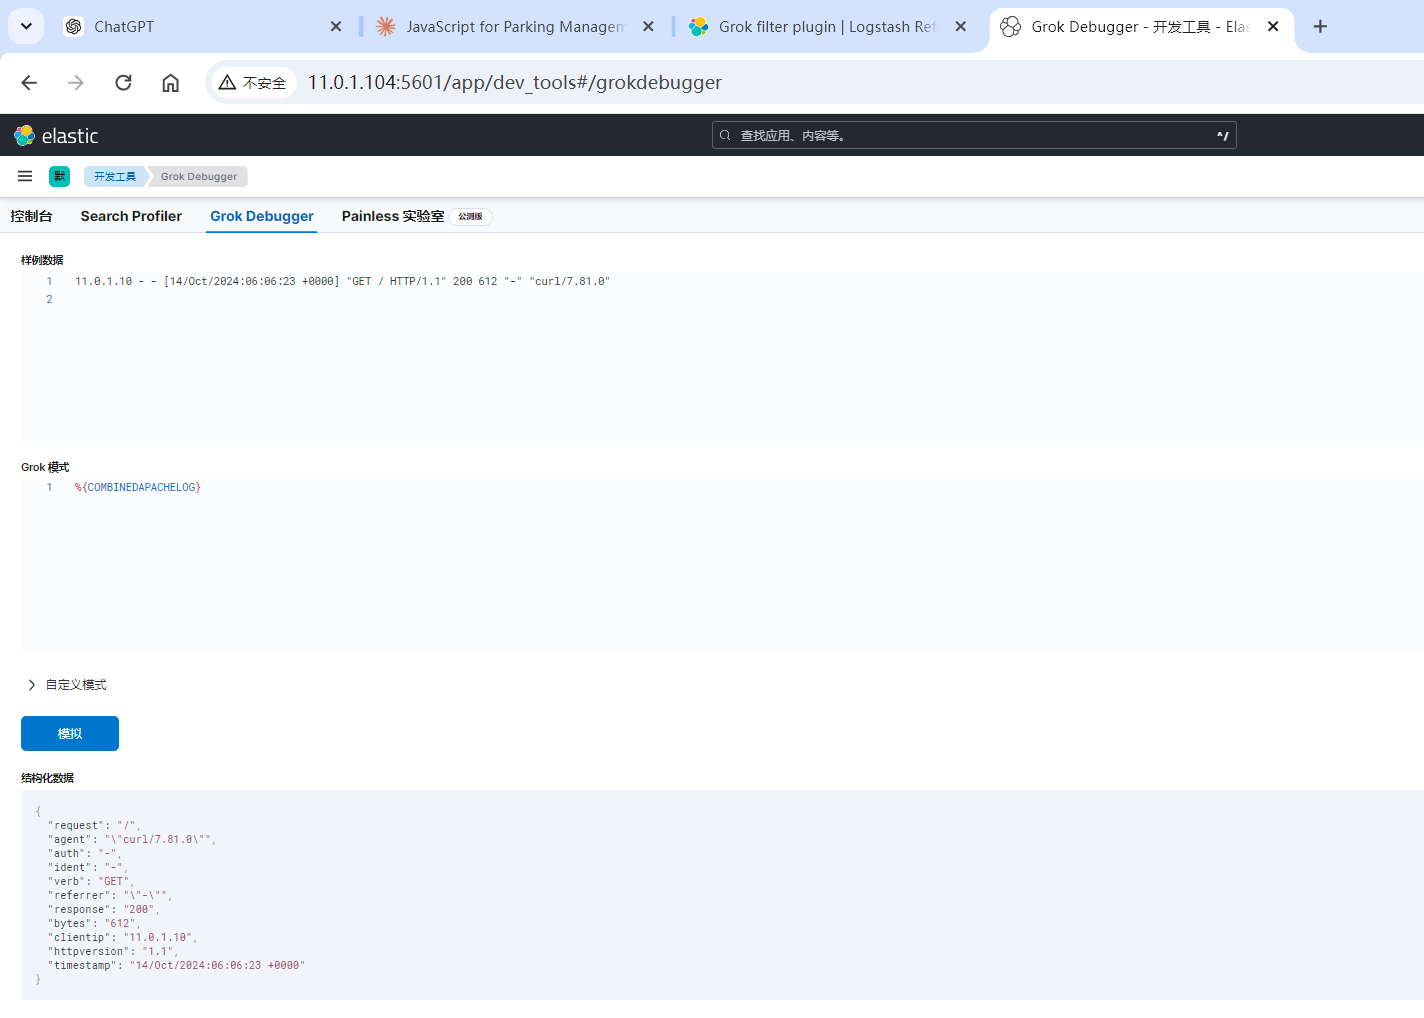
4.3.3.1.2 范例:使用 grok pattern 将 Nginx 日志格式化为 json 格式
#logstash配置文件
root@logstash:~# cat /etc/logstash/conf.d/http_to_stdout.conf # 输入部分:配置 Logstash 如何接收数据
input {http {port => 6666    # 指定 HTTP 服务器监听的端口codec => "json" # 指定输入数据的编码格式为 JSON}
}# 过滤器部分:定义如何处理和转换输入的数据
filter {grok {# 使用 grok 过滤器来解析日志消息# COMBINEDAPACHELOG 是一个预定义的 grok 模式,用于解析 Apache 组合日志格式match => {"message" => "%{COMBINEDAPACHELOG}"}}
}# 输出部分:定义处理后的数据要发送到哪里
output {stdout {# 将处理后的数据输出到标准输出(通常是控制台)codec => "rubydebug" # 使用 rubydebug 编码器来格式化输出,使其更易读}
}root@logstash:~# curl -XPOST -d'{ "name":"dinginx","age": "18","gender":"male","car":"mclaren"}'  http://11.0.1.10:6666#检查配置文件及运行
root@logstash:~# /usr/share/logstash/bin/logstash -f /etc/logstash/conf.d/http_to_stdout.conf -t
root@logstash:~# /usr/share/logstash/bin/logstash -f /etc/logstash/conf.d/http_to_stdout.conf -r
#logstash以下显示
{"car" => "mclaren","@version" => "1","user_agent" => {"original" => "curl/7.81.0"},"host" => {"ip" => "11.0.1.10"},"age" => "18","tags" => [[0] "_grokparsefailure"],"event" => {"original" => "{ \"name\":\"dinginx\",\"age\": \"18\",\"gender\":\"male\",\"car\":\"mclaren\"}"},"url" => {"domain" => "11.0.1.10","port" => 6666,"path" => "/"},"name" => "dinginx","@timestamp" => 2024-10-14T07:14:12.650480581Z,"gender" => "male","http" => {"method" => "POST","request" => {"mime_type" => "application/x-www-form-urlencoded","body" => {"bytes" => "63"}},"version" => "HTTP/1.1"}
}
范例: 直接将nginx的访问日志转化为Json格式
#logstash配置文件
root@logstash:~# cat /etc/logstash/conf.d/nginx_grok_stdout.conf
# 输入部分:从 Nginx 访问日志文件读取数据
input {file {path => "/var/log/nginx/access.log"  # Nginx 访问日志的路径type => "nginx-accesslog"            # 为这个输入源指定一个类型start_position => "beginning"        # 从文件开始处读取,适用于首次运行stat_interval => "3"                 # 每3秒检查一次文件是否有新内容# 添加以下行以处理文件轮转# sincedb_path => "/var/lib/logstash/sincedb_nginx_access"}
}# 过滤器部分:处理和转换输入的日志数据
filter {grok {match => { "message" => "%{COMBINEDAPACHELOG}" }# 添加自定义标签,以便于后续处理add_tag => [ "nginx", "accesslog" ]# 如果解析失败,添加一个 _grokparsefailure 标签tag_on_failure => [ "_grokparsefailure" ]}
}# 输出部分:将处理后的数据发送到标准输出
output {stdout {codec => rubydebug  # 使用 rubydebug 编码器美化输出}# 在实际应用中,你可能想要将数据发送到 Elasticsearch# elasticsearch {#   hosts => ["11.0.1.101:9200"]#   index => "nginx-access-%{+YYYY.MM.dd}"# }
}#检查配置文件及运行
root@logstash:~# /usr/share/logstash/bin/logstash -f /etc/logstash/conf.d/nginx_grok_stdout.conf -t
root@logstash:~# /usr/share/logstash/bin/logstash -f /etc/logstash/conf.d/nginx_grok_stdout.conf -r#logstash显示如下
{"message" => "11.0.1.10 - - [14/Oct/2024:07:26:05 +0000] \"GET / HTTP/1.1\" 200 612 \"-\" \"curl/7.81.0\"","http" => {"request" => {"method" => "GET"},"response" => {"status_code" => 200,"body" => {"bytes" => 612}},"version" => "1.1"},"user_agent" => {"original" => "curl/7.81.0"},"timestamp" => "14/Oct/2024:07:26:05 +0000","host" => {"name" => "logstash"},"@version" => "1","@timestamp" => 2024-10-14T07:26:07.032319410Z,"source" => {"address" => "11.0.1.10"},"url" => {"original" => "/"},"type" => "nginx-accesslog","log" => {"file" => {"path" => "/var/log/nginx/access.log"}},"tags" => [[0] "nginx",[1] "accesslog"],"event" => {"original" => "11.0.1.10 - - [14/Oct/2024:07:26:05 +0000] \"GET / HTTP/1.1\" 200 612 \"-\" \"curl/7.81.0\""}
}
4.3.3.2 Geoip 插件
geoip 根据 ip 地址提供的对应地域信息,比如:经纬度,国家,城市名等,以方便进行地理数据分析
范例:
root@logstash:~# cat /etc/logstash/conf.d/http_geoip_stdout.conf
# 输入部分:通过 HTTP 接收日志数据
input {http {port => 6666              # 指定 HTTP 服务器监听的端口# codec => "json"         # 取消注释此行,如果输入是 JSON 格式}
}# 过滤器部分:处理和转换日志数据
filter {# 将 Nginx 日志格式化为 JSON 格式,使用 Grok 解析日志grok {match => {"message" => "%{COMBINEDAPACHELOG}"  # 匹配 Nginx 的访问日志格式}}# 使用 GeoIP 插件获取客户端 IP 的地理位置信息geoip {source => "[source][address]"  # 适用于 8.x 版本,从提取的 IP 字段解析target => "geoip"              # 结果存储在 geoip 字段中}
}# 输出部分:将处理后的数据输出到控制台
output {stdout {codec => rubydebug             # 使用 rubydebug 美化输出,便于调试}
}#模拟测试数据
root@logstash:~# curl -XPOST -d '23.101.180.204 - - [28/Jun/2021:03:09:01 +0800] "POST //xmlrpc.php HTTP/1.1" 200 412 "-" "Mozilla/5.0 (Windows NT 6.1;
Win64; x64) AppleWebKit/537.36 (KHTML, like Gecko) Chrome/85.0.4183.102 Safari/537.36" "-" ' http://11.0.1.10:6666/#配置检查及运行
root@logstash:~# /usr/share/logstash/bin/logstash -f /etc/logstash/conf.d/http_geoip_stdout.conf -t
root@logstash:~# /usr/share/logstash/bin/logstash -f /etc/logstash/conf.d/http_geoip_stdout.conf -r#logstash显示以下内容
{"http" => {"method" => "POST","response" => {"status_code" => 200,"body" => {"bytes" => 412}},"request" => {"method" => "POST","mime_type" => "application/x-www-form-urlencoded","body" => {"bytes" => "211"}},"version" => [[0] "HTTP/1.1",[1] "1.1"]},"message" => "23.101.180.204 - - [28/Jun/2021:03:09:01 +0800] \"POST //xmlrpc.php HTTP/1.1\" 200 412 \"-\" \"Mozilla/5.0 (Windows NT 6.1; \nWin64; x64) AppleWebKit/537.36 (KHTML, like Gecko) Chrome/85.0.4183.102 Safari/537.36\" \"-\" ","user_agent" => {"original" => [[0] "curl/7.81.0",[1] "Mozilla/5.0 (Windows NT 6.1; \nWin64; x64) AppleWebKit/537.36 (KHTML, like Gecko) Chrome/85.0.4183.102 Safari/537.36"]},"timestamp" => "28/Jun/2021:03:09:01 +0800","@version" => "1","host" => {"ip" => "11.0.1.10"},"@timestamp" => 2024-10-14T11:28:52.833444553Z,"event" => {"original" => "23.101.180.204 - - [28/Jun/2021:03:09:01 +0800] \"POST //xmlrpc.php HTTP/1.1\" 200 412 \"-\" \"Mozilla/5.0 (Windows NT 6.1; \nWin64; x64) AppleWebKit/537.36 (KHTML, like Gecko) Chrome/85.0.4183.102 Safari/537.36\" \"-\" "},"source" => {"address" => "23.101.180.204"},"url" => {"original" => "//xmlrpc.php","domain" => "11.0.1.10","port" => 6666,"path" => "/"},"geoip" => {"geo" => {"region_name" => "Texas","country_iso_code" => "US","country_name" => "United States","continent_code" => "NA","postal_code" => "78288","location" => {"lon" => -98.4927,"lat" => 29.4227},"region_iso_code" => "US-TX","timezone" => "America/Chicago","city_name" => "San Antonio"},"ip" => "23.101.180.204","mmdb" => {"dma_code" => 641}}
}
范例: 只显示指定的geoip的字段信息
#logstash配置文件
root@logstash:/etc/logstash/conf.d# cat http_geoip_field_stdout.conf
# 输入部分:通过 HTTP 接收日志数据
input {http {port => 6666                  # 指定 HTTP 服务器监听的端口# codec => "json"             # 取消注释此行,如果输入是 JSON 格式}
}# 过滤器部分:处理和转换日志数据
filter {# 使用 Grok 解析 Nginx 日志,格式化为 JSON 格式grok {match => {"message" => "%{COMBINEDAPACHELOG}"  # 匹配 Nginx 的访问日志格式}}# 使用 GeoIP 插件获取客户端 IP 的地理位置信息geoip {source => "[source][address]"  # 从提取的 IP 字段解析,适用于 8.x 版本target => "geoip"              # 结果存储在 geoip 字段中fields => ["continent_code", "country_name", "city_name", "timezone", "longitude", "latitude"]  # 指定要提取的字段}
}# 输出部分:将处理后的数据输出到控制台
output {stdout {codec => rubydebug             # 使用 rubydebug 编码器美化输出,便于调试}
}#配置检查及运行
root@logstash~ # /usr/share/logstash/bin/logstash -f /etc/logstash/conf.d/http_geoip_field_stdout.conf -t
root@logstash~ # /usr/share/logstash/bin/logstash -f /etc/logstash/conf.d/http_geoip_field_stdout.conf -r#测试数据
root@logstash:/etc/logstash/conf.d# curl -XPOST -d '220.196.193.134 - - [28/Jun/2021:03:09:01 +0800] "POST //xmlrpc.php HTTP/1.1" 200 412 "-" "Mozilla/5.0 (Windows NT 6.1;
Win64; x64) AppleWebKit/537.36 (KHTML, like Gecko) Chrome/85.0.4183.102 Safari/537.36" "-" ' http://11.0.1.10:6666/#logstash显示如下内容
{"geoip" => {"geo" => {"location" => {"lon" => 121.4581,"lat" => 31.2222},"timezone" => "Asia/Shanghai","country_name" => "China","continent_code" => "AS","city_name" => "Shanghai"}},"@timestamp" => 2024-10-14T12:01:29.383266553Z,"@version" => "1","message" => "220.196.193.134 - - [28/Jun/2021:03:09:01 +0800] \"POST //xmlrpc.php HTTP/1.1\" 200 412 \"-\" \"Mozilla/5.0 (Windows NT 6.1; \nWin64; x64) AppleWebKit/537.36 (KHTML, like Gecko) Chrome/85.0.4183.102 Safari/537.36\" \"-\" ","host" => {"ip" => "11.0.1.10"},"user_agent" => {"original" => [[0] "curl/7.81.0",[1] "Mozilla/5.0 (Windows NT 6.1; \nWin64; x64) AppleWebKit/537.36 (KHTML, like Gecko) Chrome/85.0.4183.102 Safari/537.36"]},"event" => {"original" => "220.196.193.134 - - [28/Jun/2021:03:09:01 +0800] \"POST //xmlrpc.php HTTP/1.1\" 200 412 \"-\" \"Mozilla/5.0 (Windows NT 6.1; \nWin64; x64) AppleWebKit/537.36 (KHTML, like Gecko) Chrome/85.0.4183.102 Safari/537.36\" \"-\" "},"source" => {"address" => "220.196.193.134"},"url" => {"domain" => "11.0.1.10","port" => 6666,"original" => "//xmlrpc.php","path" => "/"},"timestamp" => "28/Jun/2021:03:09:01 +0800","http" => {"version" => [[0] "HTTP/1.1",[1] "1.1"],"response" => {"status_code" => 200,"body" => {"bytes" => 412}},"request" => {"body" => {"bytes" => "212"},"mime_type" => "application/x-www-form-urlencoded","method" => "POST"},"method" => "POST"}
}
4.3.3.3 Date 插件
Date插件可以将日志中的指定的日期字符串对应的源字段生成新的目标字段。
然后替换@timestamp 字段(此字段默认为当前写入logstash的时间而非日志本身的时间)或指定的其他字段。
match    #类型为数组,用于指定需要使用的源字段名和对应的时间格式
target   #类型为字符串,用于指定生成的目标字段名,默认是 @timestamp
timezone #类型为字符串,用于指定时区域
官方说明
https://www.elastic.co/guide/en/logstash/current/plugins-filters-date.html
时区格式参考
http://joda-time.sourceforge.net/timezones.html
范例: 利用源字段timestamp生成新的字段名access_time
root@logstash:~# cat /etc/logstash/conf.d/http_grok_date_stdout.conf
# 输入部分:定义 Logstash 将从哪里接收数据
input {http {port => 6666  # 在 6666 端口监听 HTTP 请求}
}# 过滤器部分:处理和转换传入的数据
filter {# 使用 COMBINEDAPACHELOG grok 模式解析传入的日志消息# 这个模式设计用于匹配标准的 Apache/Nginx 访问日志格式grok {match => { "message" => "%{COMBINEDAPACHELOG}" }}# 解析并标准化时间戳字段date {match => ["timestamp", "dd/MMM/yyyy:HH:mm:ss Z"]  # 指定传入时间戳的格式target => "access_time"  # 将解析后的时间戳存储在一个名为 'access_time' 的新字段中timezone => "Asia/Shanghai"  # 设置解析后时间戳的时区}# 移除处理后不再需要的字段mutate {remove_field => ["timestamp", "message"]  # 移除原始的时间戳和消息字段}
}# 输出部分:定义 Logstash 将把处理后的数据发送到哪里
output {stdout {codec => rubydebug  # 以可读格式将处理后的事件输出到标准输出}
}#测试数
root@logstash:~# curl -XPOST      -d '23.101.180.204 - - [28/Jun/2024:04:09:01 +0800] "POST //xmlrpc.php HTTP/1.1" 200 412 "-" "Mozilla/5.0 (Windows NT 6.1; Win64; x64) AppleWebKit/537.36 (KHTML, like Gecko) Chrome/85.0.4183.102 Safari/537.36" "-"'      http://11.0.1.10:6666root@logstash:/etc/logstash# /usr/share/logstash/bin/logstash -f /etc/logstash/conf.d/http_grok_date_stdout.conf -r#测试logstash页面显示
{"@timestamp" => 2024-10-18T04:43:28.015774331Z,"host" => {"ip" => "11.0.1.10"},"access_time" => 2024-06-27T20:09:01.000Z,"event" => {"original" => "23.101.180.204 - - [28/Jun/2024:04:09:01 +0800] \"POST //xmlrpc.php HTTP/1.1\" 200 412 \"-\" \"Mozilla/5.0 (Windows NT 6.1; Win64; x64) AppleWebKit/537.36 (KHTML, like Gecko) Chrome/85.0.4183.102 Safari/537.36\" \"-\""},"@version" => "1","url" => {"domain" => "11.0.1.10","port" => 6666,"original" => "//xmlrpc.php","path" => "/"},"source" => {"address" => "23.101.180.204"},"user_agent" => {"original" => [[0] "curl/7.81.0",[1] "Mozilla/5.0 (Windows NT 6.1; Win64; x64) AppleWebKit/537.36 (KHTML, like Gecko) Chrome/85.0.4183.102 Safari/537.36"]},"http" => {"version" => [[0] "HTTP/1.1",[1] "1.1"],"request" => {"body" => {"bytes" => "209"},"mime_type" => "application/x-www-form-urlencoded","method" => "POST"},"response" => {"status_code" => 200,"body" => {"bytes" => 412}},"method" => "POST"}
}
4.3.3.4 Useragent 插件
useragent 插件可以根据请求中的 user-agent 字段,解析出浏览器设备、操作系统等信息, 以方便后续的分析使用
范例:
okroot@logstash:~vim /etc/logstash/conf.d/http_grok_useragent_stdout.conf input {http {port => 6666}
}filter {#将nginx日志格式化为json格式grok {match => {"message" => "%{COMBINEDAPACHELOG}"}}#解析date日期如: 10/Dec/2020:10:40:10 +0800date {match => ["timestamp", "dd/MMM/yyyy:HH:mm:ss Z" ]target => "@timestamp"#target => "access_time"timezone => "Asia/Shanghai"}#提取agent字段,进行解析useragent {#source => "agent"        #7,X指定从哪个字段获取数据source => "message"        #8.X指定从哪个字段获取数据#source => "[user_agent][original]" #8.X指定从哪个字段获取数据target => "useragent" #指定生成新的字典类型的字段的名称,包括os,device等内容}
}output {stdout {codec => rubydebug}
}root@logstash:~# curl -X POST -d '112.13.112.30 - - [05/Jul/2023:19:48:03 +0000] "GET /wp-content/themes/dux/js/libs/ias.min.js?ver=THEME_VERSION HTTP/1.1" 200 1949 "https://www.wangxiaochun.com/" "Mozilla/5.0 (Linux; U; Android 11; zh-CN; Redmi K30 Pro Build/RKQ1.200826.002) AppleWebKit/537.36 (KHTML, like Gecko) Version/4.0 Chrome/78.0.3904.108 Quark/5.4.9.201 Mobile Safari/537.36"' http://11.0.1.10:6666root@logstash:~# /usr/share/logstash/bin/logstash -f /etc/logstash/conf.d/http_grok_useragent_stdout.conf #logstash显示以下内容
{"@version" => "1","message" => "112.13.112.30 - - [05/Jul/2024:19:48:03 +0000] \"GET /wp-content/themes/dux/js/libs/ias.min.js?ver=THEME_VERSION HTTP/1.1\" 200 1949 \"https://www.wangxiaochun.com/\" \"Mozilla/5.0 (Linux; U; Android 11; zh-CN; Redmi K30 Pro Build/RKQ1.200826.002) AppleWebKit/537.36 (KHTML, like Gecko) Version/4.0 Chrome/78.0.3904.108 Quark/5.4.9.201 Mobile Safari/537.36\"","user_agent" => {"original" => [[0] "curl/7.81.0",[1] "Mozilla/5.0 (Linux; U; Android 11; zh-CN; Redmi K30 Pro Build/RKQ1.200826.002) AppleWebKit/537.36 (KHTML, like Gecko) Version/4.0 Chrome/78.0.3904.108 Quark/5.4.9.201 Mobile Safari/537.36"]},"useragent" => {"os" => {"full" => "Android 11","name" => "Android","version" => "11"},"device" => {"name" => "XiaoMi Redmi K30 Pro"},"name" => "Chrome Mobile WebView","version" => "78.0.3904.108"},"event" => {"original" => "112.13.112.30 - - [05/Jul/2024:19:48:03 +0000] \"GET /wp-content/themes/dux/js/libs/ias.min.js?ver=THEME_VERSION HTTP/1.1\" 200 1949 \"https://www.wangxiaochun.com/\" \"Mozilla/5.0 (Linux; U; Android 11; zh-CN; Redmi K30 Pro Build/RKQ1.200826.002) AppleWebKit/537.36 (KHTML, like Gecko) Version/4.0 Chrome/78.0.3904.108 Quark/5.4.9.201 Mobile Safari/537.36\""},"host" => {"ip" => "11.0.1.10"},"http" => {"response" => {"status_code" => 200,"body" => {"bytes" => 1949}},"method" => "POST","request" => {"mime_type" => "application/x-www-form-urlencoded","referrer" => "https://www.wangxiaochun.com/","body" => {"bytes" => "352"},"method" => "GET"},"version" => [[0] "HTTP/1.1",[1] "1.1"]},"url" => {"domain" => "11.0.1.10","port" => 6666,"path" => "/","original" => "/wp-content/themes/dux/js/libs/ias.min.js?ver=THEME_VERSION"},"source" => {"address" => "112.13.112.30"},"timestamp" => "05/Jul/2024:19:48:03 +0000","@timestamp" => 2024-07-05T19:48:03.000Z
}
4.3.3.5 Mutate 插件
官方链接:
https://www.elastic.co/guide/en/logstash/master/plugins-filters-mutate.html
https://www.elastic.co/guide/en/logstash/7.6/plugins-filters-mutate.html
Mutate 插件主要是对字段进行、类型转换、删除、替换、更新等操作,可以使用以下函数
remove_field    #删除字段
split           #字符串切割,相当于awk取列
add_field       #添加字段
convert         #类型转换,支持的数据类型:integer,integer_eu,float,float_eu,
string,boolean
gsub            #字符串替换
rename          #字符串改名
lowercase       #转换字符串为小写
4.3.3.5.1 remove_field 删除字段
#logstash配置文件
root@logstash:/etc/logstash/conf.d# vim http_grok_mutate_remove_field_stdout.conf input {http {port =>6666}
}filter {#将nginx日志格式化为json格式grok {match => {"message" => "%{COMBINEDAPACHELOG}"}}#解析date日期如: 10/Dec/2020:10:40:10 +0800date {match => ["timestamp", "dd/MMM/yyyy:HH:mm:ss Z" ]target => "@timestamp"#target => "access_time"timezone => "Asia/Shanghai"}#mutate 删除指定字段的操作mutate {#remove_field => ["headers","message", "agent"]  #7.Xremove_field => ["timestamp","message", "http","original"] #8.X}
}output {stdout {codec => rubydebug}
}root@logstash:/etc/logstash/conf.d# /usr/share/logstash/bin/logstash -f /etc/logstash/conf.d/http_grok_mutate_remove_field_stdout.conf  -r		#执行前进行-t 检查#logstash界面显示{"@version" => "1","event" => {"original" => ""},"url" => {"domain" => "11.0.1.10","port" => 6666,"path" => "/?112.13.112.30%20-%20-%20%5B05%2FJul%2F2024=19%3A48%3A03%20%2B0000%5D%20%22GET%20%2Fwp-content%2Fthemes%2Fdux%2Fjs%2Flibs%2Fias.min.js%3Fver%3DTHEME_VERSION%20HTTP%2F1.1%22%20200%201949%20%22https%3A%2F%2Fwww.wangxiaochun.com%2F%22%20%22Mozilla%2F5.0%20(Linux%3B%20U%3B%20Android%2011%3B%20zh-CN%3B%20Redmi%20K30%20Pro%20Build%2FRKQ1.200826.002)%20AppleWebKit%2F537.36%20(KHTML,%20like%20Gecko)%20Version%2F4.0%20Chrome%2F78.0.3904.108%20Quark%2F5.4.9.201%20Mobile%20Safari%2F537.36%22"},"tags" => [[0] "_grokparsefailure"],"@timestamp" => 2024-10-26T02:30:08.600091497Z,"host" => {"ip" => "11.0.1.99"}
}
4.3.3.5.2 Split 切割
4.3.3.5.3 add_field 添加字段
5.5.3.5.4 convert 转换
4.3.3.6 条件判断
Filter 语句块中支持 if 条件判断功能
4.3.4 Logstash 输出 Output 插件
官方链接
https://www.elastic.co/guide/en/logstash/8.14/output-plugins.html
4.3.4.1 Stdout 插件
stdout 插件将数据输出到屏幕终端,主要用于调试
output {stdout {codec => rubydebug}
}
4.3.4.2 File 插件
输出到文件,可以将分散在多个文件的数据统一存放到一个文件
示例: 将所有 web 机器的日志收集到一个文件中,从而方便统一管理
output {stdout {codec => rubydebug}file {path => "/var/log/test.log"}
}
root@logstash:~# /usr/share/logstash/bin/logstash -e 'input { stdin { codec => "json" } } output { file { path => "/tmp/logstash.log" } }'......hello dinginx 	#输入内容#查看目标路径文件内容
root@logstash:/etc/logstash/conf.d# cat /tmp/logstash.log
{"@timestamp":"2024-10-26T02:48:32.473094479Z","message":"hello dinginx","tags":["_jsonparsefailure"],"@version":"1","event":{"original":"hello dinginx\n"},"host":{"hostname":"logstash"}}
4.3.4.3 Elasticsearch 插件
官方说明
https://www.elastic.co/guide/en/logstash/8.14/output-plugins.html
索引的时间格式说明
https://www.joda.org/joda-time/apidocs/org/joda/time/format/DateTimeFormat.html
当日志量较小时,可以按月或周生成索引,当日志量比较大时,会按天生成索引,以方便后续按天删除
output {elasticsearch {hosts => ["11.0.1.101:9200","11.0.1.102:9200","11.0.1.103:9200"   # 一般写 ES 中 data 节点地址]index => "app-%{+YYYY.MM.dd}"  # 指定索引名称,建议加时间,按天建立索引# index => "%{[@metadata][target_index]}"  # 使用字段 [@metadata][target_index] 值作为索引名template_overwrite => true      # 覆盖索引模板,此项可选,默认值为 false}
}
注意: 索引名必须为小写
范例: 将标准输入输出到 elasticsearch
root@logstash:~# /usr/share/logstash/bin/logstash -e '
input {stdin {codec => "json"}
}
output { elasticsearch {hosts => ["11.0.1.101:9200"] index => "dinginxtest-%{+YYYY.MM.dd}" }
}'#输入内容
dinginxtest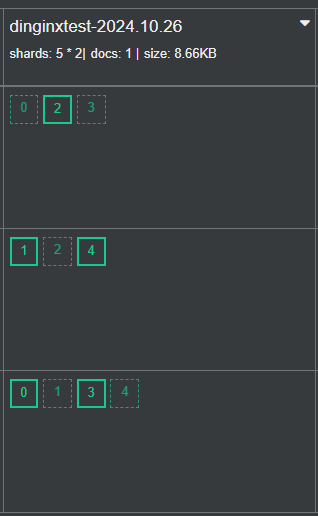
范例:将文件输出至 Elasticsearch
root@logstash:~# /usr/share/logstash/bin/logstash -e '
input {file {path => "/var/log/bootstrap.log"start_position => "beginning"stat_interval => 3}
}
output { elasticsearch {hosts => ["11.0.1.101:9200"]index => "logfile-%{+YYYY.MM.dd}"}
}'
通过cerebro插件可以看到下面信息
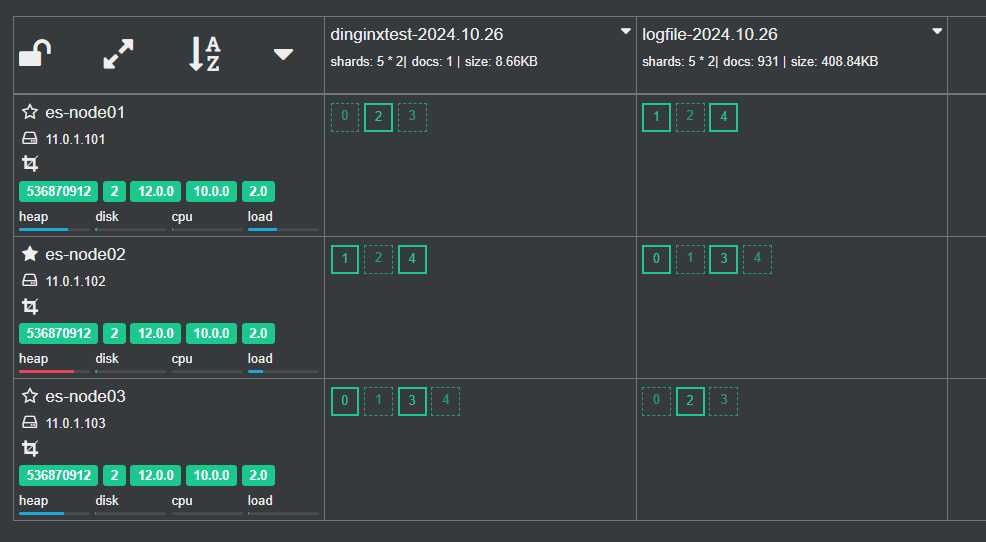
#测试数据
root@logstash:/etc/logstash/conf.d# echo 'welcome to dinginx' >> /var/log/bootstrap.log
菜单 → Stack Management → Kibana(数据视图)→ 创建数据视图(名为logfile) → discover展示
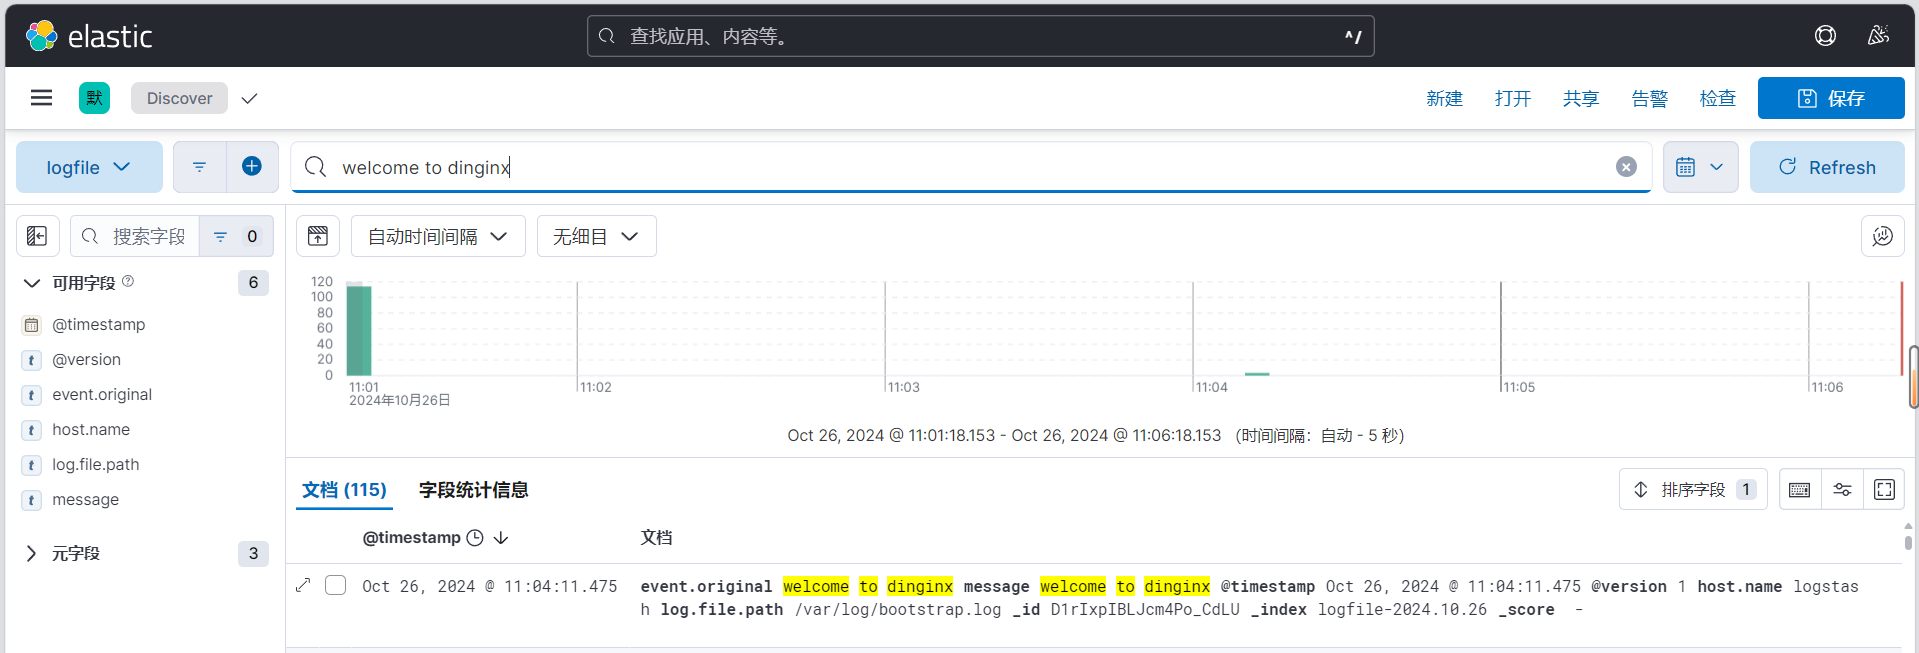
4.3.4.4 Redis 插件
Logstash 支持将日志转发至 Redis
官方链接:
https://www.elastic.co/guide/en/logstash/8.14/plugins-outputs-redis.html
范例:
input {file {path => "/var/log/nginx/access.log"type => "nginx-accesslog"start_position => "beginning"stat_interval => 3codec => "json"}
}output {if [type] == "nginx-accesslog" {redis {host => "11.0.1.10"port => 6379password => "123456"db => 0data_type => "list"key => "nginx-accesslog"}}
}
4.4 Logstash 实战案例
4.4.1 收集单个系统日志并输出至 Elasticsearch
前提需要logstash用户对被收集的日志文件有读的权限并对写入的文件有写权限
Logstash配置文件
root@logstash:/etc/logstash/conf.d# cat log_to_es.conf
input {file {path => "/var/log/dpkg.log"start_position => "beginning"stat_interval => 3}
}
output {elasticsearch {hosts => ["11.0.1.101:9200"]index => "dpkg-%{+YYYY.MM.dd}"}
}
通过cerebro插件可以看到下面信息
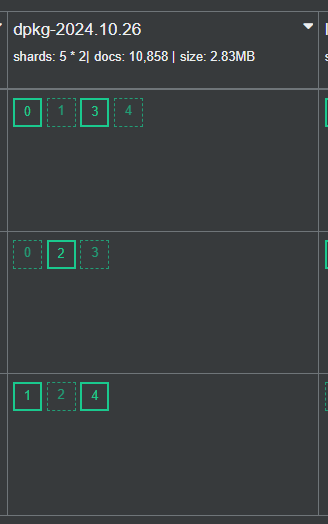
菜单 → Stack Management → Kibana(数据视图)→ 创建数据视图(名为dpkg) → discover展示
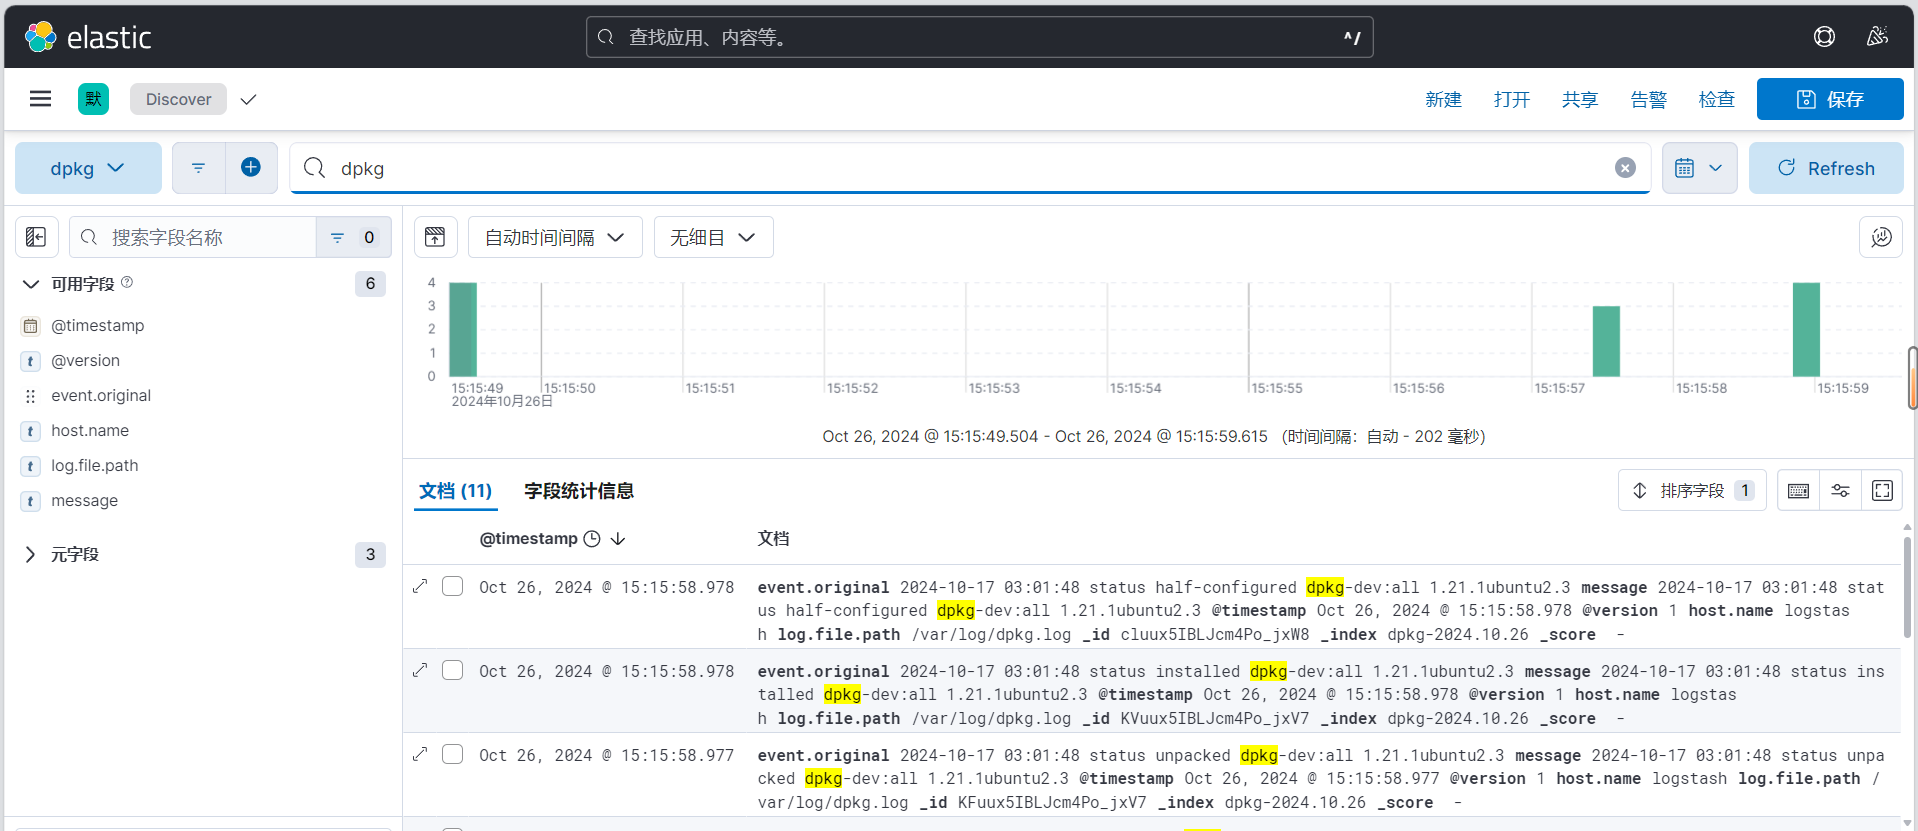
4.4.2 通过 Logstash 收集多个日志文件并输出至 Elasticsearch
4.4.2.1 服务器部署 Tomcat 服务
安装 Java 环境并且通过一个 Web 界面进行访问测试
4.4.2.1.1 配置 Java 环境并部署 Tomcat
[root@web-server ~]#wget https://dlcdn.apache.org/tomcat/tomcat-9/v9.0.96/bin/apache-tomcat-9.0.96.tar.gz
[root@web-server ~]#ls /apps/apache-tomcat-9.0.59.tar.gz  -l
-rw-r--r-- 1 root root 11543067 May 11  2022 /apps/apache-tomcat-9.0.59.tar.gz
[root@web-server /apps]#tar zxf apache-tomcat-9.0.59.tar.gz
[root@web-server /apps]#ln -s apache-tomcat-9.0.59 tomcat
[root@web-server /apps]#tomcat/bin/startup.sh
[root@web-server /apps]#ss -ntl|grep 8080
LISTEN  0       100                       *:8080               *:*
生成访问日志
[root@web-server ~]#ls /apps/tomcat/logs/ -l
total 80
-rw-r----- 1 root root 33029 Oct 26 17:48 catalina.2024-10-26.log
-rw-r----- 1 root root 33029 Oct 26 17:48 catalina.out
-rw-r----- 1 root root     0 Oct 26 17:47 host-manager.2024-10-26.log
-rw-r----- 1 root root  2354 Oct 26 17:48 localhost.2024-10-26.log
-rw-r----- 1 root root  1759 Oct 26 17:58 localhost_access_log.2024-10-26.txt
-rw-r----- 1 root root     0 Oct 26 17:47 manager.2024-10-26.log
4.4.2.2 Logstash配置
input {file {path => "/var/log/syslog"		#日志路径start_position => "beginning"	#第一次收集日志的位置stat_interval => 3				#日志收集的间隔时间type => "syslog"				#事件的唯一类型,可用于区分不同日志,分别存于不同index}file {path => "/var/log/dpkg.log"			#日志路径start_position => "beginning"		#第一次收集日志的位置stat_interval => 3					#日志收集的间隔时间type => "dpkg"						#事件的唯一类型}
}output {if [type] == "syslog" {elasticsearch {hosts => ["11.0.1.101:9200"]index => "syslog-%{+YYYY.MM.dd}"}}if [type] == "dpkg" {elasticsearch {hosts => ["11.0.1.101:9200"]index => "dpkg-%{+YYYY.MM.dd}"}}
}
通过cerebro插件可以看到下面信息
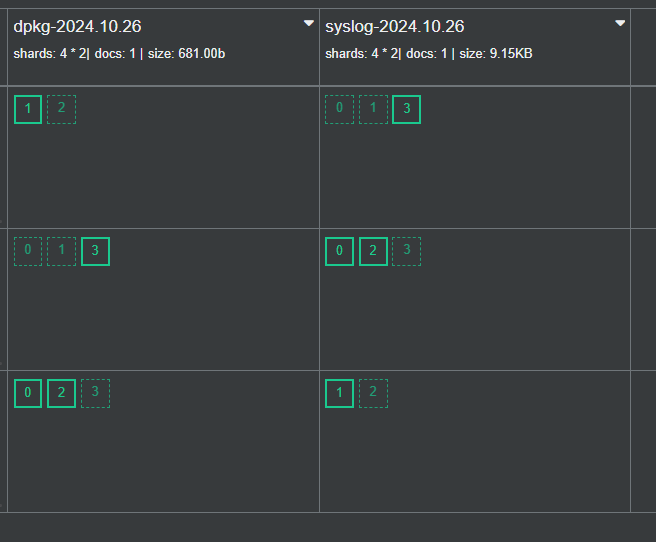
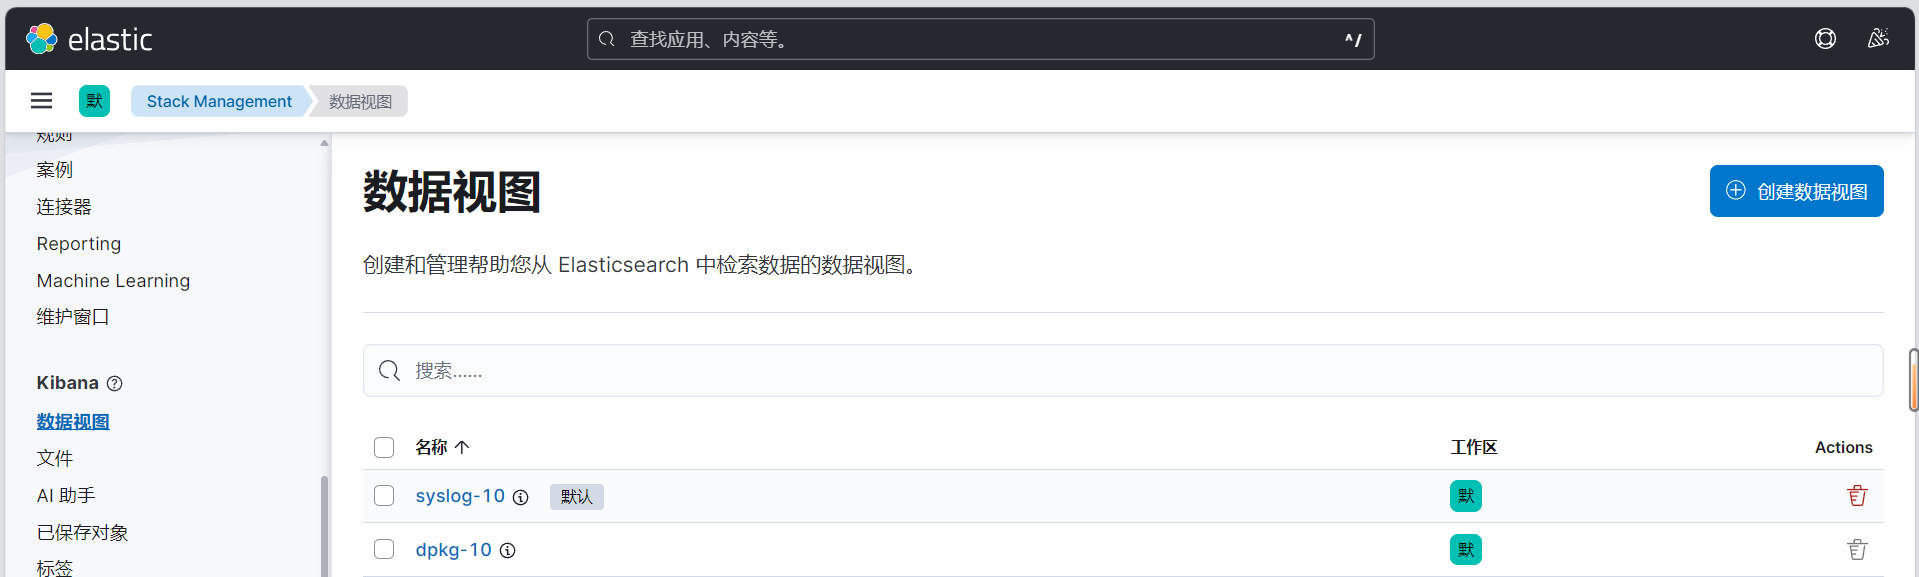
4.4.3 通过 Logstash 收集 Tomcat 和 Java 日志并输出至Elasticsearch
每台Tomcat服务器要安装logstash负责收集Tomcat服务器的访问日志和错误日志进行实时统计,然后将日志转发给Elasticsearch进行分析,最终利用 Kibana 在前端展现
4.4.3.1 服务器部署 Tomcat 服务
需要安装 Java 环境,并自定义一个 Web 界面进行测试。
4.4.3.1.1 配置 Java 环境并部署 Tomcat
#先安装JDK,因为logstash已经安装JDK,此步不用执行
[root@web-server ~]#wget https://dlcdn.apache.org/tomcat/tomcat-9/v9.0.96/bin/apache-tomcat-9.0.96.tar.gz
[root@web-server ~]#ls /apps/apache-tomcat-9.0.59.tar.gz  -l
-rw-r--r-- 1 root root 11543067 May 11  2022 /apps/apache-tomcat-9.0.59.tar.gz
[root@web-server /apps]#tar zxf apache-tomcat-9.0.59.tar.gz
[root@web-server /apps]#ln -s apache-tomcat-9.0.59 tomcat
[root@web-server /apps]#tomcat/bin/startup.sh
[root@web-server /apps]#ss -ntl|grep 8080
LISTEN  0       100                       *:8080               *:*
4.4.3.1.2 确认 Web 可以访问
用浏览器访问 tomcat
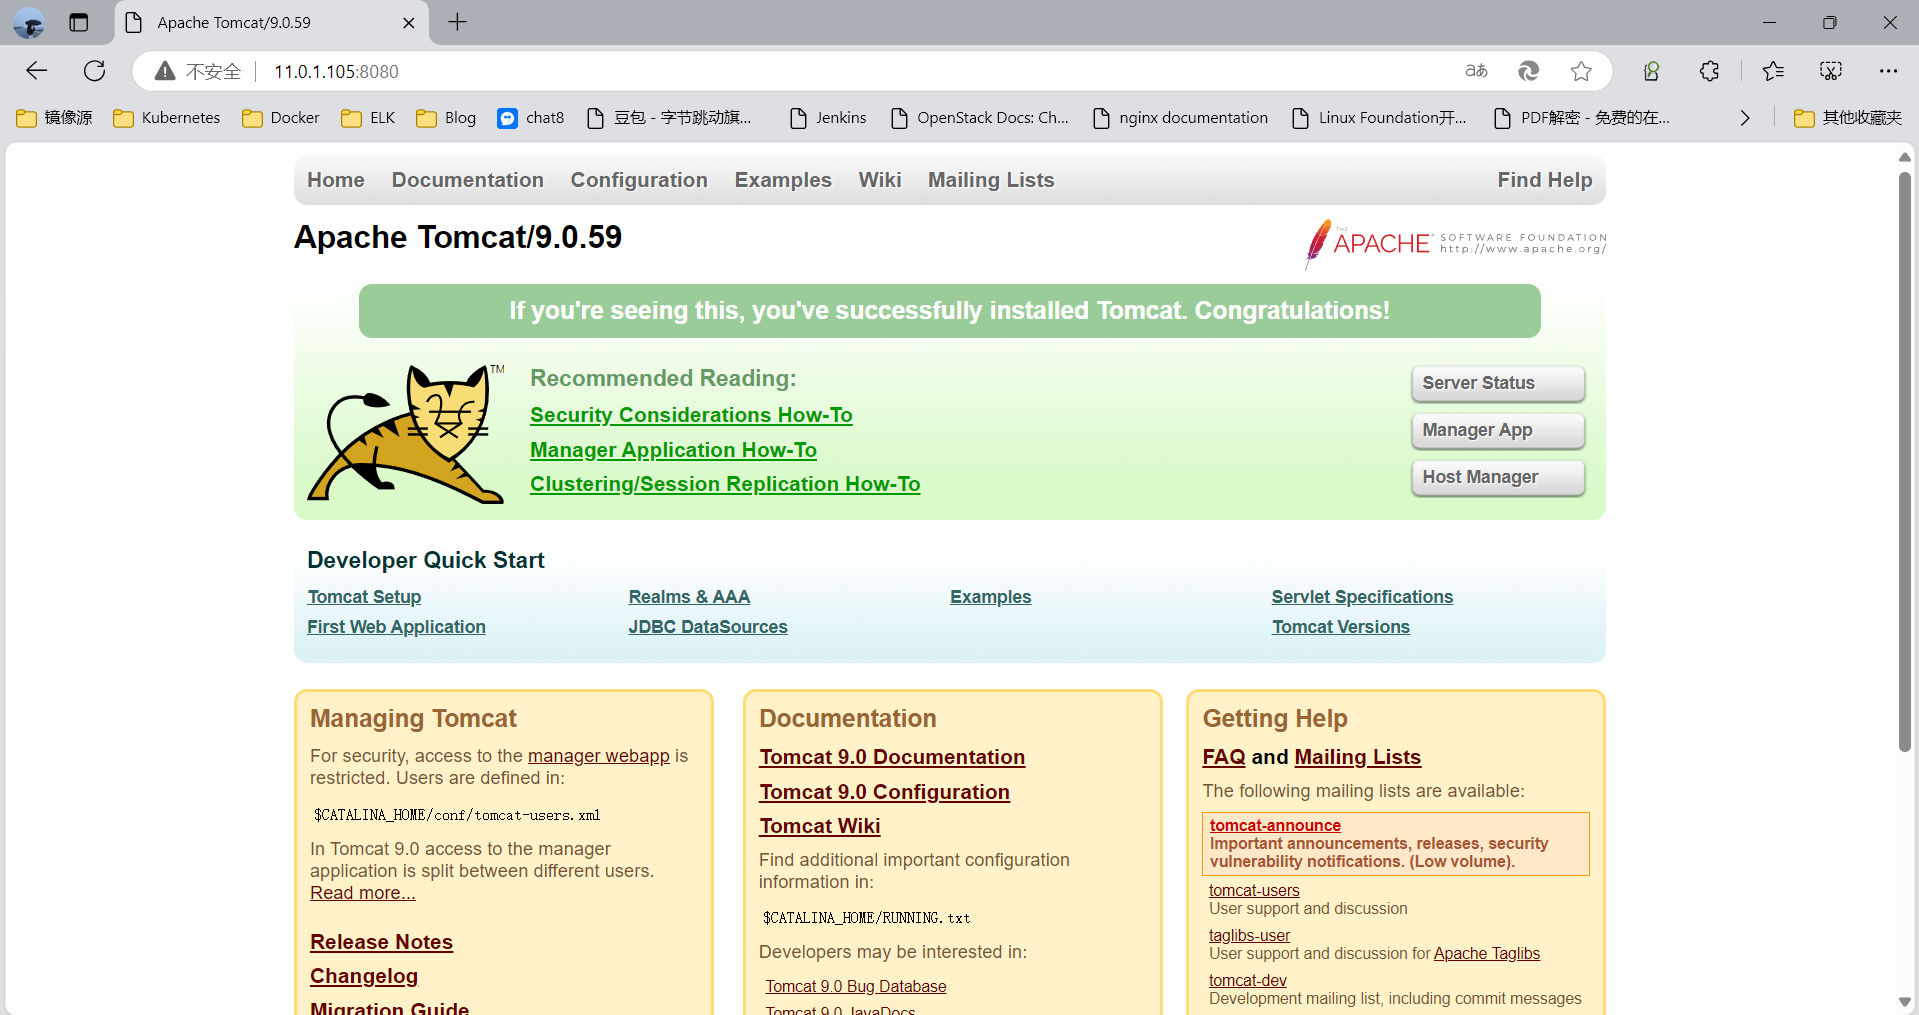
4.4.3.1.3 Tomcat 日志转为 Json 格式
#参考文档:
http://tomcat.apache.org/tomcat-9.0-doc/config/valve.html#Access_Logging#调整日志格式为 json,方便后期 Elasticsearch 分析使用
root@logstash:/usr/local/tomcat# vim conf/server.xml ......<Host name="www.dinginx.top" appBase="/data/myapp"unpackWARs="true" autoDeploy="true"><Valve className="org.apache.catalina.valves.AccessLogValve"directory="logs"prefix="myapp_access_log"suffix=".txt"pattern="{"clientip":"%h","ClientUser":"%l","authenticated":"%u","AccessTime":"%t","method":"%r","status":"%s","SendBytes":"%b","QueryString":"%q","partner":"%{Referer}i","AgentVersion":"%{User-Agent}i"}"/></Host>......#验证日志数据
root@logstash:/usr/local/tomcat# tail -f /usr/local/tomcat/logs/myapp_access_log.2024-11-04.txt {"clientip":"11.0.1.99","ClientUser":"-","authenticated":"-","AccessTime":"[04/Nov/2024:09:04:38 +0000]","method":"GET / HTTP/1.1","status":"304","SendBytes":"-","QueryString":"","partner":"-","AgentVersion":"Mozilla/5.0 (Windows NT 10.0; Win64; x64) AppleWebKit/537.36 (KHTML, like Gecko) Chrome/129.0.0.0 Safari/537.36 Edg/129.0.0.0"}
{"clientip":"11.0.1.99","ClientUser":"-","authenticated":"-","AccessTime":"[04/Nov/2024:09:04:39 +0000]","method":"GET / HTTP/1.1","status":"304","SendBytes":"-","QueryString":"","partner":"-","AgentVersion":"Mozilla/5.0 (Windows NT 10.0; Win64; x64) AppleWebKit/537.36 (KHTML, like Gecko) Chrome/129.0.0.0 Safari/537.36 Edg/129.0.0.0"}
{"clientip":"11.0.1.99","ClientUser":"-","authenticated":"-","AccessTime":"[04/Nov/2024:09:04:39 +0000]","method":"GET / HTTP/1.1","status":"304","SendBytes":"-","QueryString":"","partner":"-","AgentVersion":"Mozilla/5.0 (Windows NT 10.0; Win64; x64) AppleWebKit/537.36 (KHTML, like Gecko) Chrome/129.0.0.0 Safari/537.36 Edg/129.0.0.0"}
{"clientip":"11.0.1.99","ClientUser":"-","authenticated":"-","AccessTime":"[04/Nov/2024:09:04:39 +0000]","method":"GET / HTTP/1.1","status":"304","SendBytes":"-","QueryString":"","partner":"-","AgentVersion":"Mozilla/5.0 (Windows NT 10.0; Win64; x64) AppleWebKit/537.36 (KHTML, like Gecko) Chrome/129.0.0.0 Safari/537.36 Edg/129.0.0.0"}
4.4.3.1.4 验证日志是否 Json 格式
利用json网站工具验证 json 格式
https://www.sojson.com/
http://www.kjson.com/
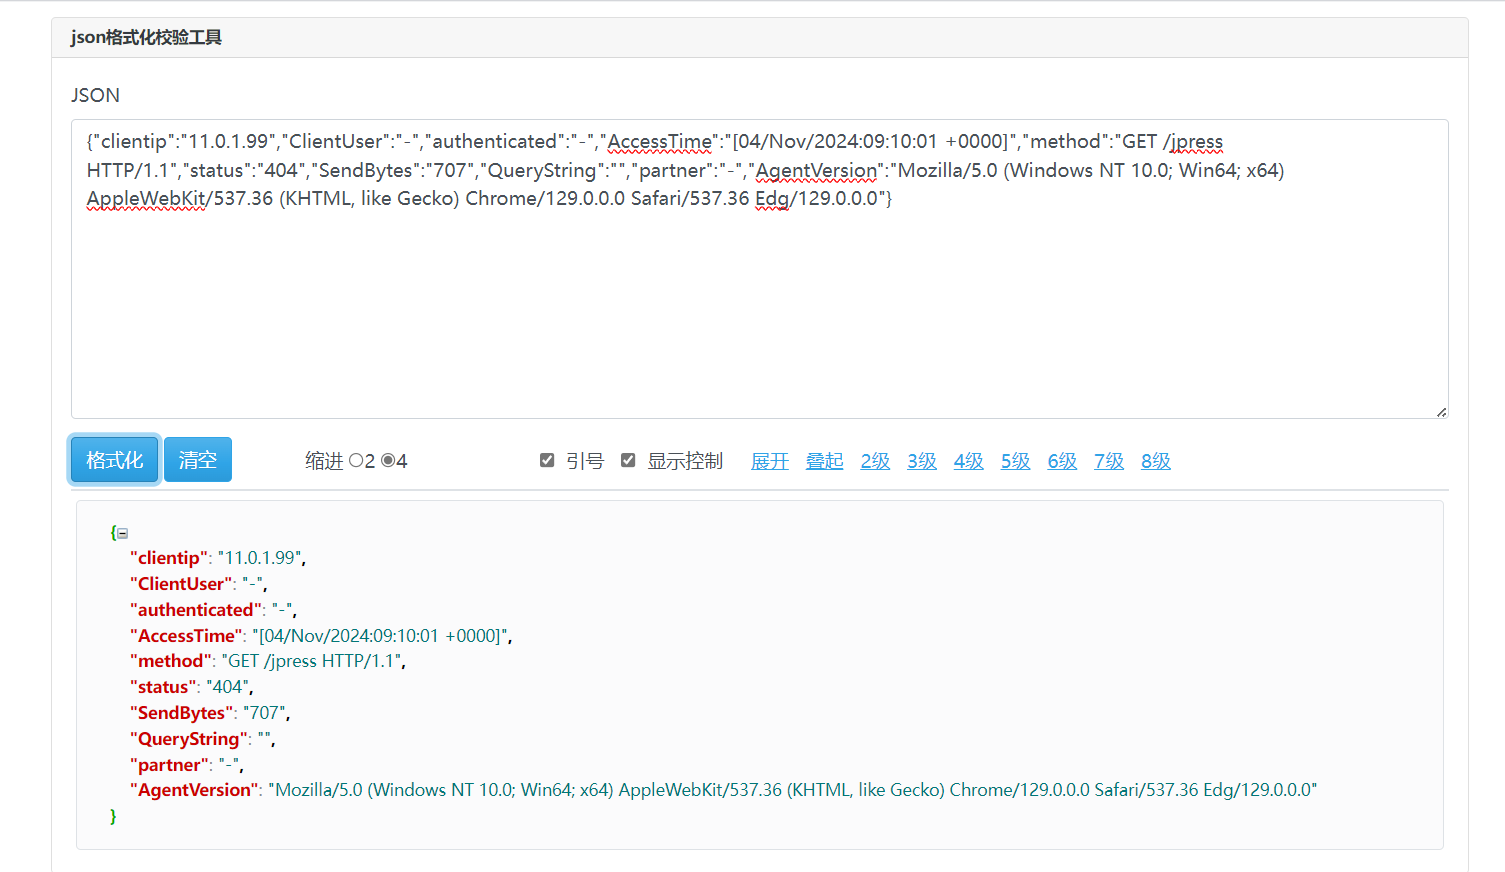
4.4.3.1.5 利用 Python 脚本获取日志行中的 IP
root@logstash:/usr/local/tomcat# vim get_status.py#!/usr/bin/python3
# coding:utf-8import jsonstatus_200 = []
status_404 = []# 读取日志文件
with open("access_json.log") as f:for line in f:try:# 使用 json.loads() 解析 JSON 字符串log_entry = json.loads(line)client_ip = log_entry.get("clientip")print(client_ip)# 根据状态码分类if log_entry.get("status") == "200":status_200.append(log_entry)elif log_entry.get("status") == "404":status_404.append(log_entry)else:print("状态码 ERROR:", log_entry.get("status"))except json.JSONDecodeError:print("解析 JSON 时出错:", line.strip())# 打印状态码统计
print("状态码200的有--:", len(status_200))
print("状态码404的有--:", len(status_404))
4.4.3.2 在 Tomcat 服务器安装 Logstash 收集 Tomcat和系统日志
需要部署tomcat并安装配置 logstash
4.4.3.2.1 安装配置 Logstash
注:注意索引模板,默认tomcat有索引模板,如不使用请加上template_overwrite => true,或不以tomcat-开头
input {# 输入syslog文件file {path => "/usr/local/tomcat/logs/myapp_access_log.*.txt"start_position => "beginning"stat_interval => "3"type => "tomcataccesslog"   # 为syslog文件指定typecodec => "json"}# 输入dpkg文件file {path => "/var/log/dpkg.log"start_position => "beginning"stat_interval => "3"type => "dpkg"     # 为dpkg文件指定type}
}output {# 如果type是syslog,则将日志输出到syslog索引if [type] == "tomcataccesslog" {elasticsearch {hosts => ["11.0.1.101:9200"]index => "test-tomcat-accesslog-%{+YYYY.MM.dd}"   # 按日期动态创建索引template_overwrite => true}}# 如果type是dpkg,则将日志输出到dpkg索引if [type] == "dpkg" {elasticsearch {hosts => ["11.0.1.101:9200"]index => "dpkglog-%{+YYYY.MM.dd}"     # 按日期动态创建索引}}
}
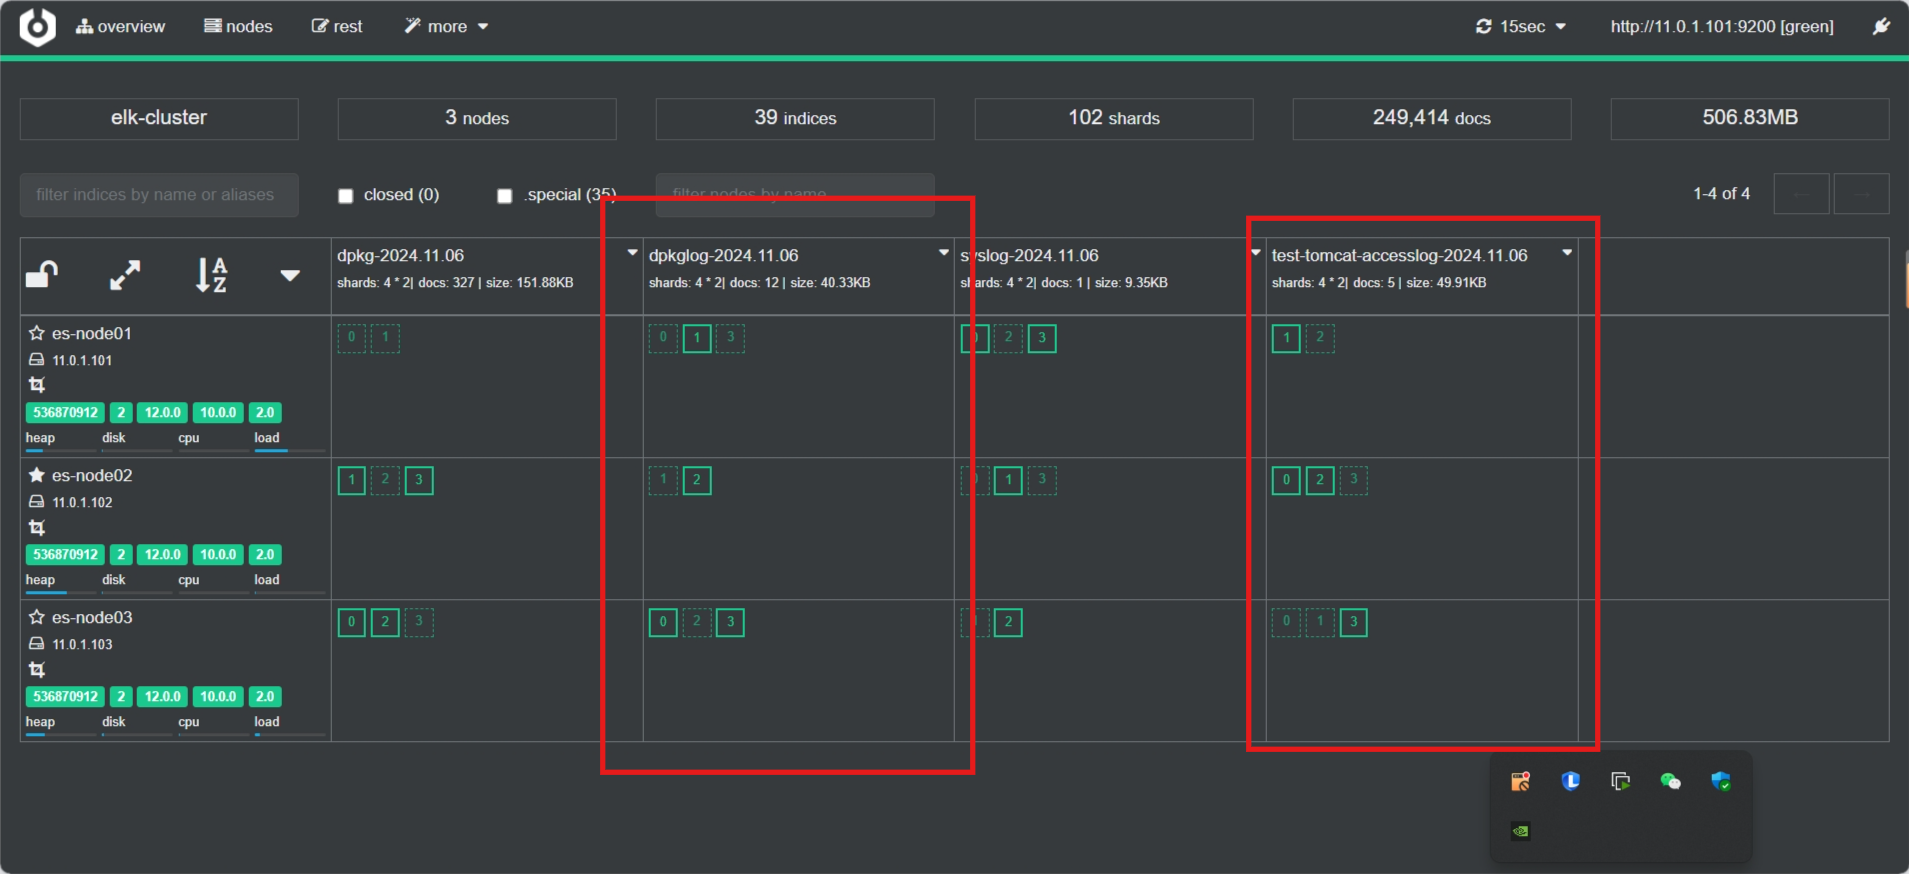
4.4.3.2.5 在 Kibana 添加索引并验证数据
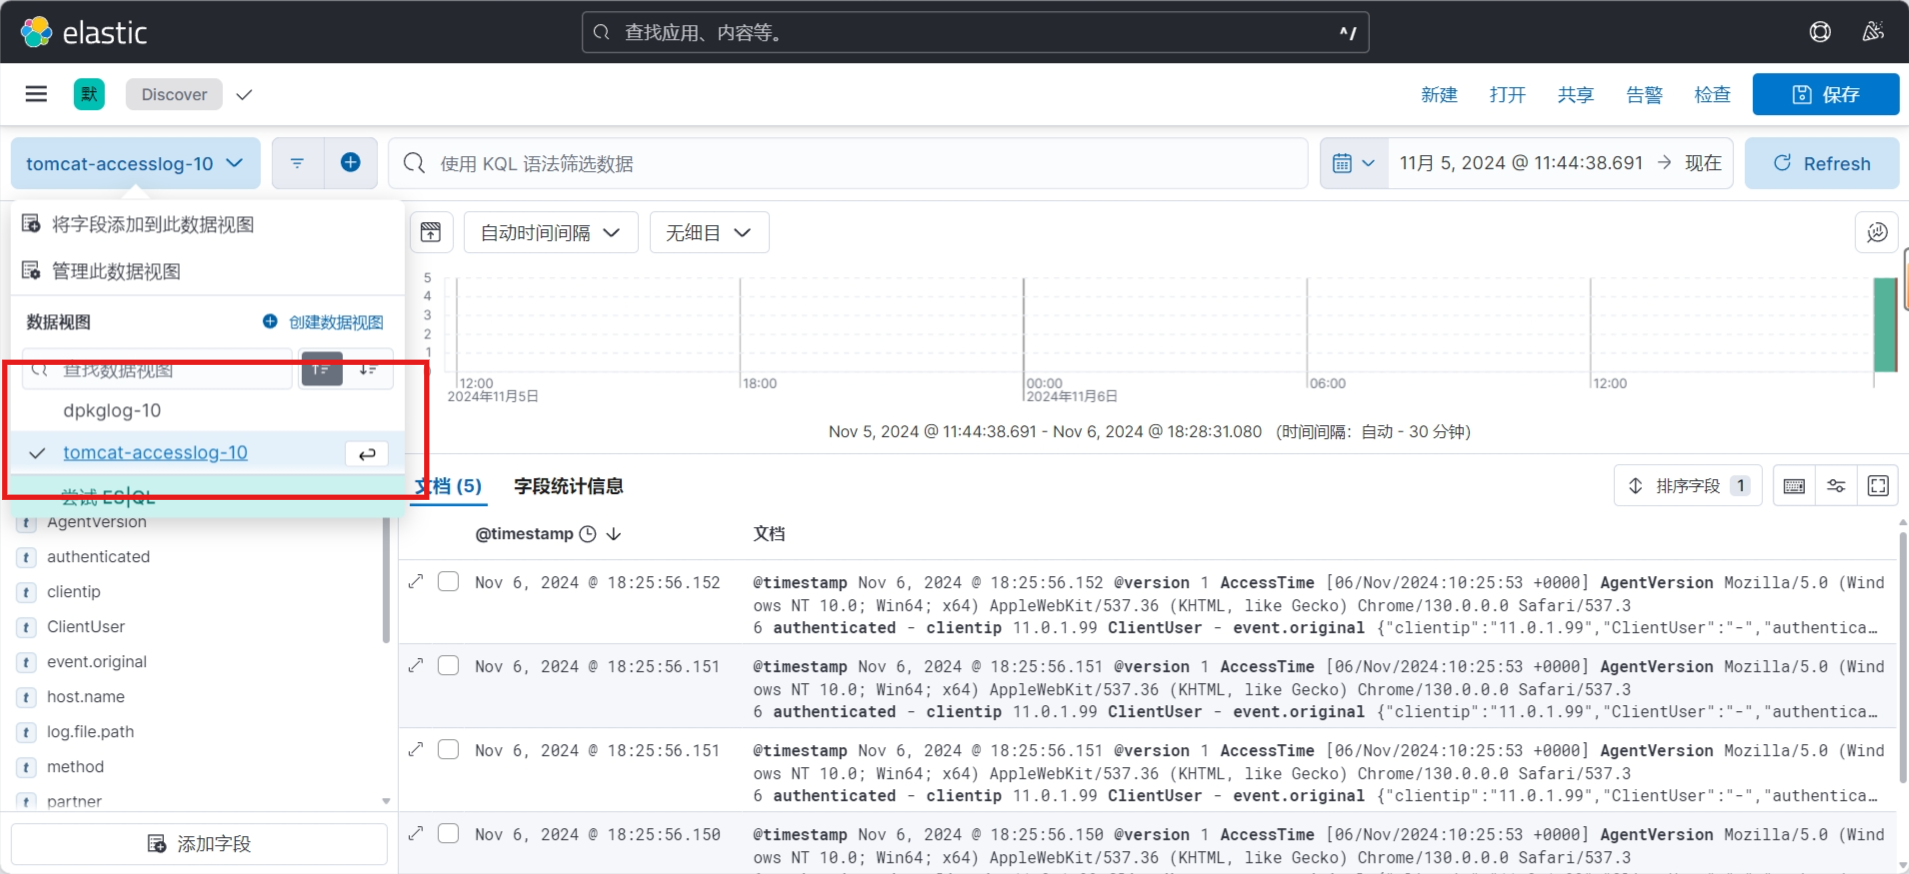
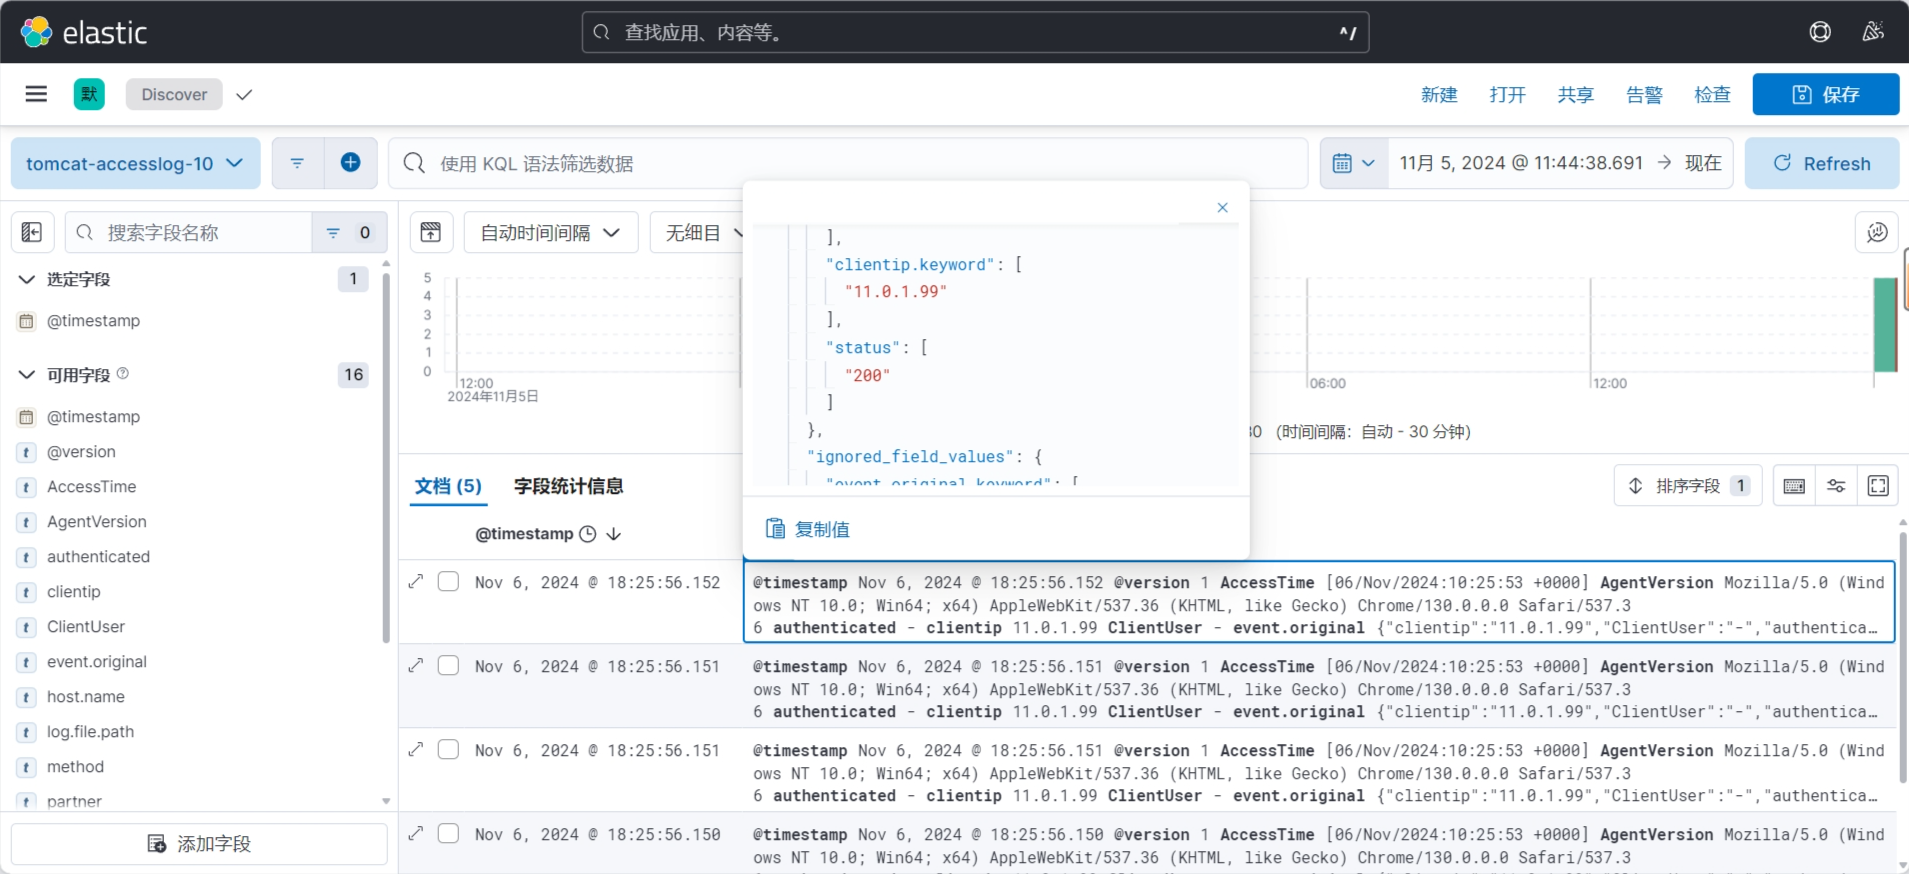
4.4.3.3 利用 multiline 插件收集 Java 错误日志
Java应用日志有时因为某一个错误会出现很多行错误的日志信息,但这些行都属于同一个日志的信息为了Elasticsearch 分析方便,需要将多行日志合并成一行日志
06-Nov-2024 02:57:12.207 信息 [http-nio-8080-exec-3] org.apache.coyote.http11.Http11Processor.service 解析 HTTP 请求 header 错误注意:HTTP请求解析错误的进一步发生将记录在DEBUG级别。java.lang.IllegalArgumentException: 在方法名称中发现无效的字符串, HTTP 方法名必须是有效的符号.at org.apache.coyote.http11.Http11InputBuffer.parseRequestLine(Http11InputBuffer.java:419)at org.apache.coyote.http11.Http11Processor.service(Http11Processor.java:271)at org.apache.coyote.AbstractProcessorLight.process(AbstractProcessorLight.java:65)at org.apache.coyote.AbstractProtocol$ConnectionHandler.process(AbstractProtocol.java:889)at org.apache.tomcat.util.net.NioEndpoint$SocketProcessor.doRun(NioEndpoint.java:1743)at org.apache.tomcat.util.net.SocketProcessorBase.run(SocketProcessorBase.java:49)at org.apache.tomcat.util.threads.ThreadPoolExecutor.runWorker(ThreadPoolExecutor.java:1191)at org.apache.tomcat.util.threads.ThreadPoolExecutor$Worker.run(ThreadPoolExecutor.java:659)at org.apache.tomcat.util.threads.TaskThread$WrappingRunnable.run(TaskThread.java:61)at java.lang.Thread.run(Thread.java:750)
使用codec的multiline插件实现多行匹配,而且支持使用what指令灵活的将匹配到的行与前面的行合并或者和后面的行合并
插件链接:
https://www.elastic.co/guide/en/logstash/current/plugins-codecs-multiline.html
多行匹配规则
https://www.elastic.co/guide/en/beats/filebeat/8.3/multiline-examples.html
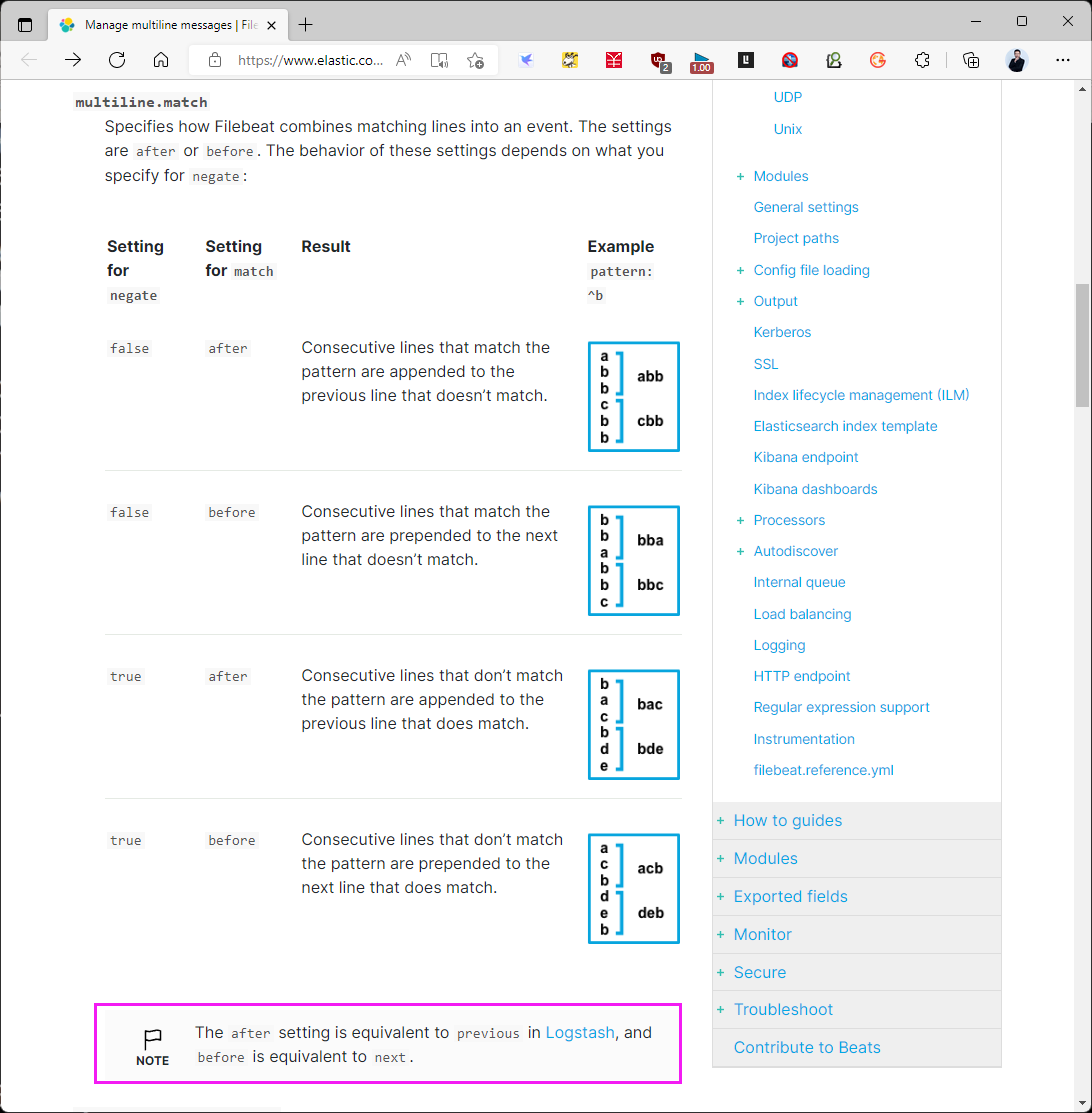
4.4.3.3.1 实现测试 multiline 插件的配置文件
root@logstash:~# vim /etc/logstash/conf.d/java-log-to-es.conf input {file {path => "/usr/local/tomcat/logs/catalina.*.log"    # 指定日志文件路径type => "java-error-log"                   # 设置日志类型start_position => "beginning"              # 从文件开头开始读取stat_interval => "3"                       # 每3秒钟检查一次文件状态close_older => "10s"					   # 若无此项配置,会丢失最后一条日志codec => multiline {                       # 配置多行日志解析pattern => "^\d{2}-[A-Za-z]{3}-\d{4}"    # 匹配行开头以 "^\d{2}-[A-Za-z]{3}-\d{4}" 开头的日志negate => "true"                         # 反向匹配(即匹配没有 "^\d{2}-[A-Za-z]{3}-\d{4}" 的行)what => "previous"                       # 将没有 "^\d{2}-[A-Za-z]{3}-\d{4}" 的行与前一行合并}}
}output {if [type] == "java-error-log" {              # 只处理类型为 "java-error-log" 的日志elasticsearch {hosts => ["11.0.1.101:9200"]            # 指定 Elasticsearch 集群节点index => "java-error-log-1.10-%{+YYYY.MM.DD}"  # 设置索引名称,按年份和周数生成索引}}
}
注:默认会丢失最后一条日志,需开启 close_older => "10s"项
原因: multiline codec 会尝试将没有匹配模式的行合并到前一行,直到遇到新的模式为止。如果文件在最后一条日志还没有完成时被读取完,Logstash 可能没有机会将这些行处理和输出。
#方法1 => 增加close_older => "10s"项
input {file {path => "/data/java-log/es-cluster.log"   # 指定日志文件路径type => "java-error-log"                   # 设置日志类型start_position => "beginning"              # 从文件开头开始读取stat_interval => "3"                       # 每3秒钟检查一次文件状态close_older => "1h"                        # 如果文件超过1小时没有更新,则关闭文件codec => multiline {                       # 配置多行日志解析pattern => "^\["                         # 匹配行开头以 "[" 开头的日志negate => "true"                          # 反向匹配(即匹配没有 "[" 的行)what => "previous"                       # 将没有 "[" 的行与前一行合并}}
}output {if [type] == "java-error-log" {              # 只处理类型为 "java-error-log" 的日志elasticsearch {hosts => ["11.0.1.101:9200"]            # 指定 Elasticsearch 集群节点index => "java-error-log-0.107-%{+YYYY.ww}"  # 设置索引名称,按年份和周数生成索引}}
}#方法2 => 增大 Logstash 的 multiline codec 的 timeout 设置,以便在文件结束时等待更长时间,确保最后的日志能够合并并处理。input {file {path => "/data/java-log/es-cluster.log"type => "java-error-log"start_position => "beginning"stat_interval => "3"codec => multiline {pattern => "^\["        # 匹配以 "[" 开头的日志行negate => "true"        # 反向匹配没有 "[" 的行what => "previous"      # 合并当前行与前一行timeout => "300"        # 设置超时时间为300秒,即5分钟,允许 Logstash 在没有新的行时等待更长时间}}
}output {if [type] == "java-error-log" {elasticsearch {hosts => ["11.0.1.101:9200"]index => "java-error-log-0.107-%{+YYYY.ww}"}}
}#方法3 => 如果您使用的是 Filebeat 或其他日志采集工具,可以考虑增加 flush_interval,该选项会强制 Logstash 在指定时间内将日志事件刷新到输出。如果 Logstash 在处理完文件时确实需要一个“强制”的刷新,您可以设置一个较短的时间来保证所有事件都被处理并输出。#总结close_older 配置项确保 Logstash 在文件没有更新时,保持文件打开直到所有日志行都被处理。timeout 可以用来确保 Logstash 等待一定时间,以便将最后的日志行合并并输出。flush_interval 适用于确保日志及时刷新到输出端,减少漏掉日志的风险。#另一日志缺失问题
记录了一次Logstash日志丢失问题的排查过程。系统通过logback配置双写日志,本地无误但Logstash在Kibana上显示部分日志缺失。研究发现LogstashTcpSocketAppender的RingBuffer满会导致日志丢失,且日志数据传输后因json解析错误被截断。解决方案是将Logstash的codec从json改为json_lines,避免长json被截断导致解析异常。
4.4.3.3.2 cerebro 插件查看索引
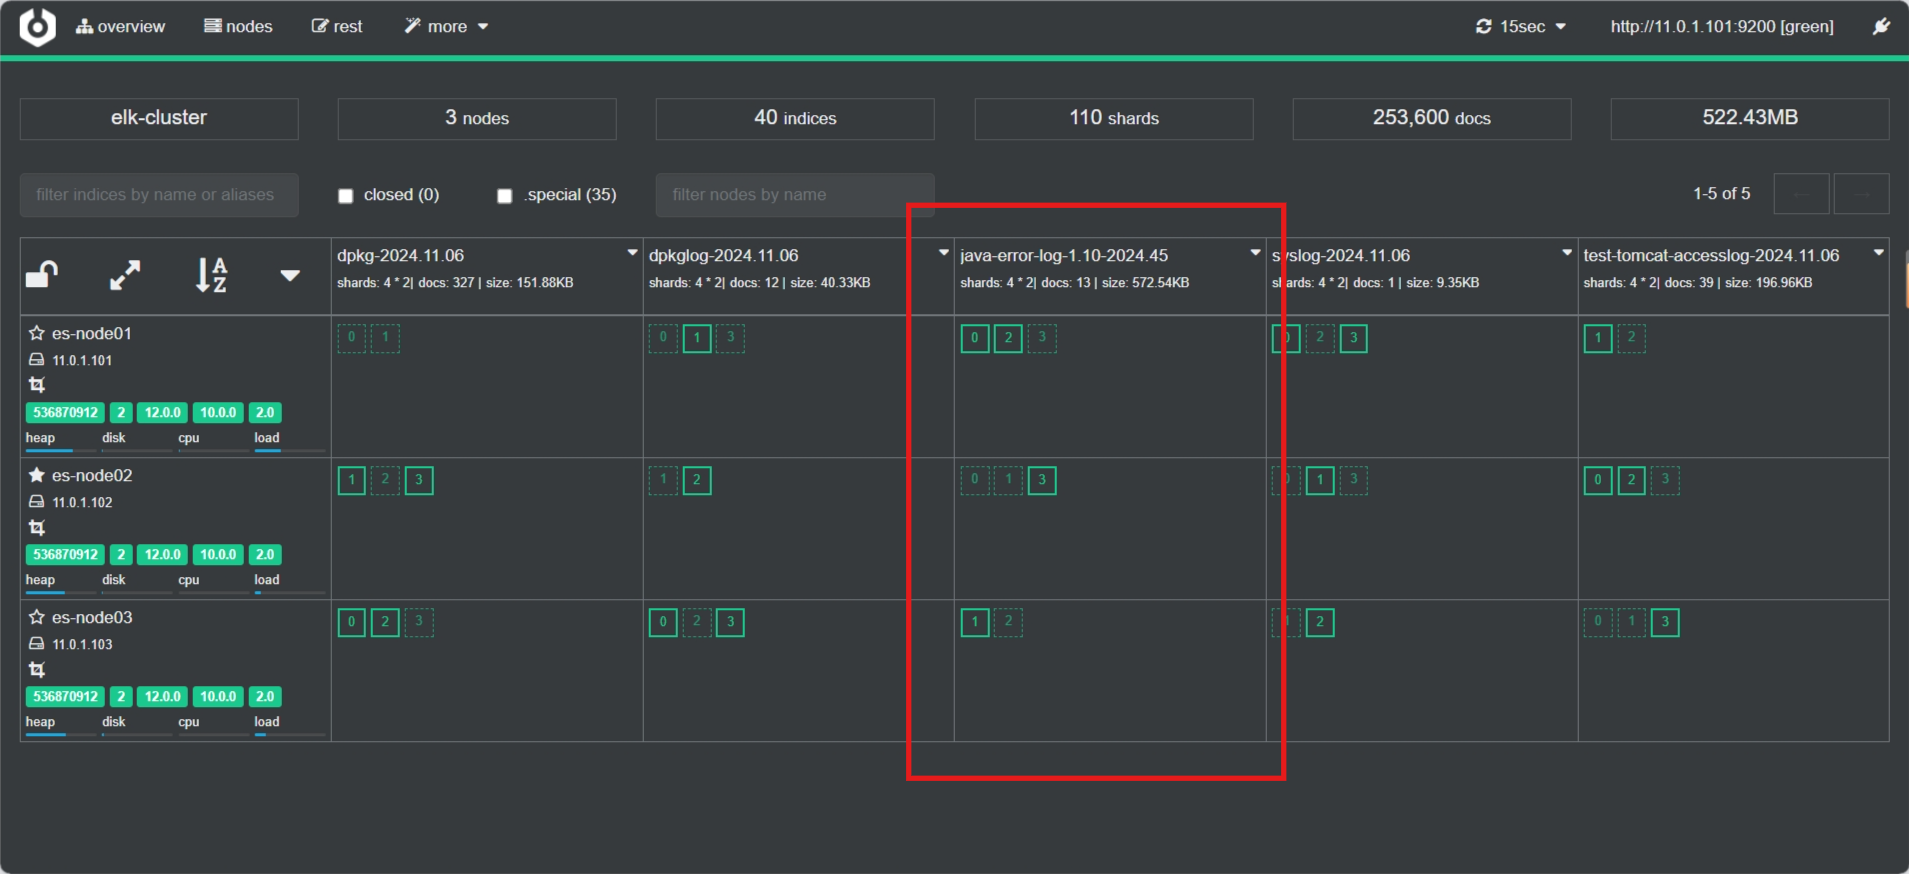
4.4.3.3.3 kibana创建数据视图并查看
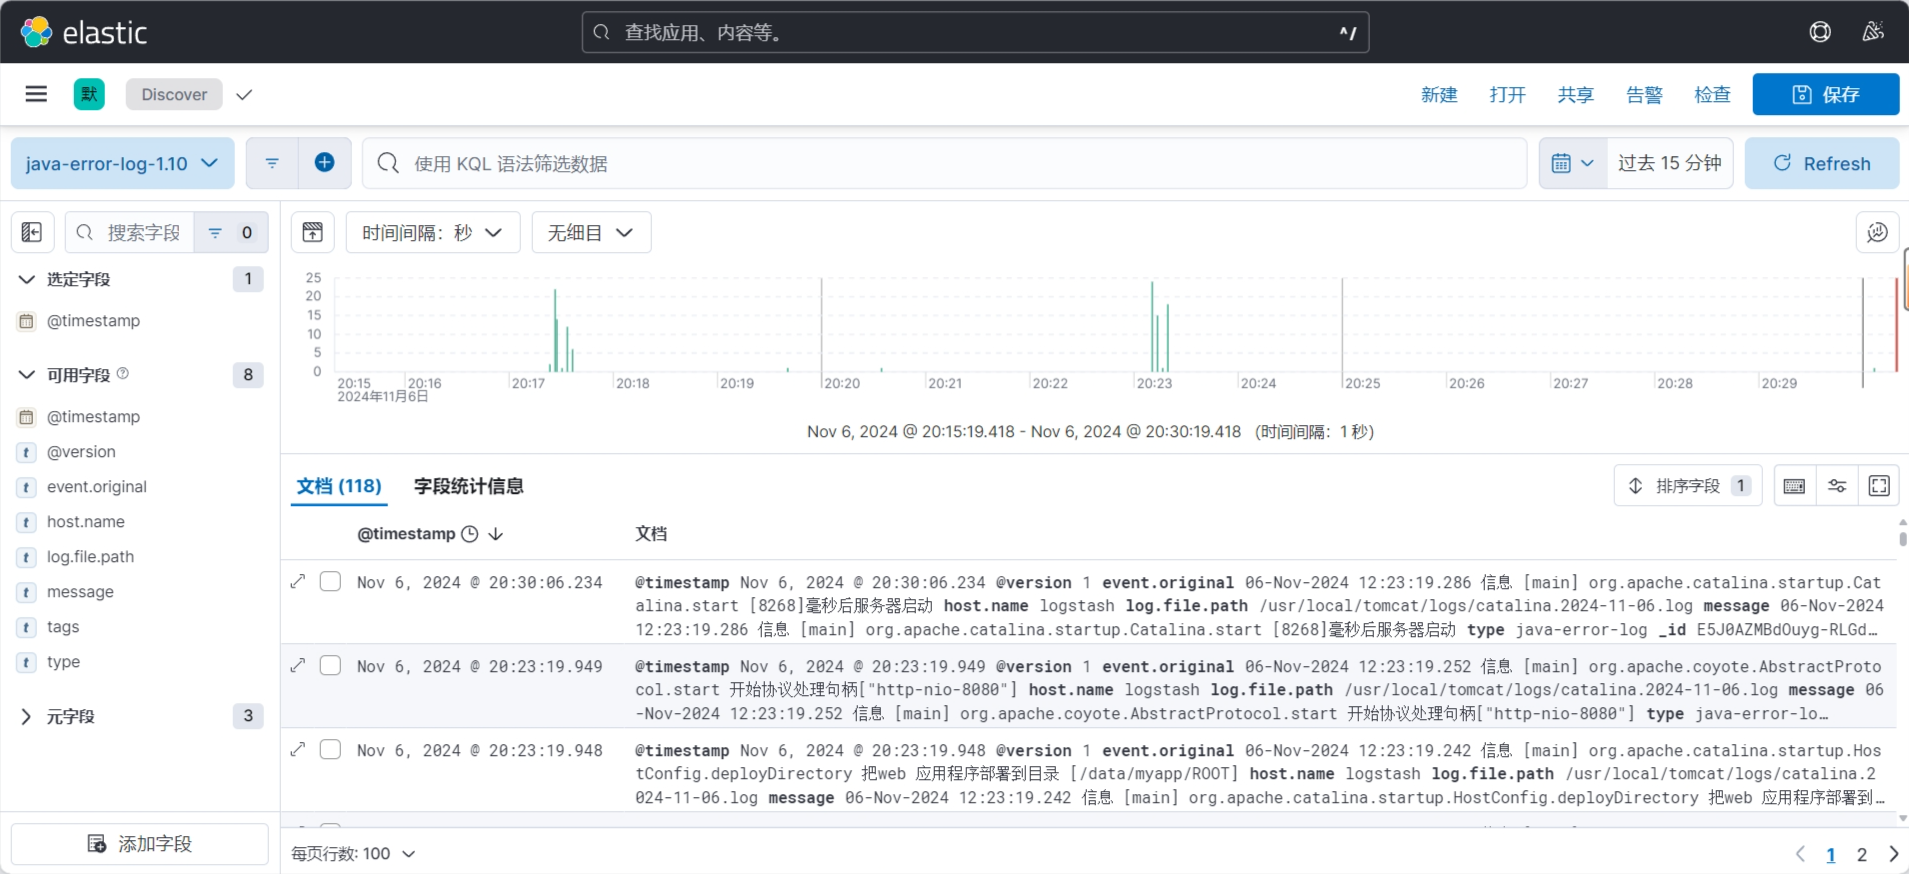
4.4.4 收集 Nginx Json 格式的日志并输出至 Elasticsearch
filebeat 可以收集json格式的数据
官方说明:
https://www.elastic.co/guide/en/beats/filebeat/7.x/filebeat-input-log.html
4.4.4.1 部署 Nginx 服务
4.4.4.2 将 Nginx 日志转换为 Json 格式
[root@web-server /etc/filebeat]#grep -Ev '^(#|$)' /etc/nginx/nginx.conf
user www-data;
worker_processes auto;
pid /run/nginx.pid;
include /etc/nginx/modules-enabled/*.conf;
events {worker_connections 768;# multi_accept on;
}
http {### Basic Settings##sendfile on;tcp_nopush on;tcp_nodelay on;keepalive_timeout 65;types_hash_max_size 2048;# server_tokens off;# server_names_hash_bucket_size 64;# server_name_in_redirect off;include /etc/nginx/mime.types;default_type application/octet-stream;### SSL Settings##ssl_protocols TLSv1 TLSv1.1 TLSv1.2 TLSv1.3; # Dropping SSLv3, ref: POODLEssl_prefer_server_ciphers on;### Logging Settings### 定义自定义日志格式为 JSON 格式,并进行 JSON 字符转义log_format json_logs escape=json '{''"@timestamp":"$time_iso8601",'               # 记录 ISO 8601 格式的时间戳'"host":"$server_addr",'                      # 服务器地址'"clientip":"$remote_addr",'                  # 客户端 IP 地址'"size":$body_bytes_sent,'                    # 响应发送给客户端的字节数'"responsetime":$request_time,'               # 请求处理时间'"upstreamtime":"$upstream_response_time",'   # 上游服务器响应时间'"upstreamhost":"$upstream_addr",'            # 上游服务器地址'"http_host":"$host",'                        # 请求中的 Host 头部'"uri":"$uri",'                               # 请求的 URI'"domain":"$host",'                           # 请求中的域名'"xff":"$http_x_forwarded_for",'              # 客户端的 X-Forwarded-For 头,表示客户端的原始 IP'"referer":"$http_referer",'                  # 请求的 Referer 头'"tcp_xff":"$proxy_protocol_addr",'           # 通过 TCP 代理协议传递的原始客户端 IP 地址'"http_user_agent":"$http_user_agent",'       # 用户代理(客户端的浏览器或其他信息)'"status":"$status"}';                        # HTTP 响应状态码# 使用自定义的 JSON 格式记录访问日志access_log /var/log/nginx/access_json.log json_logs;# 指定错误日志的输出位置error_log /var/log/nginx/error_json.log;gzip on;include /etc/nginx/conf.d/*.conf;include /etc/nginx/sites-enabled/*;
}
4.4.4.3 配置 Logstash 收集 Nginx 访问日志
 root@logstash:~# cat /etc/logstash/conf.d/nginx-log-to-es.conf
# 输入部分
input {# 读取 nginx 访问日志file {path => "/var/log/nginx/access_json.log"start_position => "beginning"stat_interval => "3"type => "nginx-accesslog"  # 标记为 nginx 访问日志codec => json  # 假设访问日志是 JSON 格式}# 读取 nginx 错误日志file {path => "/var/log/nginx/error.log"start_position => "beginning"stat_interval => "3"type => "nginx-errorlog"  # 标记为 nginx 错误日志}
}# 输出部分
output {# 针对 nginx 访问日志if [type] == "nginx-accesslog" {elasticsearch {hosts => ["11.0.1.101:9200"]  # Elasticsearch 地址index => "accesslog-%{+YYYY.MM.dd}"  # 动态索引名}}# 针对 nginx 错误日志if [type] == "nginx-errorlog" {elasticsearch {hosts => ["11.0.1.101:9200"]  # Elasticsearch 地址index => "errorlog-%{+YYYY.MM.dd}"  # 动态索引名}}
}
4.4.4.4 cerebro 插件查看索引
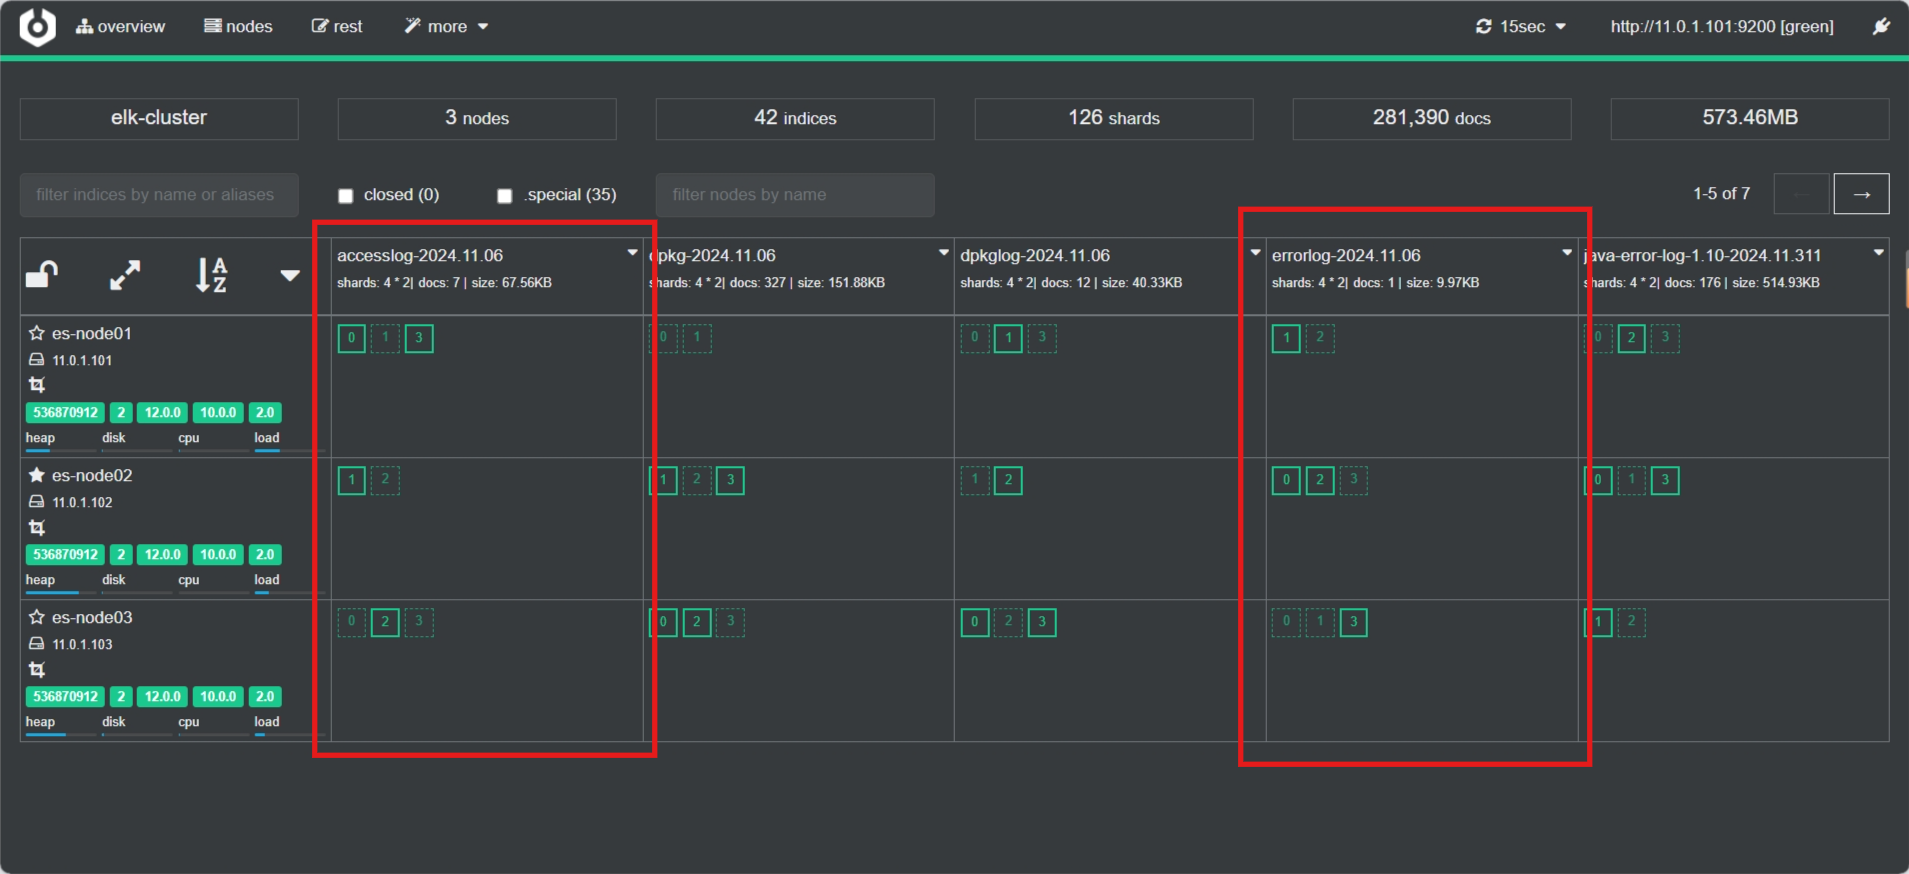
4.4.4.5 kibana创建数据视图
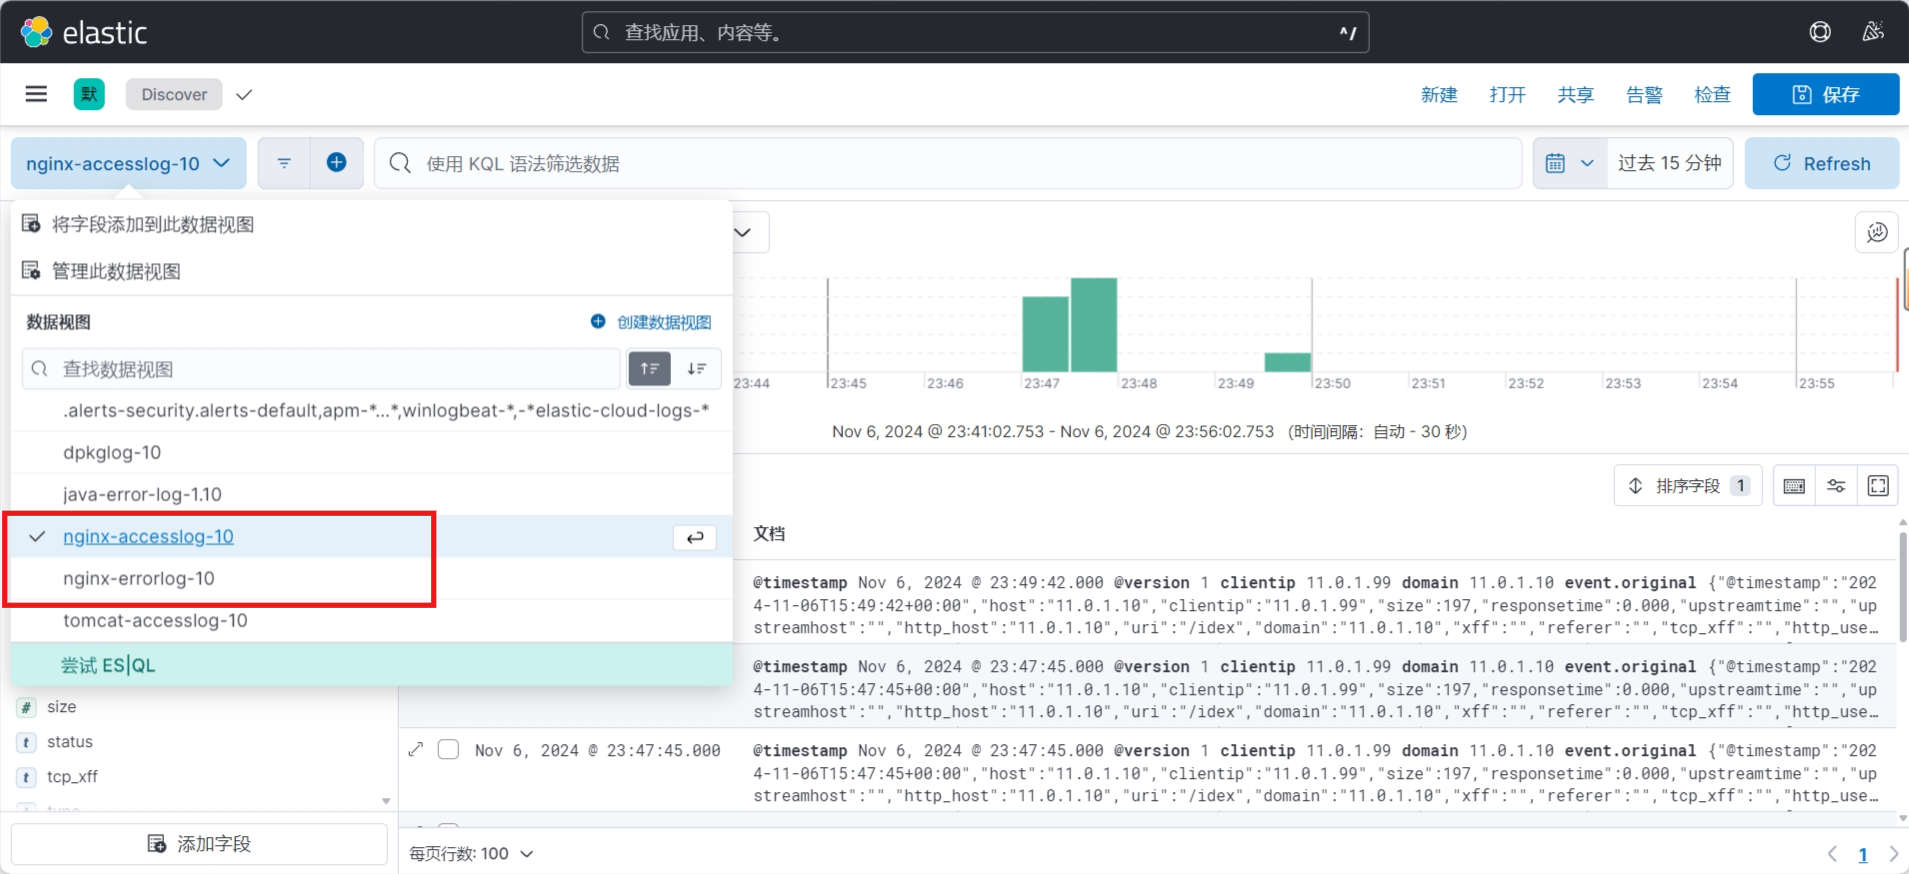
4.4.4.6 Kibana界面验证数据
访问日志数据验证
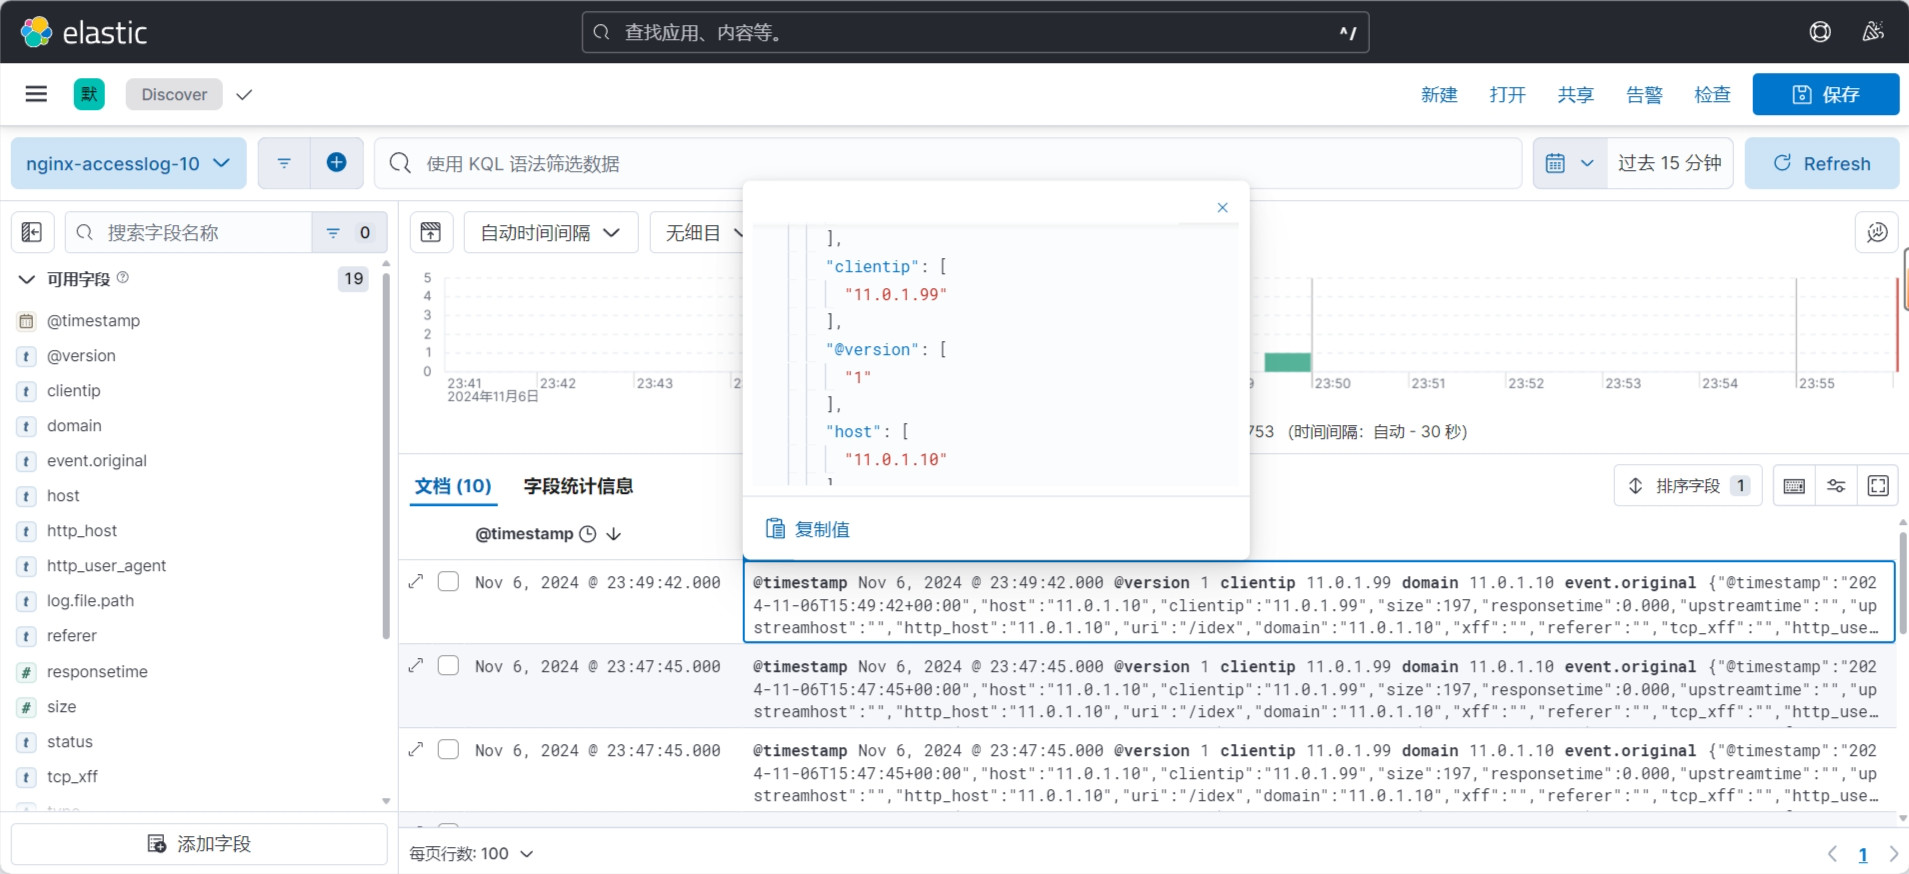
错误日志数据验证
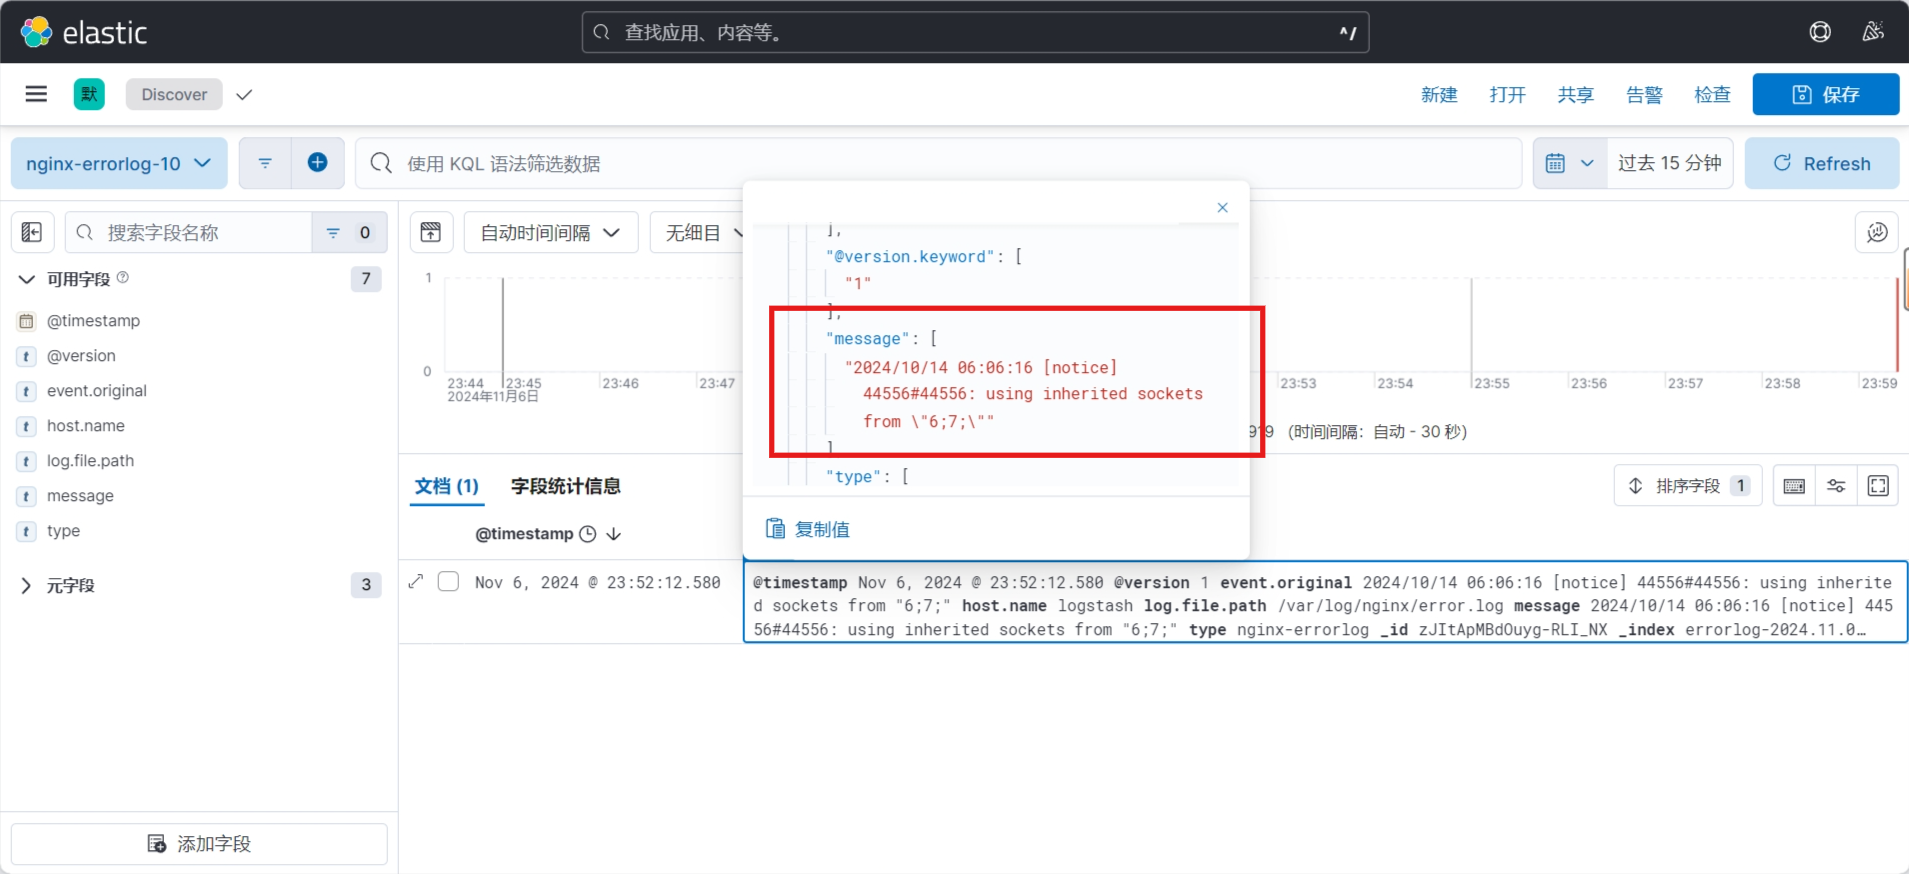
4.4.5 基于 TCP/UDP 收集日志并输出至 Elasticsearch
4.4.5.1 准备 Logstash 配置文件先进行收集测试
root@logstash:~# vim /etc/logstash/conf.d/tcp-to-es.conf input {tcp {port => "9999"host => "0.0.0.0"type => "tcplog"codec => jsonmode => "server"}
}output {if [type] == 'tcplog' {stdout {codec => "rubydebug"}}
}
4.4.5.2 验证端口启动成功
root@logstash:~# /usr/share/logstash/bin/logstash -f /etc/logstash/conf.d/tcp-to-es.conf -r
root@logstash:~# ss -ntlp|grep 9999
LISTEN 0      1024                    *:9999             *:*    users:(("java",pid=31141,fd=94))
4.4.5.3 通过 nc 命令测试
NetCat简称nc, 因其功能强大,被称为网络界的“瑞士军刀”,利用nc 可以实现基于TCP或UDP协议传输数据.
# 向logstash服务器发送信息
# 输入非Json格式数据
root@logstash:~# apt install netcat -y
root@logstash:~# nc --help
nc: invalid option -- '-'
usage: nc [-46CDdFhklNnrStUuvZz] [-I length] [-i interval] [-M ttl][-m minttl] [-O length] [-P proxy_username] [-p source_port][-q seconds] [-s sourceaddr] [-T keyword] [-V rtable] [-W recvlimit][-w timeout] [-X proxy_protocol] [-x proxy_address[:port]][destination] [port]root@logstash:~# echo "welcome to dinginx"|nc 11.0.1.10 9999
## logstash界面查看
root@logstash:~# /usr/share/logstash/bin/logstash -f /etc/logstash/conf.d/tcp-to-es.conf -r{"@timestamp" => 2024-11-07T02:03:01.902786006Z,"tags" => [[0] "_jsonparsefailure"],"@version" => "1","type" => "tcplog","message" => "welcome to dinginx"
}# 输入Json格式数据
root@logstash:~# echo '{"name" : "dinginx", "age" : "18", "phone" : "400-6666999"}' | nc 11.0.1.10 9999
## logstash界面查看
root@logstash:~# /usr/share/logstash/bin/logstash -f /etc/logstash/conf.d/tcp-to-es.conf -r{"type" => "tcplog","name" => "dinginx","@version" => "1","phone" => "400-6666999","@timestamp" => 2024-11-07T02:06:14.541142639Z,"age" => "18"
}
范例:telnet工具也可实现
#输入json数据
root@logstash:~# echo '{"name" : "telnet-dinginx", "age" : "18", "phone" : "400-6666999"}' | telnet 11.0.1.10 9999Trying 11.0.1.10...
Connected to 11.0.1.10.
Escape character is '^]'.
Connection closed by foreign host.## logstash界面查看
root@logstash:~# /usr/share/logstash/bin/logstash -f /etc/logstash/conf.d/tcp-to-es.conf -r{"type" => "tcplog","name" => "telnet-dinginx","@version" => "1","phone" => "400-6666999","@timestamp" => 2024-11-07T02:08:34.088200297Z,"age" => "18"
}
4.4.5.4 通过 nc 命令发送一个文件
root@logstash:~# nc 11.0.1.10 9999 < /etc/os-release## logstash界面查看
root@logstash:~# /usr/share/logstash/bin/logstash -f /etc/logstash/conf.d/tcp-to-es.conf -r{"type" => "tcplog","tags" => [[0] "_jsonparsefailure"],"@timestamp" => 2024-11-07T02:12:11.967753937Z,"message" => "NAME=\"Ubuntu\"\r","@version" => "1"
}
{"type" => "tcplog","tags" => [[0] "_jsonparsefailure"],"@timestamp" => 2024-11-07T02:12:11.970112322Z,"message" => "VERSION=\"22.04.2 LTS (Jammy Jellyfish)\"\r","@version" => "1"
}
{"type" => "tcplog","tags" => [[0] "_jsonparsefailure"],"@timestamp" => 2024-11-07T02:12:11.972702249Z,"message" => "ID=ubuntu\r","@version" => "1"
}
{"type" => "tcplog","tags" => [[0] "_jsonparsefailure"],"@timestamp" => 2024-11-07T02:12:11.975817006Z,"message" => "HOME_URL=\"https://www.ubuntu.com/\"\r","@version" => "1"
}
{"type" => "tcplog","tags" => [[0] "_jsonparsefailure"],"@timestamp" => 2024-11-07T02:12:11.977341477Z,"message" => "BUG_REPORT_URL=\"https://bugs.launchpad.net/ubuntu/\"\r","@version" => "1"
}
{"type" => "tcplog","tags" => [[0] "_jsonparsefailure"],"@timestamp" => 2024-11-07T02:12:11.980007111Z,"message" => "UBUNTU_CODENAME=jammy\r","@version" => "1"
}
{"type" => "tcplog","tags" => [[0] "_jsonparsefailure"],"@timestamp" => 2024-11-07T02:12:11.966739795Z,"message" => "PRETTY_NAME=\"Ubuntu 22.04.2 LTS\"\r","@version" => "1"
}
{"type" => "tcplog","tags" => [[0] "_jsonparsefailure"],"@timestamp" => 2024-11-07T02:12:11.968754710Z,"message" => "VERSION_ID=\"22.04\"\r","@version" => "1"
}
{"type" => "tcplog","tags" => [[0] "_jsonparsefailure"],"@timestamp" => 2024-11-07T02:12:11.971037167Z,"message" => "VERSION_CODENAME=jammy\r","@version" => "1"
}
{"type" => "tcplog","tags" => [[0] "_jsonparsefailure"],"@timestamp" => 2024-11-07T02:12:11.974874643Z,"message" => "ID_LIKE=debian\r","@version" => "1"
}
{"type" => "tcplog","tags" => [[0] "_jsonparsefailure"],"@timestamp" => 2024-11-07T02:12:11.976525713Z,"message" => "SUPPORT_URL=\"https://help.ubuntu.com/\"\r","@version" => "1"
}
{"type" => "tcplog","tags" => [[0] "_jsonparsefailure"],"@timestamp" => 2024-11-07T02:12:11.978411794Z,"message" => "PRIVACY_POLICY_URL=\"https://www.ubuntu.com/legal/terms-and-policies/privacy-policy\"\r","@version" => "1"
}
4.4.5.5 通过伪设备的方式发送消息
Linux系统中,设备分为块设备和字符设备,而块设备中有硬盘、内存的等对应实体的硬件,但是也有一些设备并不一定要对应物理设备,比如: /dev/null,/dev/zero,/dev/random,/dev/tcp,/dev/udp等,这种没有对应关系的设备称为伪设备
root@logstash:~# echo "伪设备测试" > /dev/tcp/11.0.1.10/9999root@logstash:~# /usr/share/logstash/bin/logstash -f /etc/logstash/conf.d/tcp-to-es.conf
......
{"message" => "伪设备测试","@timestamp" => 2024-02-04T08:07:14.484Z,"port" => 37476,"type" => "tcplog","@version" => "1","host" => "11.0.1.10"
}
4.4.5.6 将输出改为 Elasticsearch
root@logstash:~# vim /etc/logstash/conf.d/tcp-to-es.conf input {tcp {port => "9999"host => "0.0.0.0"type => "tcplog"codec => jsonmode => "server"}
}output {if [type] == 'tcplog' {
#    stdout {
#       codec => "rubydebug"
#    }elasticsearch {hosts => ["11.0.1.101:9200"]index => "tcplog-1.10-%{+YYYY.MM.dd}"}}
}
4.4.5.7 通过 nc 命令或伪设备、telnet输入日志
root@logstash:~# echo '{"name" : "dinginx", "age" : "18", "phone" : "400-6666999","tcplog" : "test-test"}' | telnet 11.0.1.10 9999
root@logstash:~# cat /etc/os-release |nc 11.0.1.10 9999
4.4.5.8 利用 cerebro 插件查看
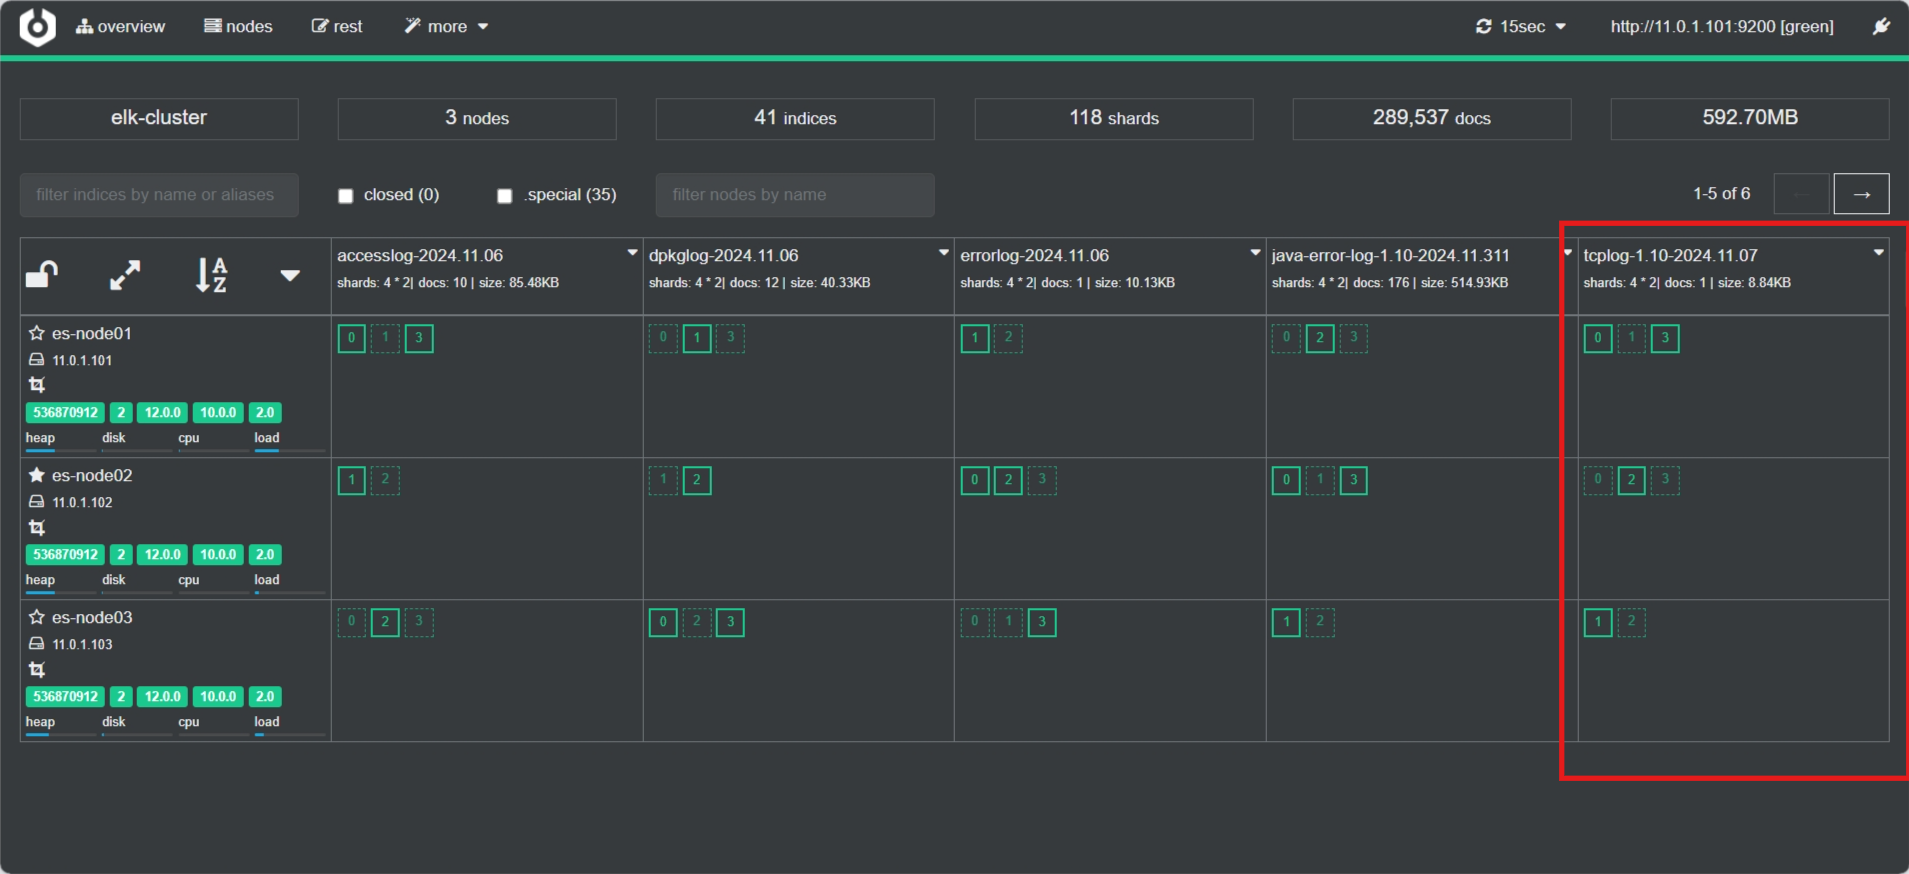
4.4.5.9 在 Kibana 界面添加数据视图并通过Discover展示
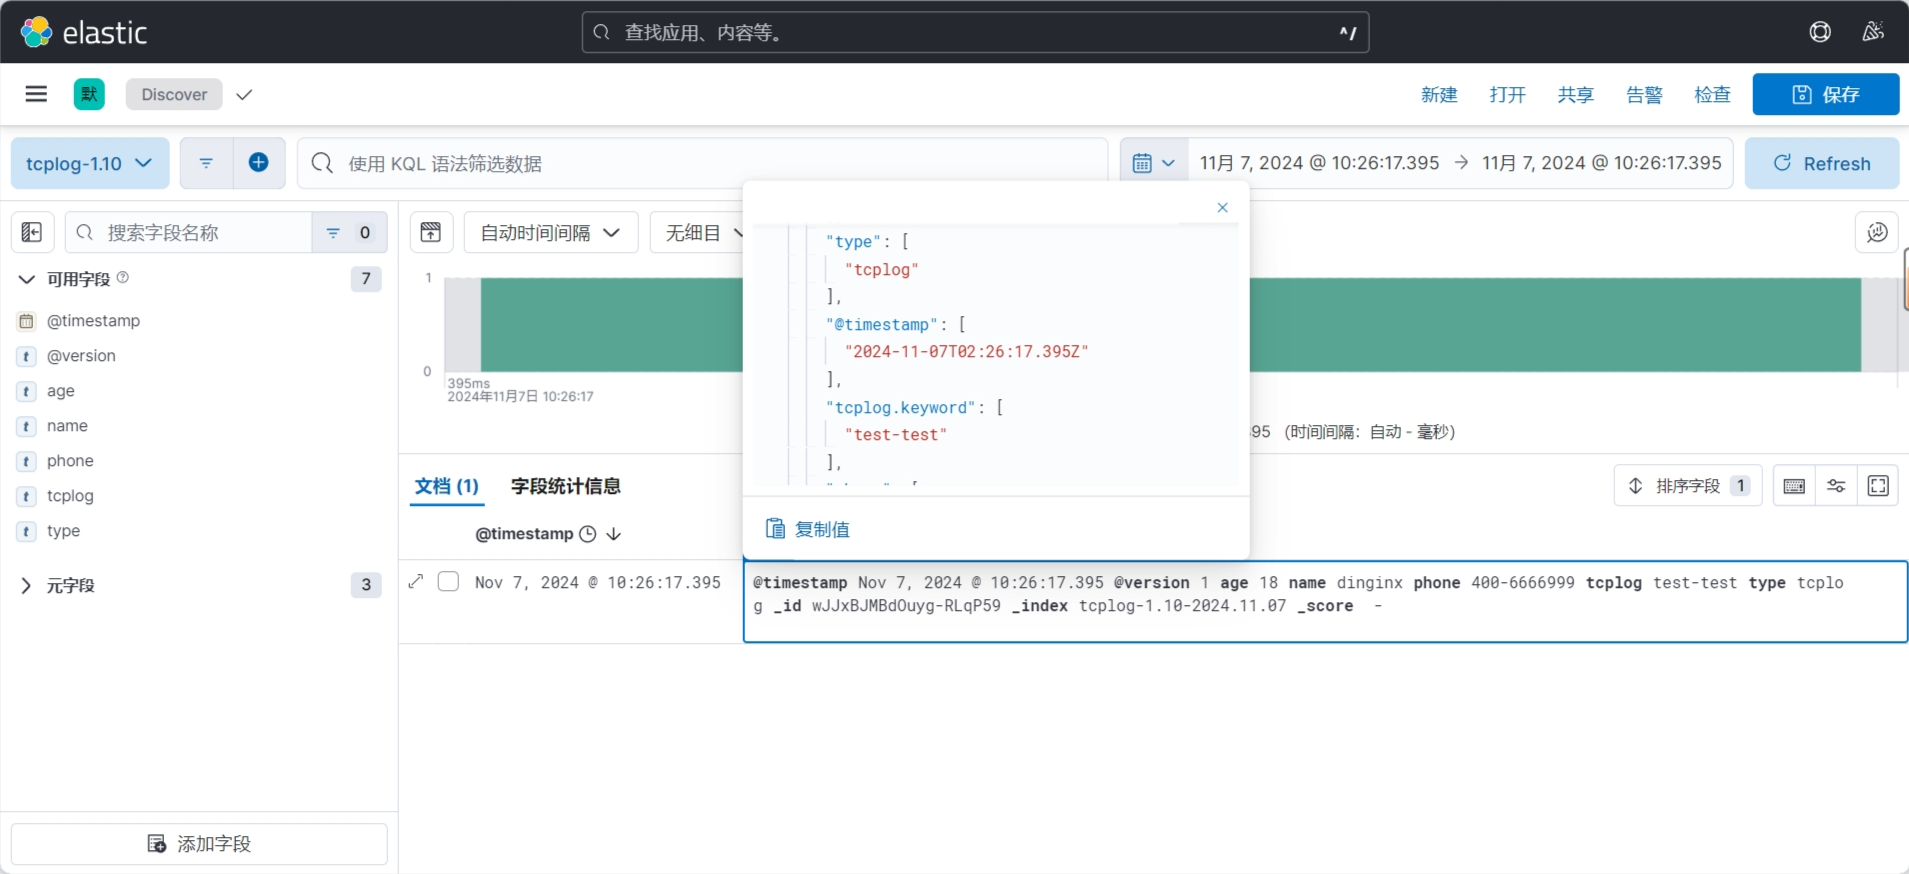
4.4.6 通过 Rsyslog 收集 Haproxy 日志并输出至 Elasticsearch
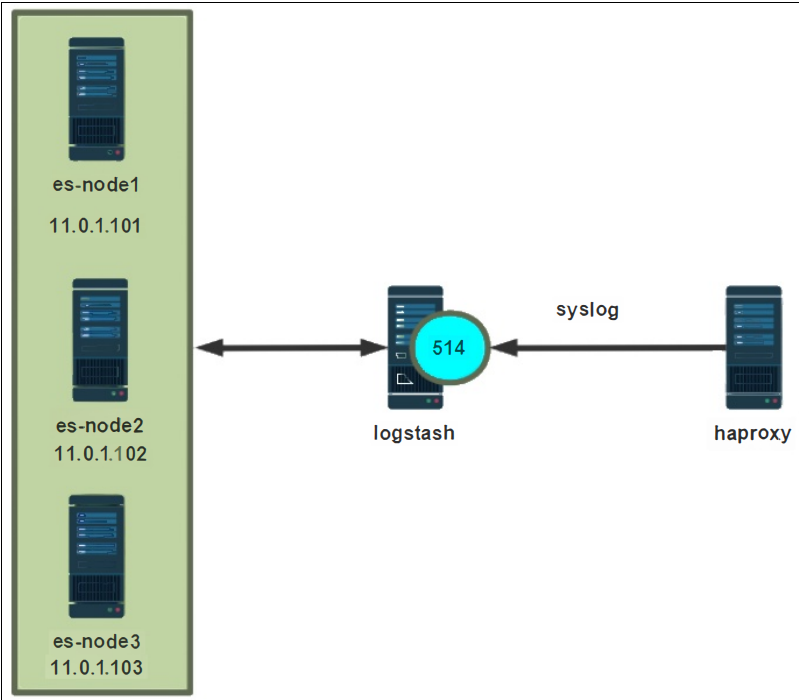
4.4.6.1 rsyslog日志服务和syslog插 件介绍
Linux系统中的rsyslog提供强大的日志管理功能 不仅可以收集本机的日志,还可以接受来自各种来源的输入,转换再发送至不同的目标
此外rsyslog的性能也很强,根据官方的介绍,rsyslog(2013年版本)可以达到每秒转发百万条日志的级别
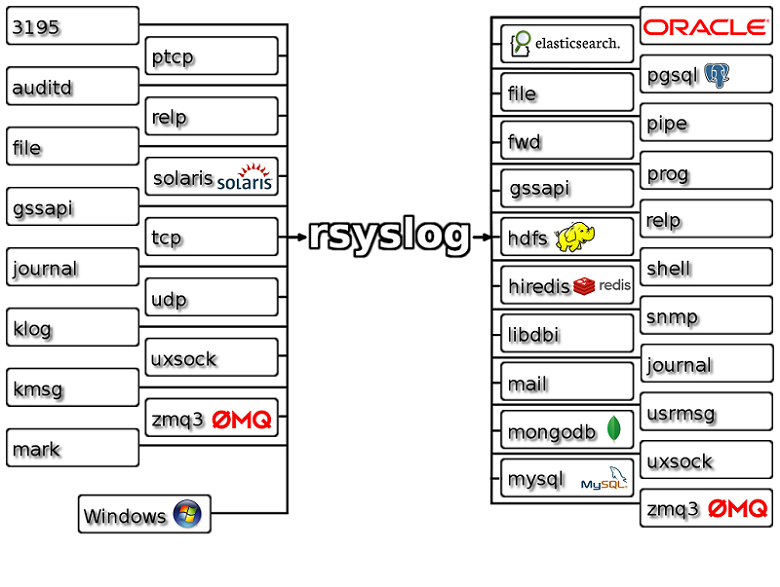
**官方网址:**http://www.rsyslog.com/
确认系统安装的版本命令如下:
root@logstash:~# dpkg -l rsyslog
期望状态=未知(u)/安装(i)/删除(r)/清除(p)/保持(h)
| 状态=未安装(n)/已安装(i)/仅存配置(c)/仅解压缩(U)/配置失败(F)/不完全安装(H)/触发器等待(W)/触发器未决(T)
|/ 错误?=(无)/须重装(R) (状态,错误:大写=故障)
||/ 名称           版本                体系结构     描述
+++-==============-===================-============-=========================================
ii  rsyslog        8.2112.0-2ubuntu2.2 amd64        reliable system and kernel logging daemon
利用 logstash的syslog插件可以收集日志,经常用于收集网络设备的日志,比如:路由器,交换机等
官方链接:
https://www.elastic.co/guide/en/logstash/current/plugins-inputs-syslog.html
https://www.elastic.co/guide/en/logstash/7.x/plugins-inputs-syslog.html
4.4.6.2 安装并配置 Haproxy 的日志(如果不生效,reboot)
[root@web-server ~]#vim /etc/haproxy/haproxy.cfg global#log /dev/log   local0		#注释掉#log /dev/log   local1 notice	#注释掉,默认会记录日志到/var/log/haproxy.log中log  127.0.0.1   local6		 #添加下面一行,发送至本机的514/udp的local6日志级别中  chroot /var/lib/haproxystats socket /run/haproxy/admin.sock mode 660 level admin expose-fd listenersstats timeout 30suser haproxygroup haproxydaemon.......#在文件最后加下面段,后台状态显示
listen statsmode httpbind 0.0.0.0:3280stats enablelog 127.0.0.1 local6stats uri /haproxy_statusstats auth admin:123456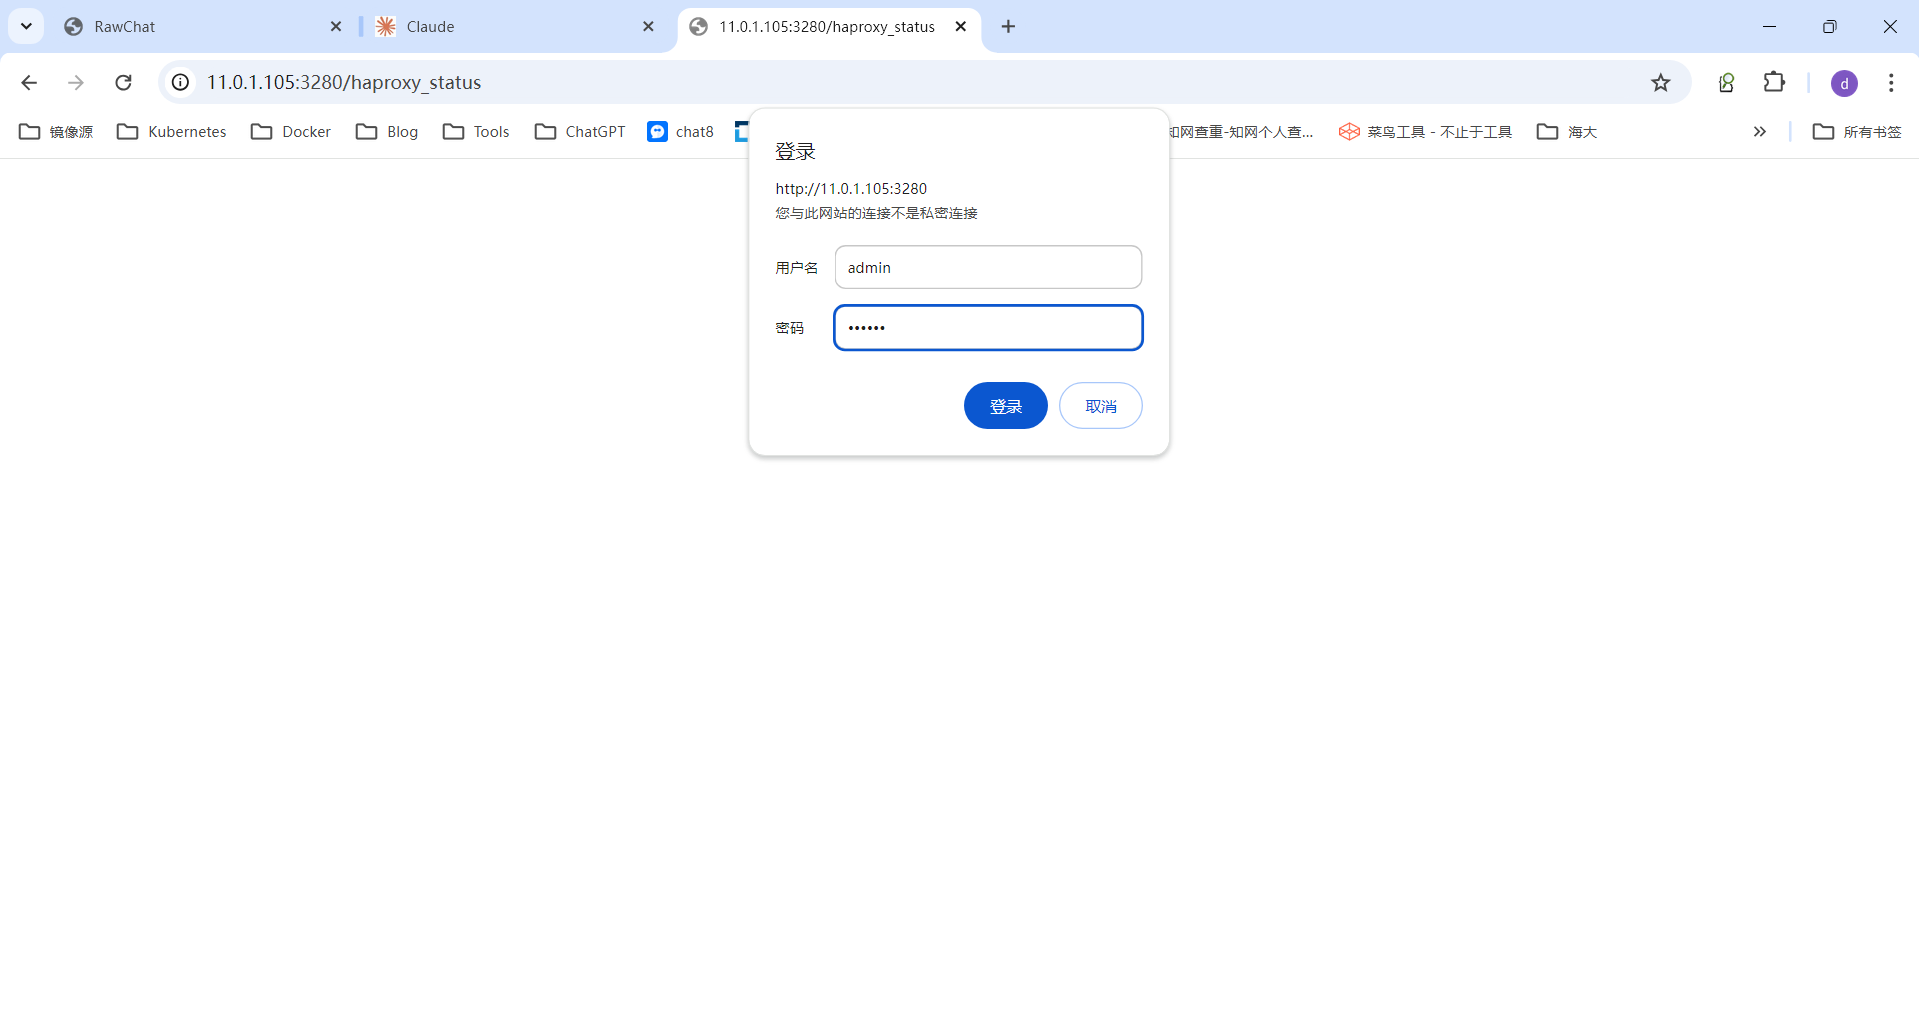
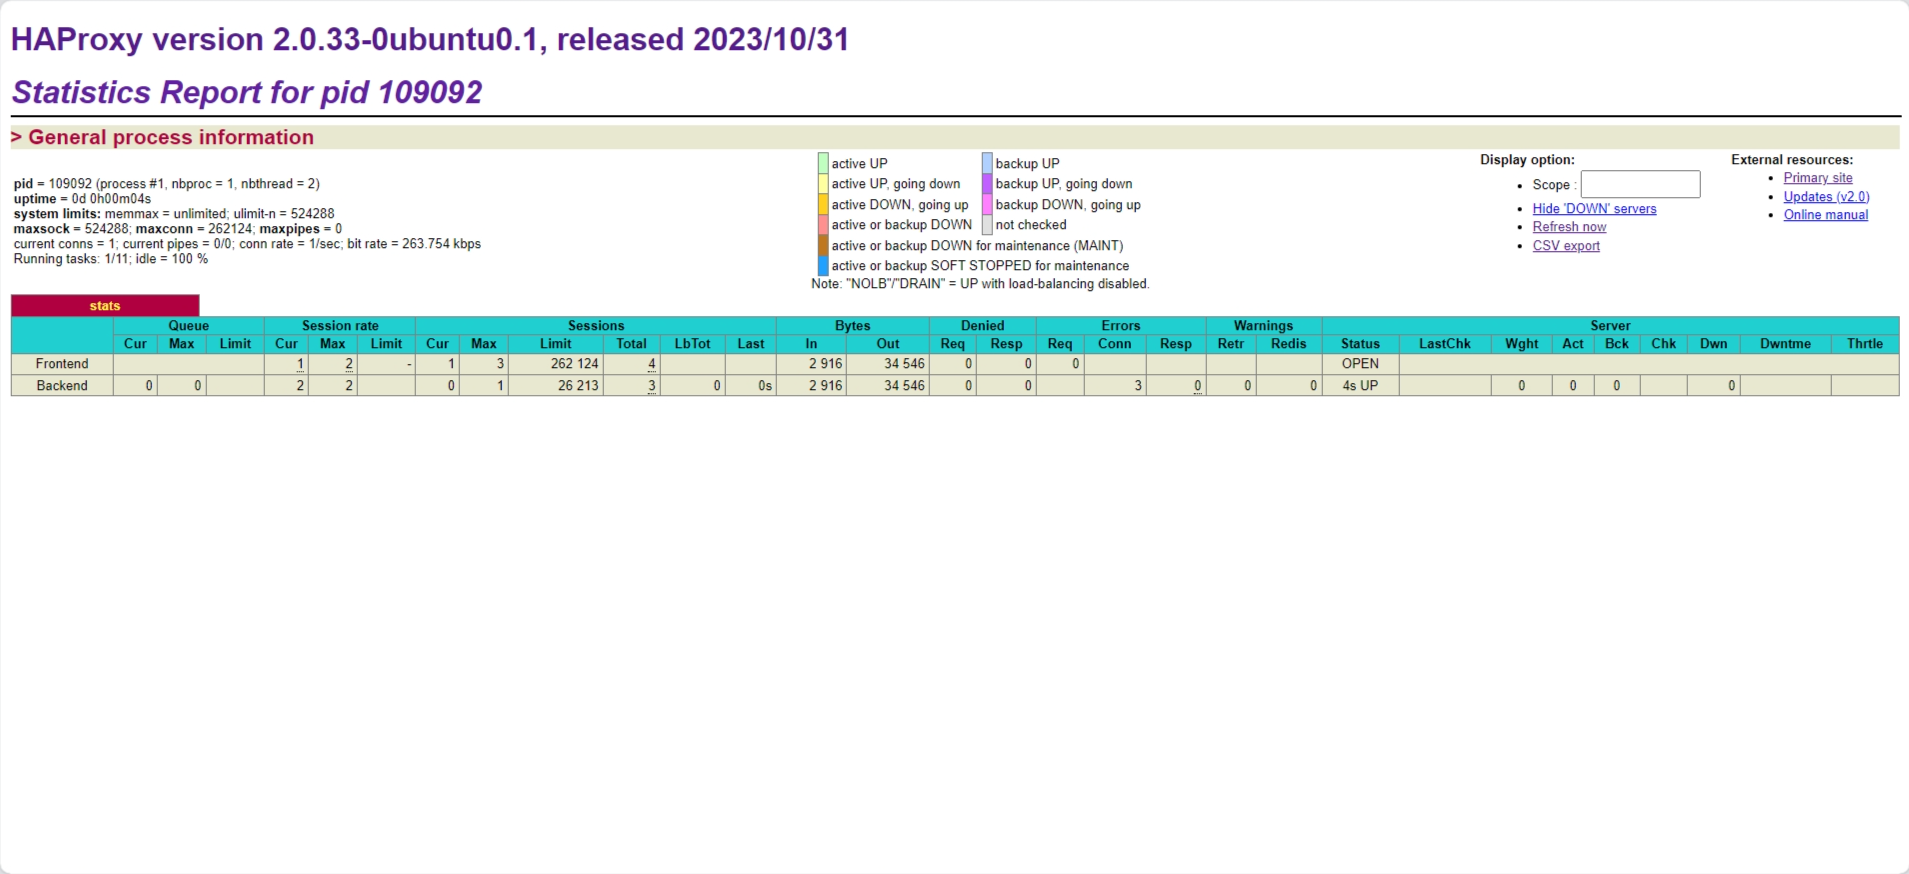
4.4.6.3 编辑 Rsyslog 服务配置文件(如果不生效,reboot)
#在haproxy主机上配置rsyslog服务
[root@web-server ~]# vim /etc/rsyslog.conf
#取消下面两行的注释,实现接收haproxy的日志
module(load="imudp")
input(type="imudp" port="514") ......#备份原有haproxy的配置文件
[root@ubuntu2004 rsyslog.d]#mv 49-haproxy.conf 49-haproxy.conf.bak#加下面行,将haproxy日志再利用UDP或TCP转发到logstash服务器
[root@web-server ~]# vim /etc/rsyslog.d/haproxy.conf
local6.*  @11.0.1.10:514
[root@web-server ~]# systemctl restart haproxy.service rsyslog
4.4.6.4 编辑 Logstash 配置文件
配置logstash监听一个本地端口作为日志输入源,用于接收从rsyslog服务转发过来的haproxy服务器日志
logstash的服务器监听的IP : 端口和rsyslog输出IP和端口必须相同
#确保本机514端口没有被占用
input {syslog { host => "0.0.0.0"port => "514"       #指定监听的UDP/TCP端口,注意普通用户无法监听此端口type => "haproxy"}
}
output {if [type] == 'haproxy' {stdout {codec => "rubydebug" #默认值,可以省略}}
}
4.4.6.5 语法检查
#客户端发送测试数据
[root@web-server ~]#logger -p "local6.info" "This is a test dinginx"[root@logstash ~]# /usr/share/logstash/bin/logstash -f /etc/logstash/conf.d/haproxy-syslog-to-es.conf -r#logstash界面显示
{"type" => "haproxy","@timestamp" => 2024-11-13T14:50:07.000Z,"event" => {"original" => "<182>Nov 13 14:50:07 web-server root: This is a test dinginx"},"message" => "This is a test dinginx",		#显示日志内容"log" => {"syslog" => {"priority" => 182,"facility" => {"name" => "local6","code" => 22},"severity" => {"name" => "Informational","code" => 6}}},"process" => {"name" => "root"},"host" => {"hostname" => "web-server","ip" => "11.0.1.105"},"tags" => [[0] "_cefparsefailure",[1] "_grokparsefailure"],"@version" => "1","service" => {"type" => "system"}
}
4.4.6.6 利用 cerebro 插件查看
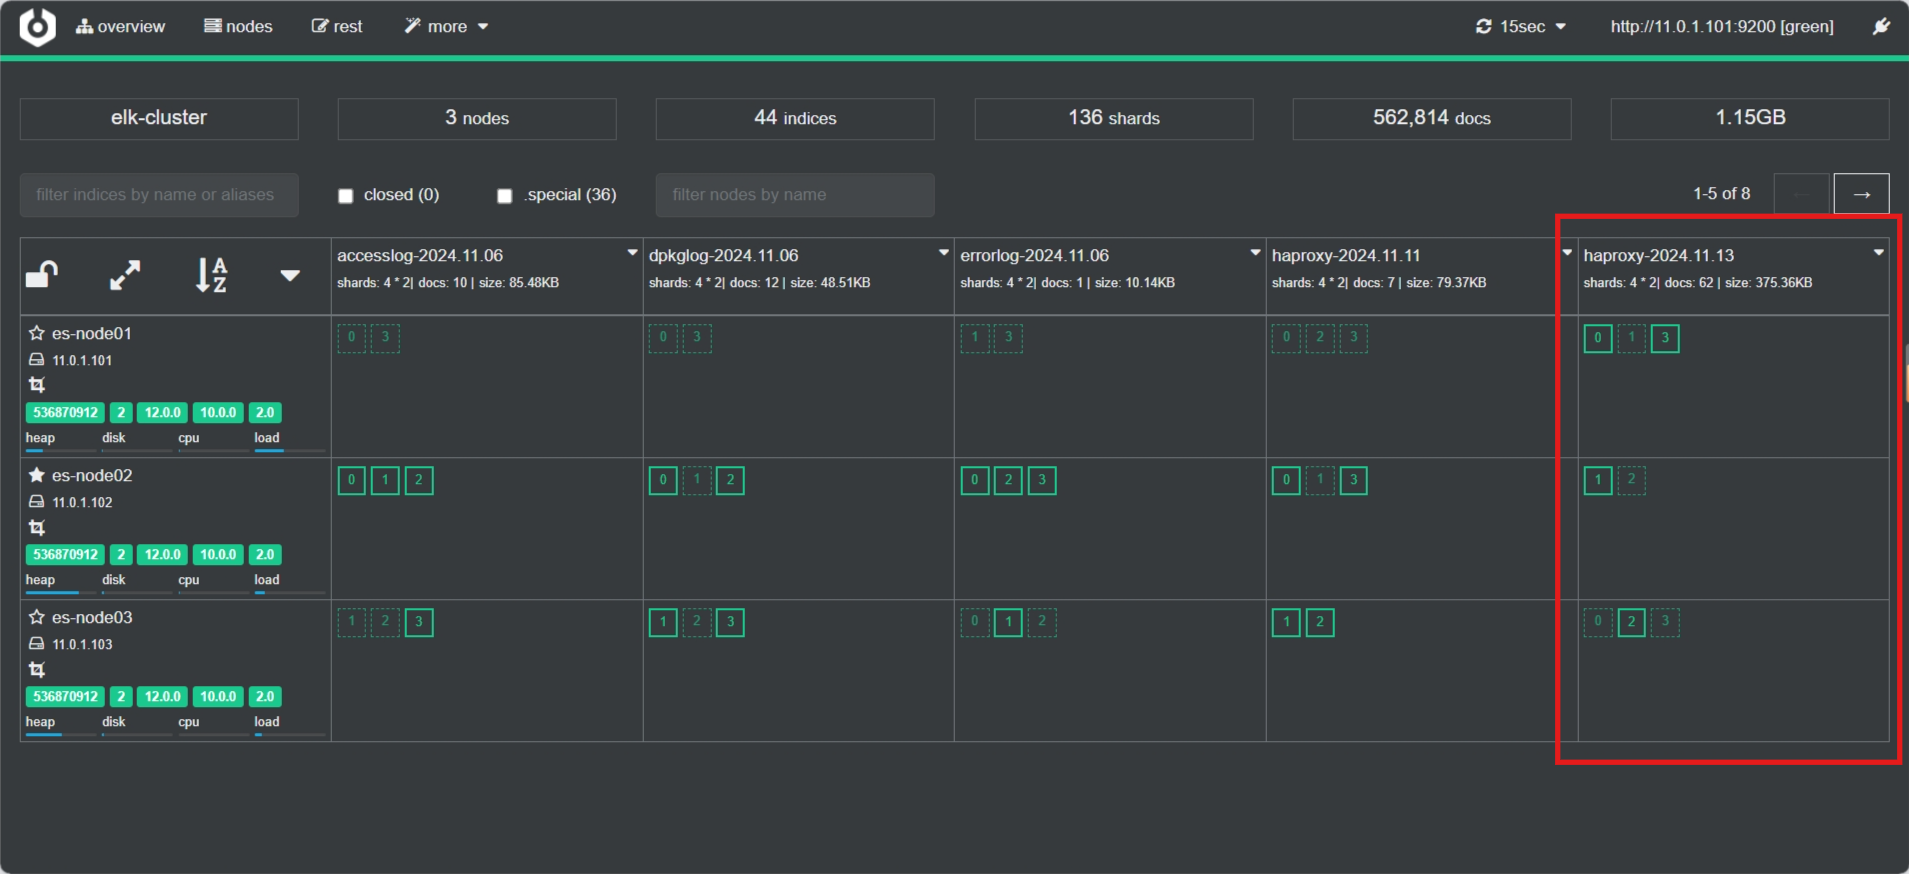
4.4.6.7 Kibana界面添加索引
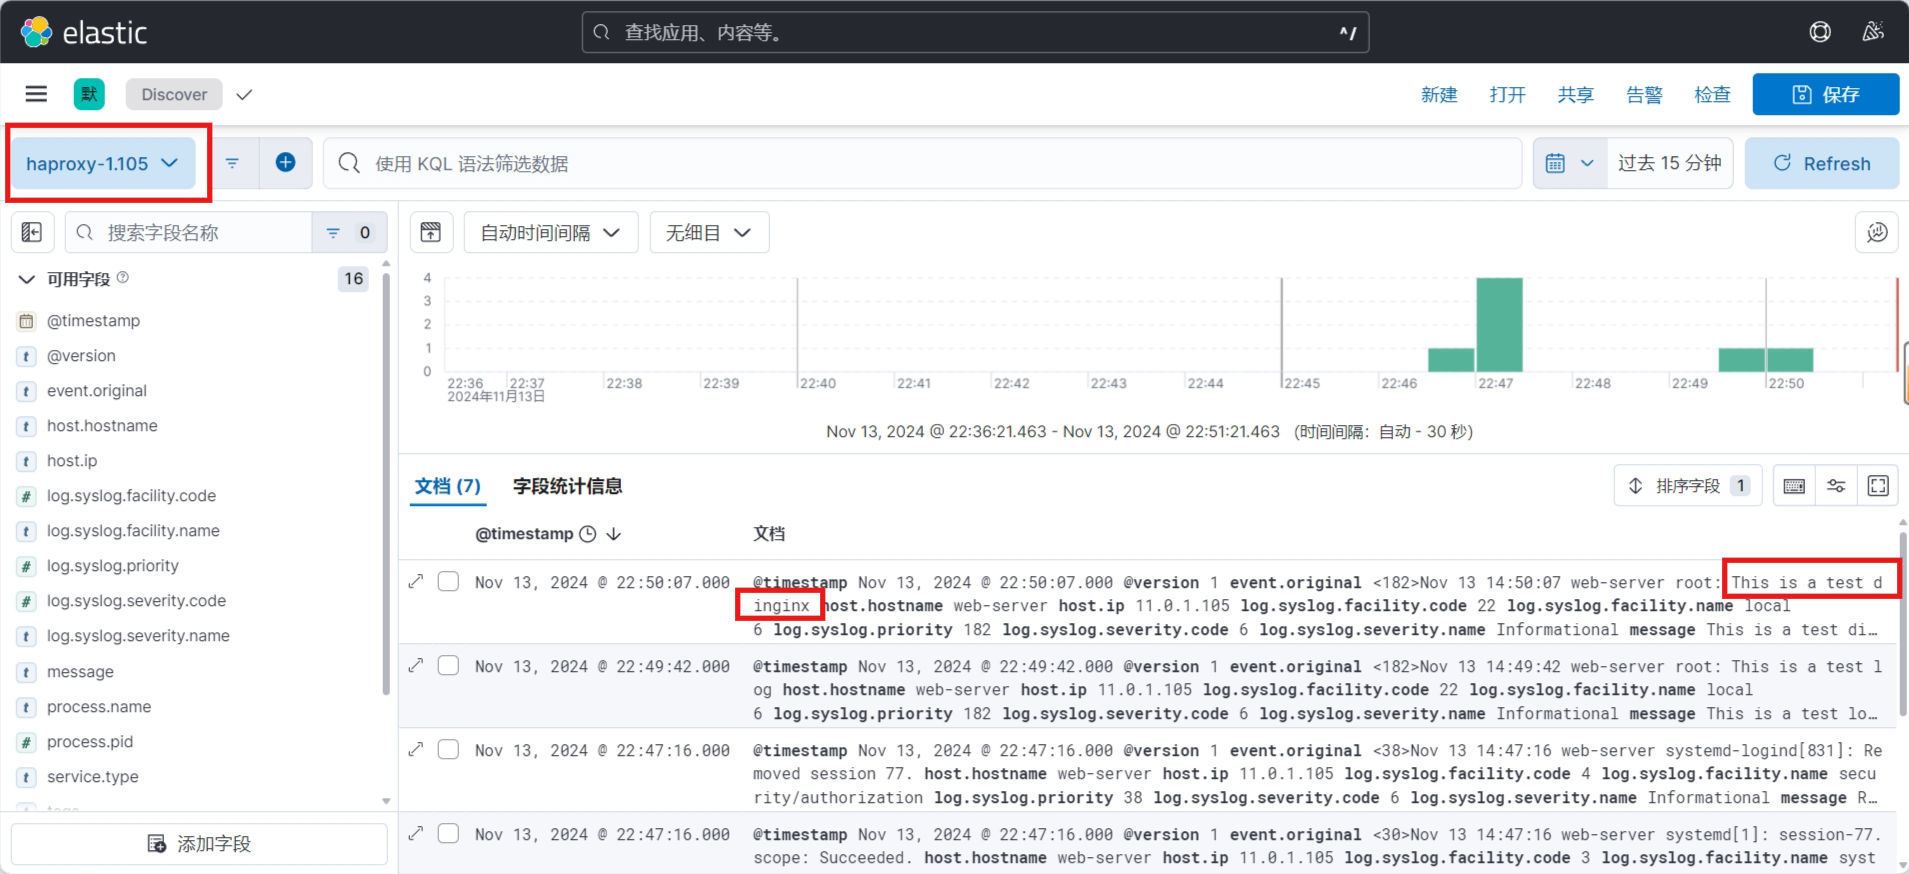
4.4.7 收集应用特定格式的日志输出至 Elasticsearch 并利用 Kibana展示
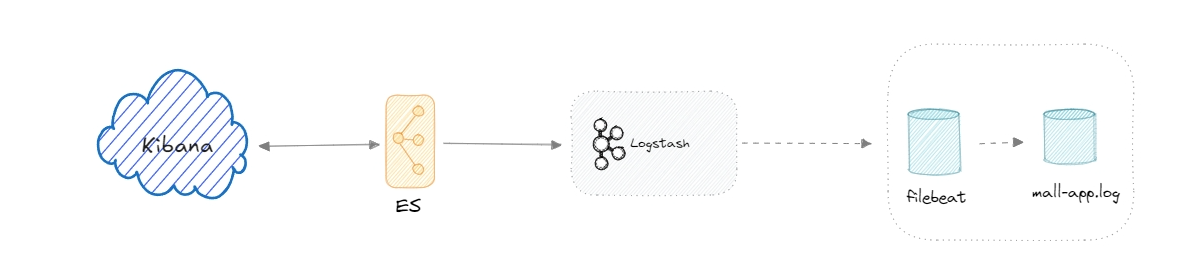
4.4.7.1 应用日志收集项目说明
应用的日志格式如下
[root@web-server ~]#head -n10 mall_app.log
[INFO] 2024-11-11 08:08:12 [www.mall.com] - DAU|9136|加入收藏|2024-11-11 01:05:02
[INFO] 2024-11-11 08:08:14 [www.mall.com] - DAU|5035|搜索|2024-11-11 01:07:01
[INFO] 2024-11-11 08:08:15 [www.mall.com] - DAU|669|使用优惠券|2024-11-11 08:05:13
[INFO] 2024-11-11 08:08:19 [www.mall.com] - DAU|2564|搜索|2024-11-11 08:07:08
[INFO] 2024-11-11 08:08:20 [www.mall.com] - DAU|5294|加入收藏|2024-11-11 02:03:15
[INFO] 2024-11-11 08:08:21 [www.mall.com] - DAU|5663|提交订单|2024-11-11 02:04:04
[INFO] 2024-11-11 08:08:22 [www.mall.com] - DAU|2915|使用优惠券|2024-11-11 01:05:16
[INFO] 2024-11-11 08:08:24 [www.mall.com] - DAU|3125|查看订单|2024-11-11 08:01:03
[INFO] 2024-11-11 08:08:27 [www.mall.com] - DAU|4750|评论商品|2024-11-11 02:03:06
[INFO] 2024-11-11 08:08:31 [www.mall.com] - DAU|8830|使用优惠券|2024-11-11 05:07:02......
将日志收集利用 Logstash 进行格式转换后发给 Elasticsearch,并利用Kibana展示
4.4.7.2 实现过程
4.4.7.2.1 配置 Filebeat
[root@web-server ~]#cat /etc/filebeat/filebeat.yml
# ============================== Filebeat inputs ===============================filebeat.inputs:# Each - is an input. Most options can be set at the input level, so
# you can use different inputs for various configurations.
# Below are the input-specific configurations.# filestream is an input for collecting log messages from files.
- type: log# Change to true to enable this input configuration.enabled: true# Paths that should be crawled and fetched. Glob based paths.paths:- /var/log/mall_app.log#- c:\programdata\elasticsearch\logs\*output.logstash:# Array of hosts to connect to.hosts: ["11.0.1.10:6666"]
4.4.7.2.2 配置 Logstash
root@logstash:~# cat /etc/logstash/conf.d/app_filebeat_filter_es.conf
# Logstash Configuration: app_filebeat_filter_es.confinput {beats {port => 6666}
}filter {# Mutate filter for field manipulationmutate {# Split the 'message' field using the pipe delimiter ('|') to separate valuessplit => { "message" => "|" }# Add parsed fields based on the 'message' array contentsadd_field => {"user_id" => "%{[message][1]}""action" => "%{[message][2]}""time" => "%{[message][3]}"# Uncomment the following line to use dynamic index pattern in @metadata# "[@metadata][target_index]" => "mall-app-%{+YYYY.MM.dd}"}# Remove the original 'message' field to clean up the eventremove_field => ["message"]# Convert field data types for 'user_id', 'action', and 'time'convert => {"user_id" => "integer""action" => "string""time" => "string"}}# Date filter to parse and standardize the timestampdate {match => ["time", "yyyy-MM-dd HH:mm:ss"]target => "@timestamp"timezone => "Asia/Shanghai"}
}output {# Debugging output to the console for verificationstdout {codec => rubydebug}# Elasticsearch output configurationelasticsearch {hosts => ["11.0.1.101:9200", "11.0.1.102:9200", "11.0.1.103:9200"]# Use dynamic index pattern for daily indicesindex => "mall-app-%{+YYYY.MM.dd}"# To use the metadata-based index pattern, uncomment the line below# index => "%{[@metadata][target_index]}"template_overwrite => true}
}
root@logstash:~# /usr/share/logstash/bin/logstash -f /etc/logstash/conf.d/app_filebeat_filter_es.conf -r#logstash展示内容......{"event" => {"original" => "[INFO] 2024-11-13 23:59:55 [www.mall.com] - DAU|9008|加入收藏|2024-11-13 13:56:26"},"action" => "加入收藏","tags" => [[0] "beats_input_codec_plain_applied"],"host" => {"name" => "web-server.dinginx.org"},"ecs" => {"version" => "8.0.0"},"log" => {"offset" => 14313461,"file" => {"path" => "/var/log/mall_app.log"}},"time" => "2024-11-13 13:56:26","@timestamp" => 2024-11-13T05:56:26.000Z,"agent" => {"id" => "3f61a017-e6f3-4984-974c-a70d166d20cf","type" => "filebeat","version" => "8.14.3","ephemeral_id" => "583bad06-66ad-4748-b31b-694e8ee8da0b","name" => "web-server.dinginx.org"},"input" => {"type" => "log"},"user_id" => "9008","@version" => "1"
}
4.4.7.2.3 利用 cerebro 插件查看
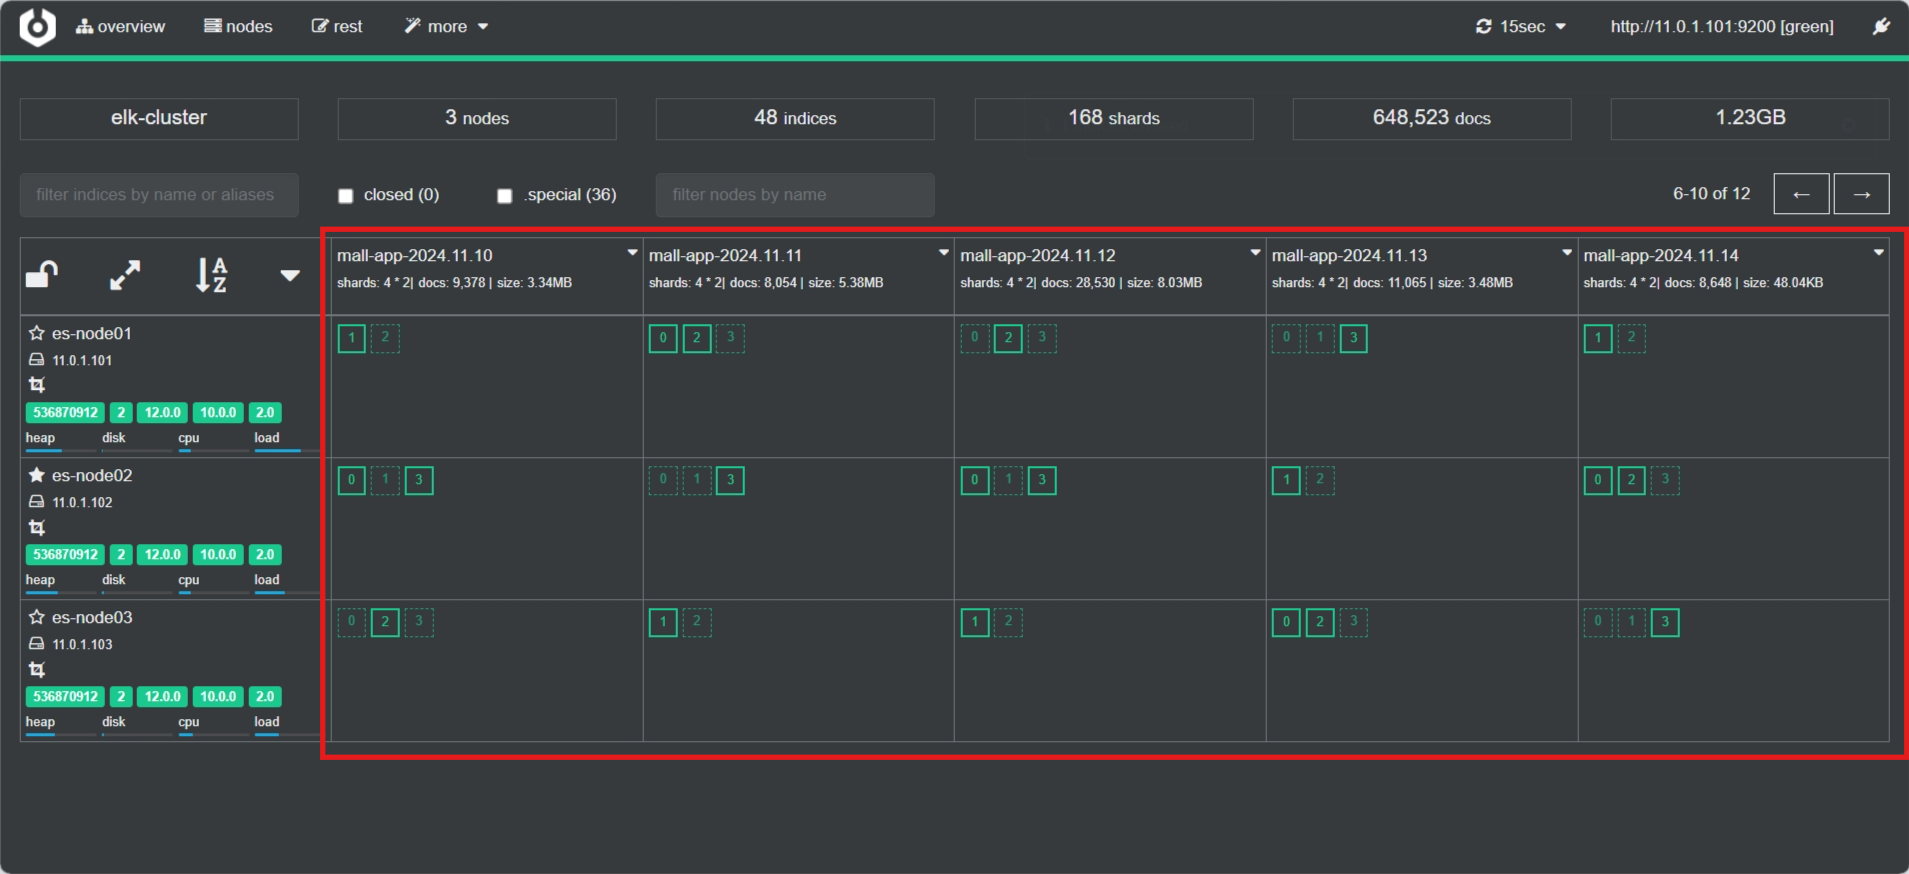
4.4.7.2.4 Kibana 创建索引模式
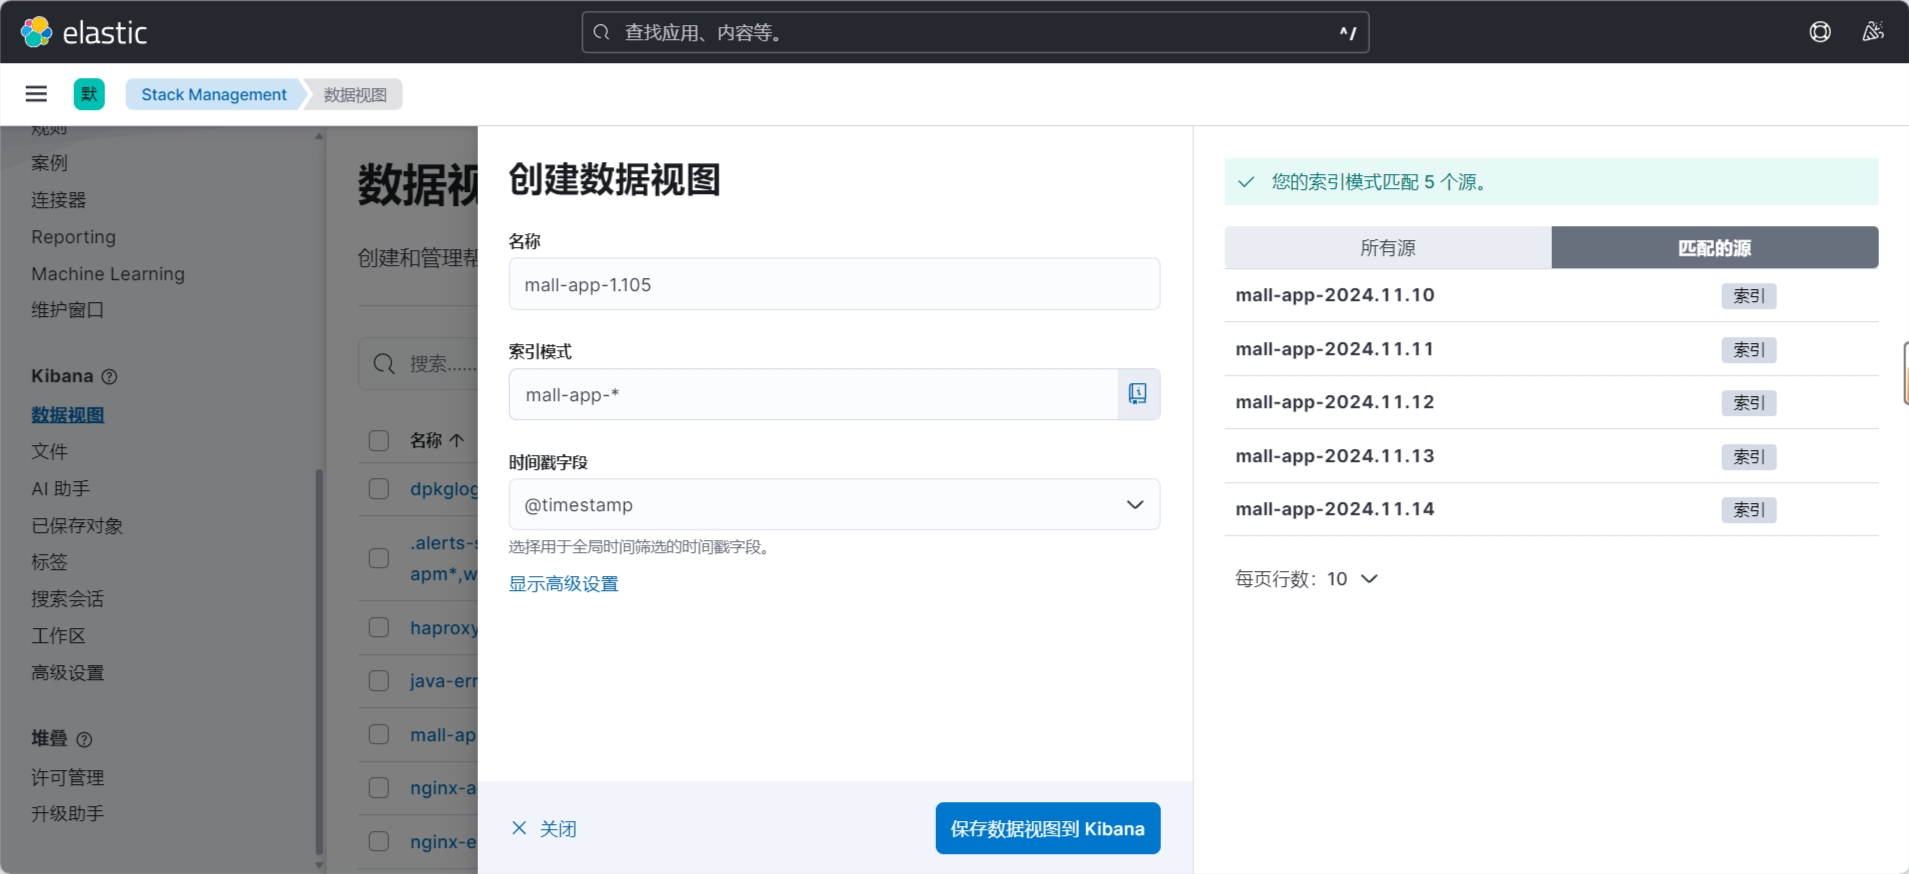
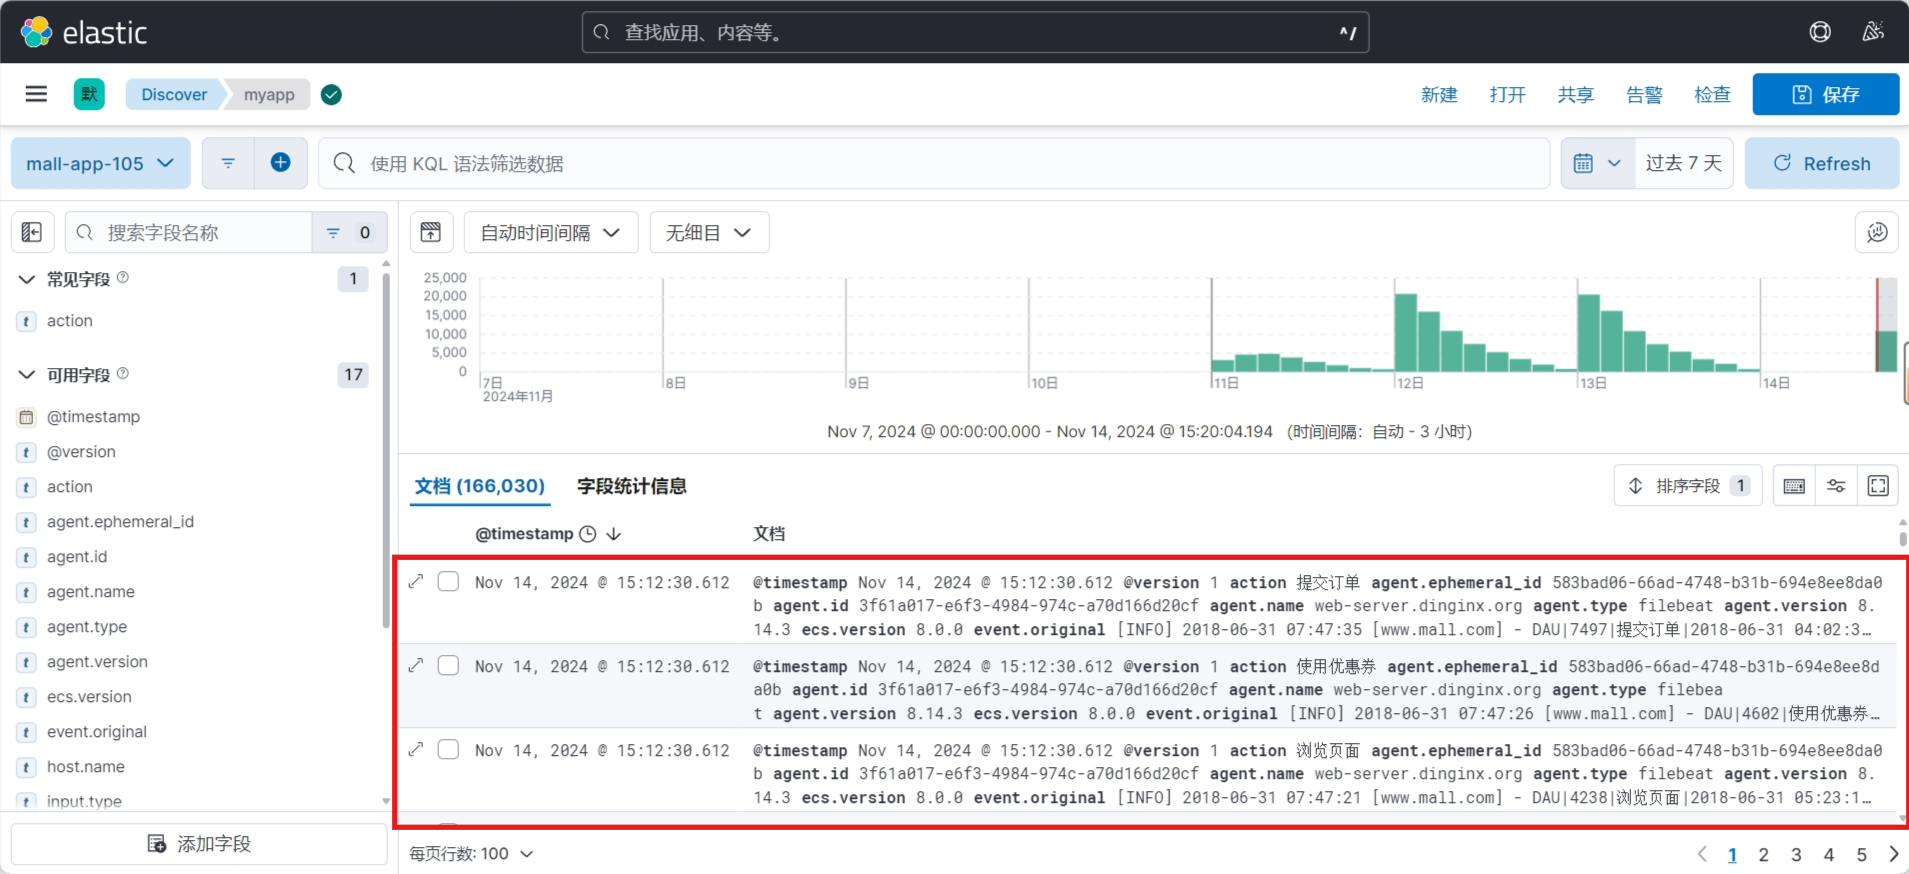
注意:因为是历史数据,所以需要选择正确的时间段
4.4.7.2.5 Kibana 展示(8.X)
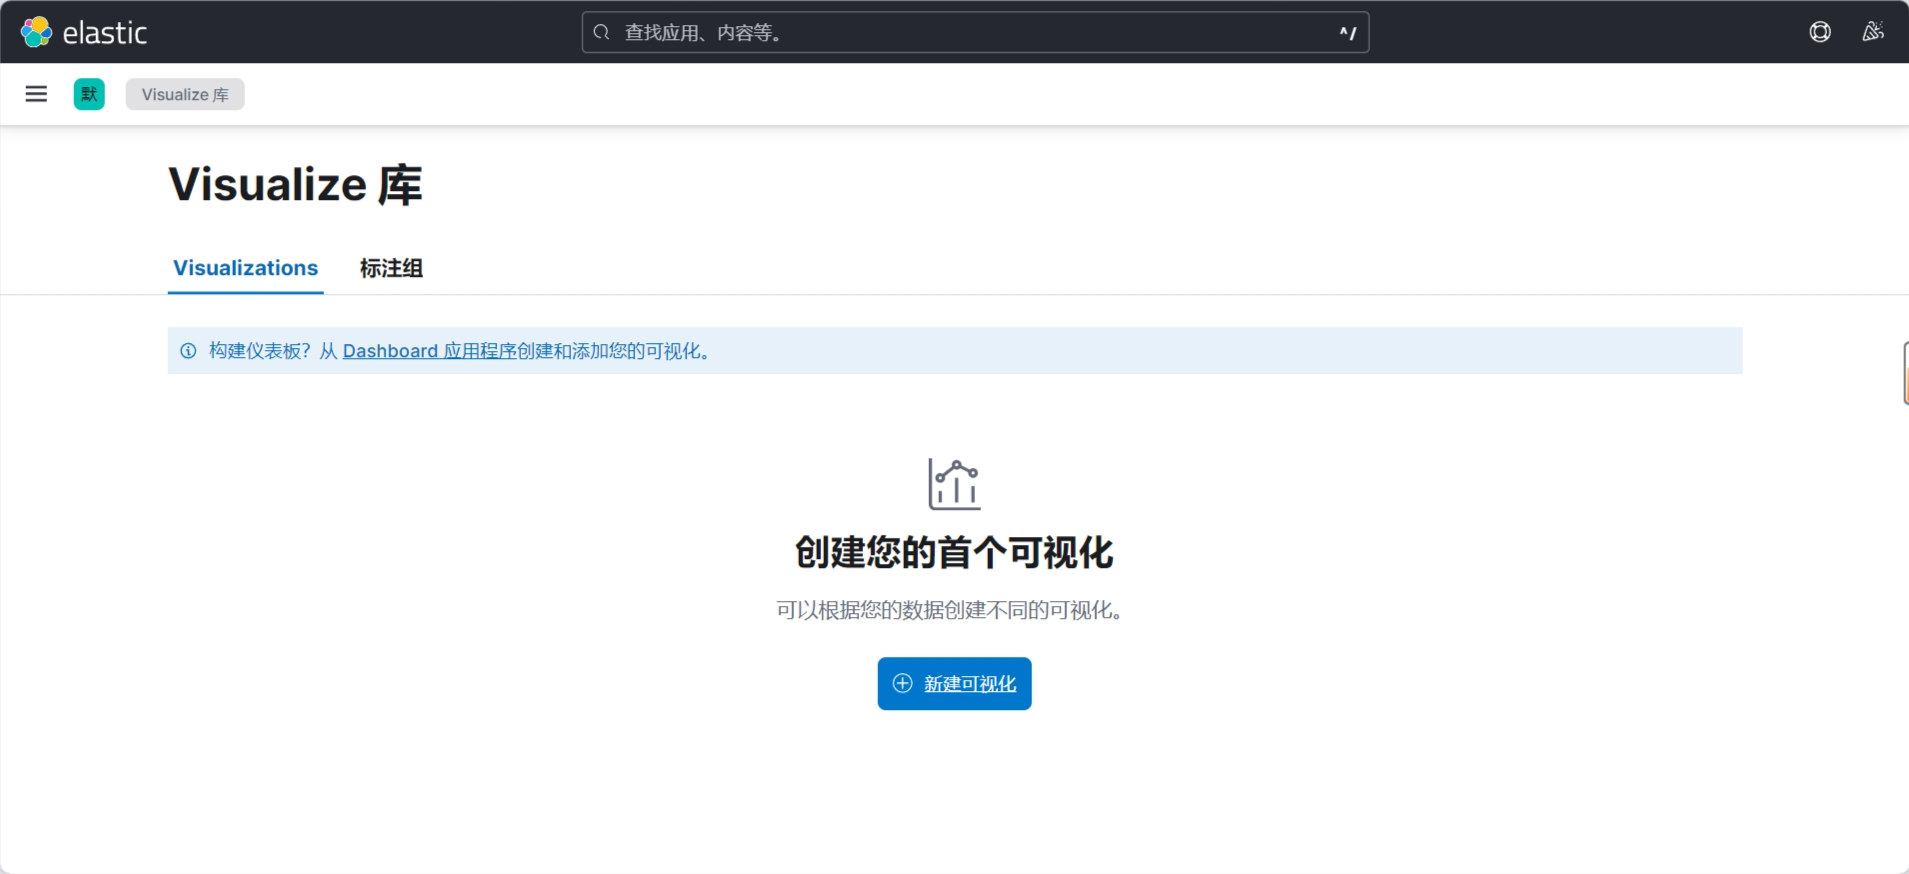
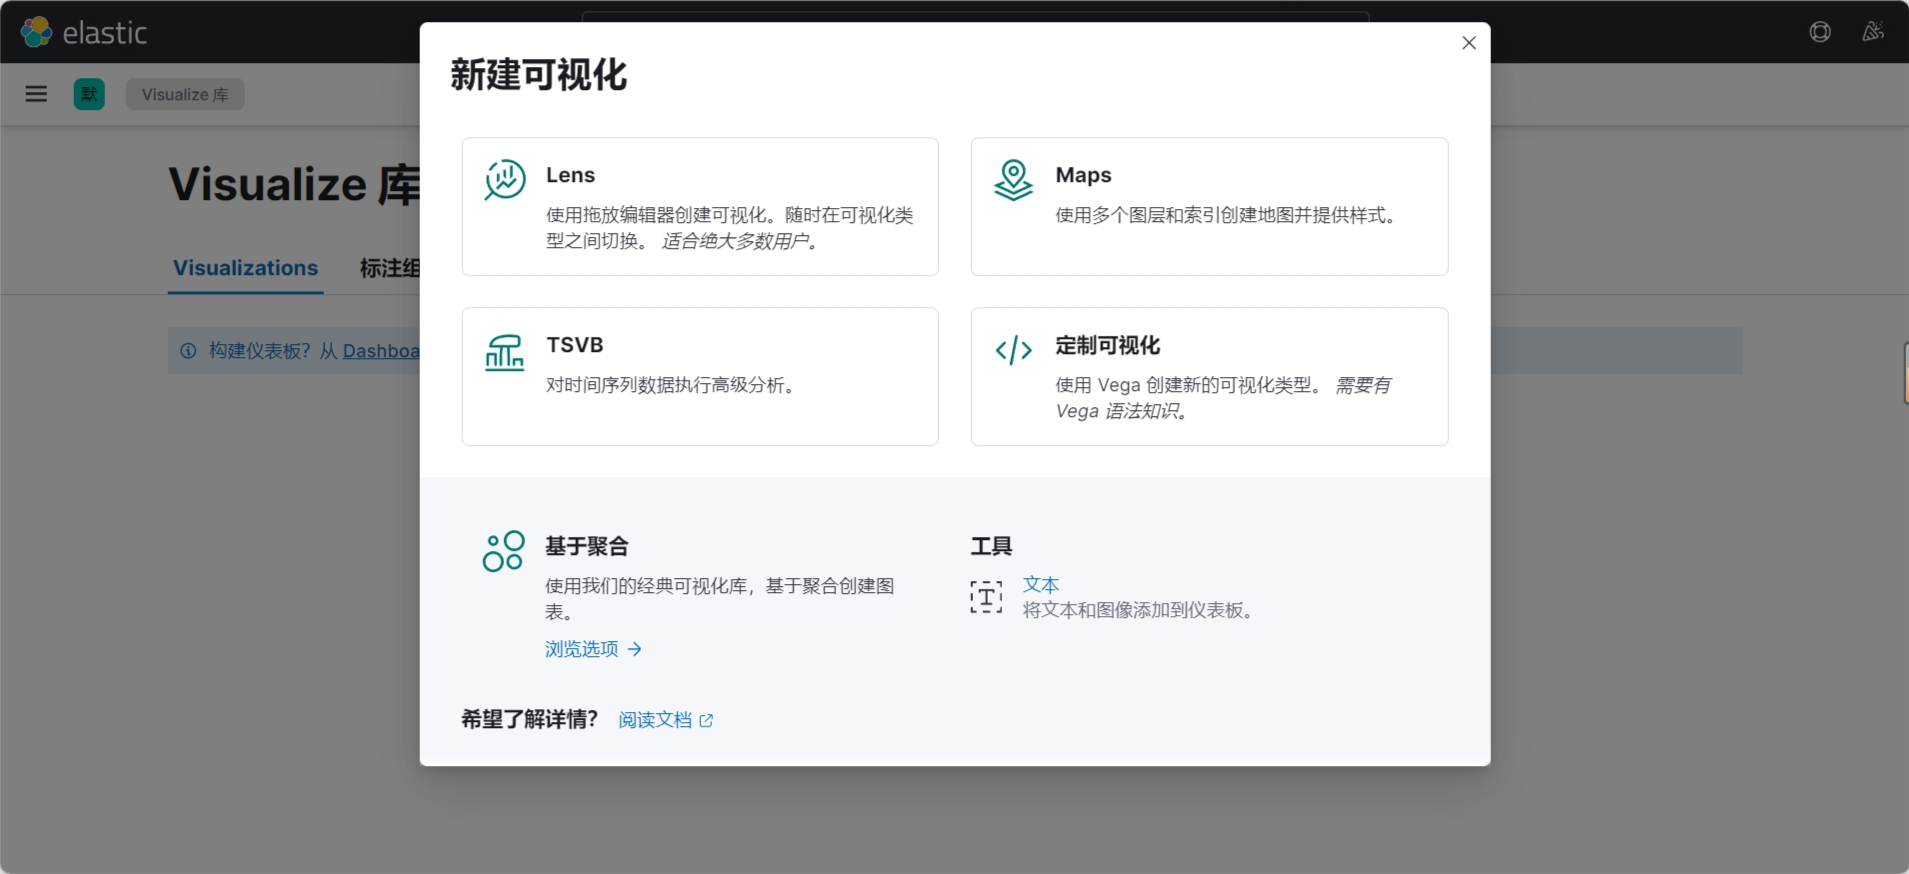
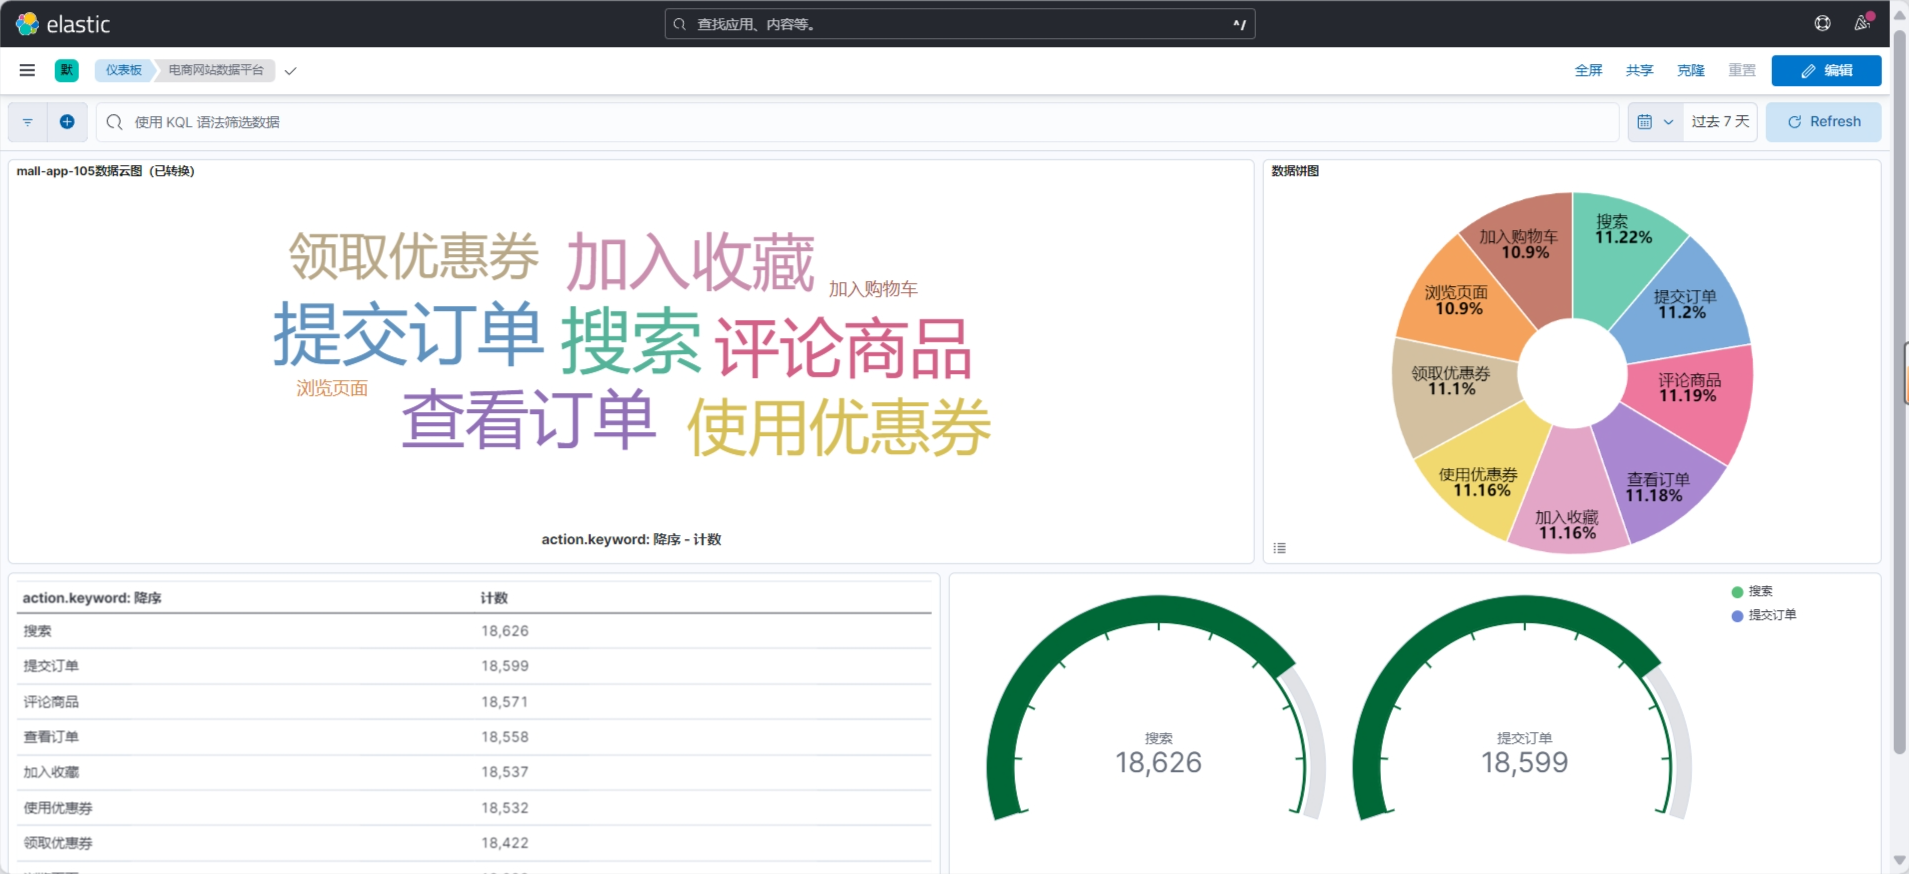
共享显示仪表盘
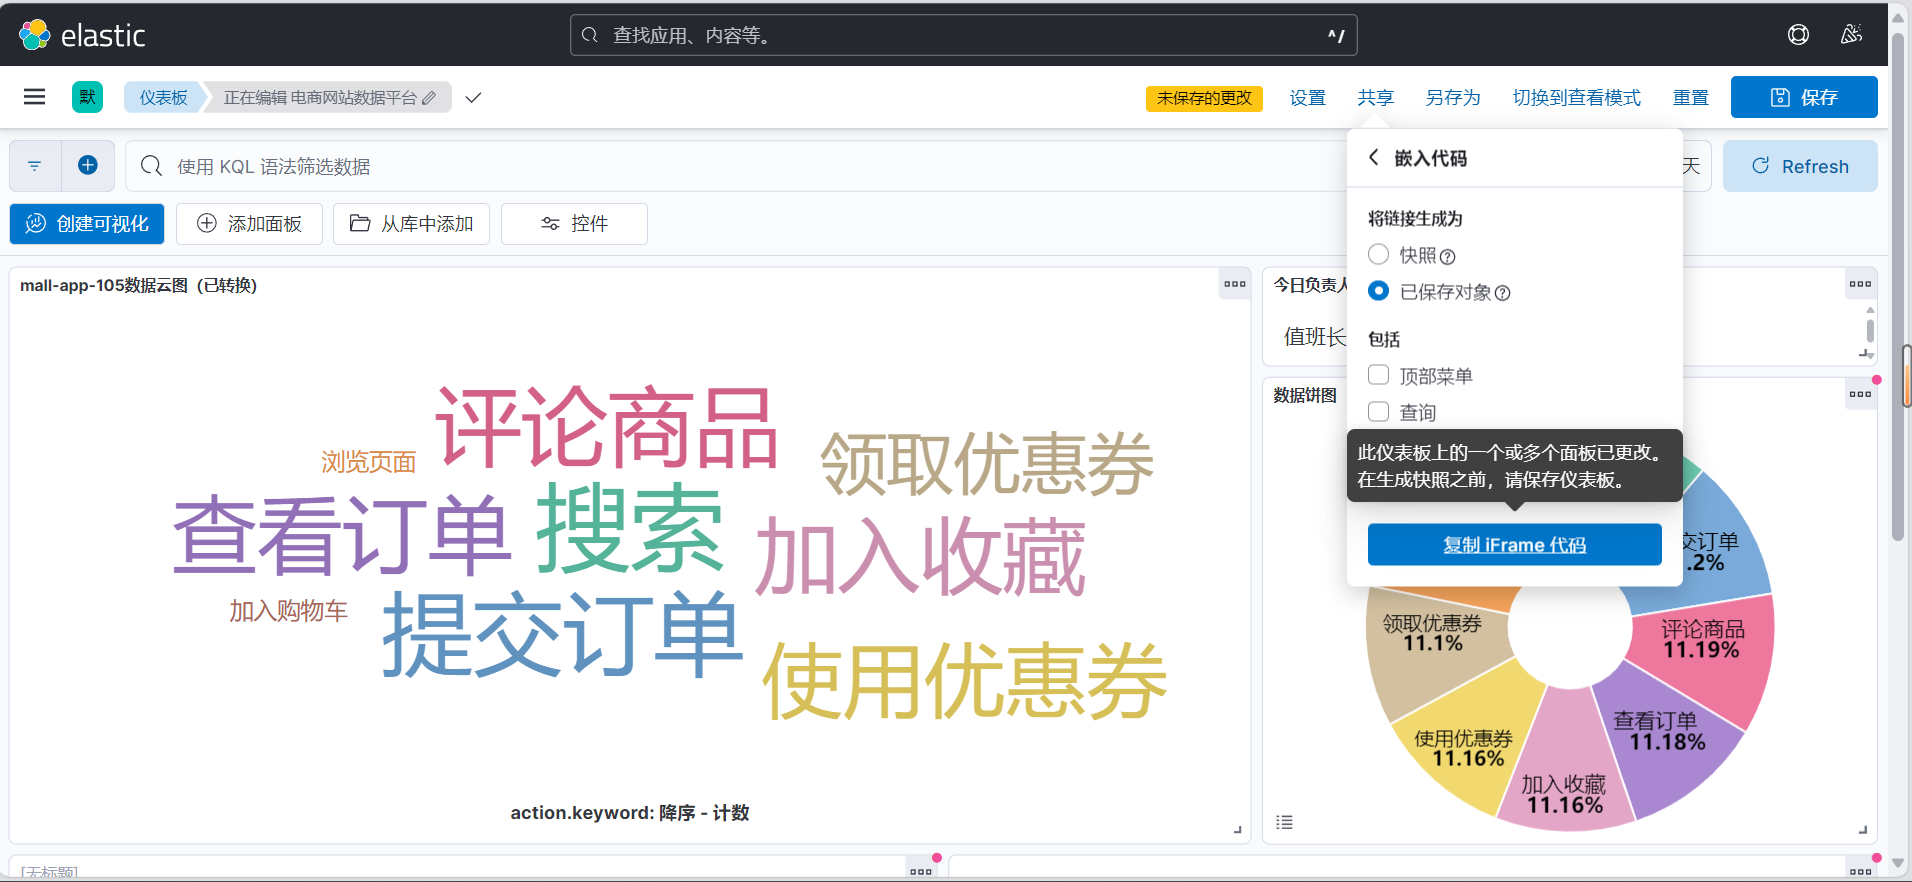
创建html文件,输入代码内容(适当调整显示宽度、高度)
<! kibana文件内容如下 --><iframe src="http://11.0.1.104:5601/app/dashboards#/view/a4bced00-16b4-430b-897a-a4c667b4131d?embed=true&_g=(refreshInterval%3A(pause%3A!t%2Cvalue%3A60000)%2Ctime%3A(from%3Anow-7d%2Fd%2Cto%3Anow))&hide-filter-bar=true" height="600" width="1450"></iframe>
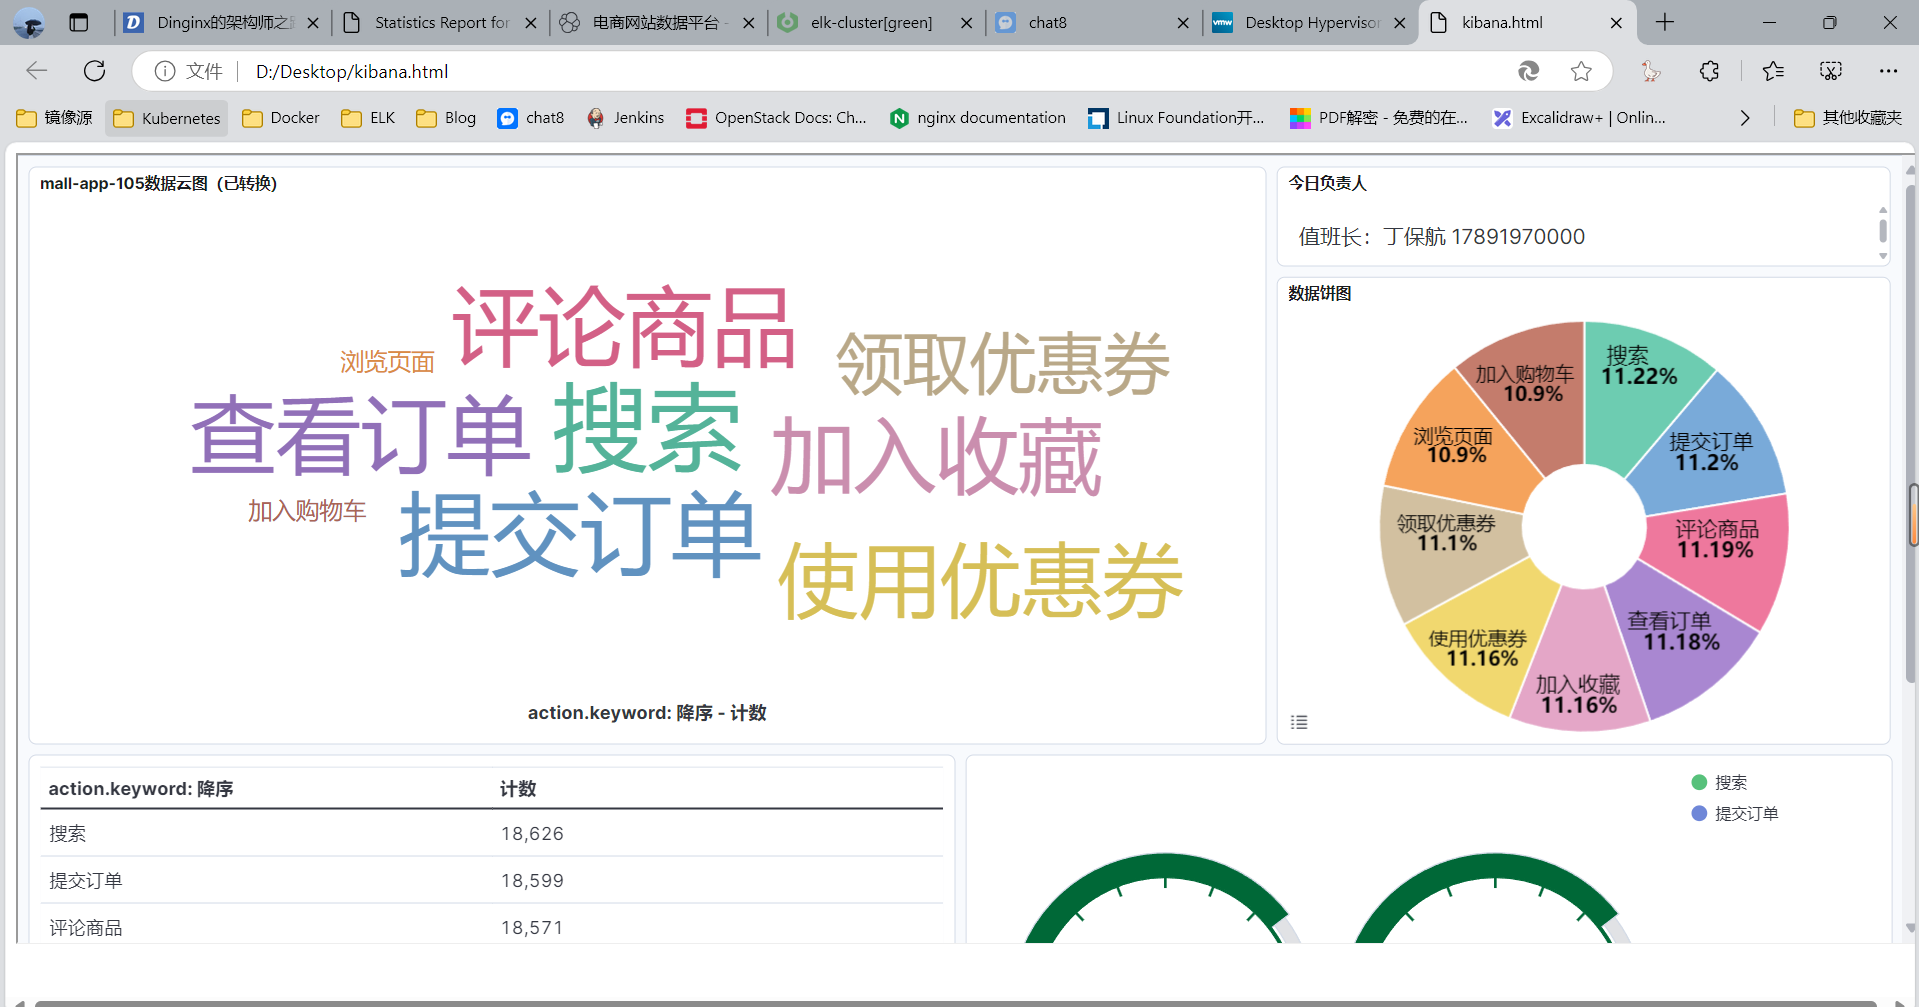
4.4.7.2.6 开启访问认证功能
#开启认证功能
[root@kibana01 ~]#apt install -y nginx
[root@kibana01 ~]#apt install -y apache2-utils#kibana配置
[root@kibana01 ~]#vim /etc/kibana/kibana.yml ......# To allow connections from remote users, set this parameter to a non-loopback address.
#server.host: "0.0.0.0"
server.host: "127.0.0.1"#dns服务器添加地址解析
[root@centos7 ~]# vim /var/named/dinginx.org.zone $TTL 1D
@       IN SOA  master admin (1       ; serial1D      ; refresh1H      ; retry1W      ; expire3H )    ; minimumNS       master
master      A    11.0.1.7
t1          A    11.0.1.105
www         A    11.0.1.10
kibana      A    11.0.1.104
[root@centos7 ~]# rndc reload#nginx配置
[root@kibana01 ~]#cat /etc/nginx/conf.d/kibana.conf
server {listen 80;server_name kibana.dinginx.org;location / {proxy_pass http://127.0.0.1:5601/;auth_basic           "kibana site";auth_basic_user_file conf.d/htpasswd;}
}#创建htpasswd认证密码
[root@kibana01 ~]#htpasswd -bc /etc/nginx/conf.d/htpasswd admin 123456#重启服务
nginx -s reload
systemctl restart kibana.service
访问测试
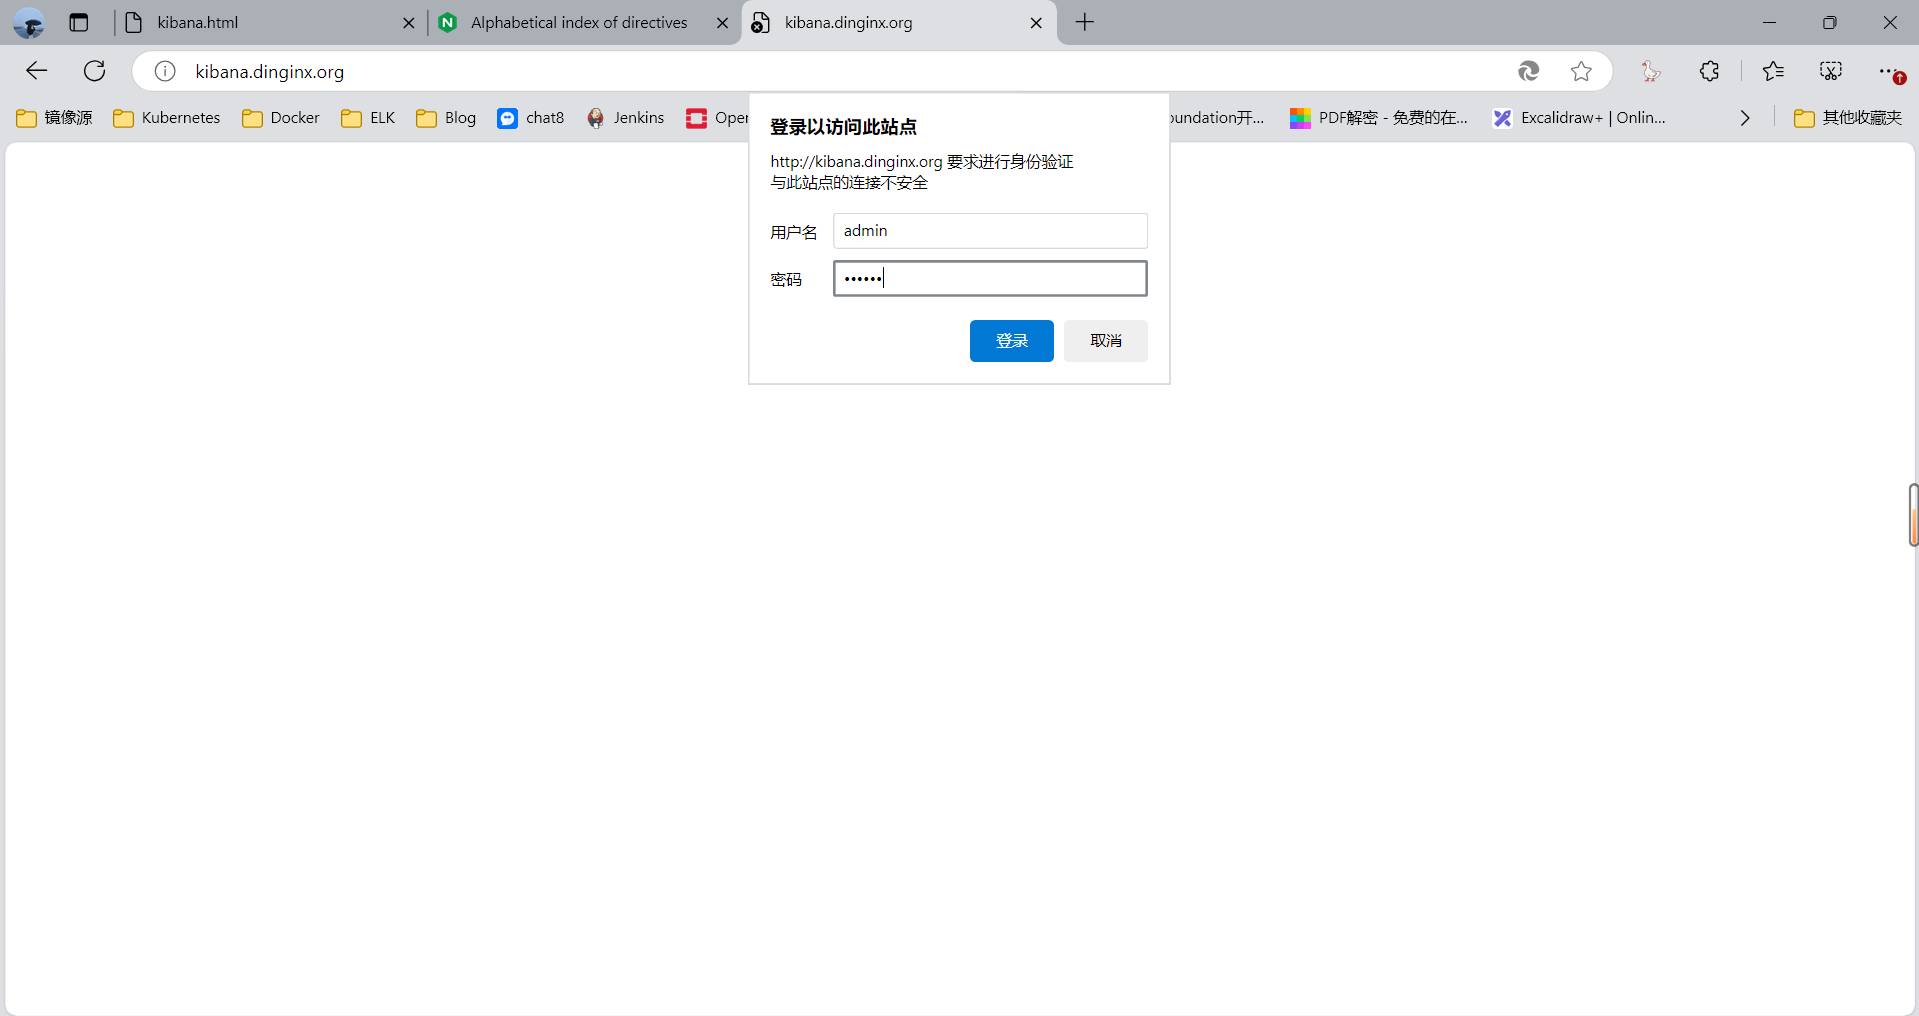
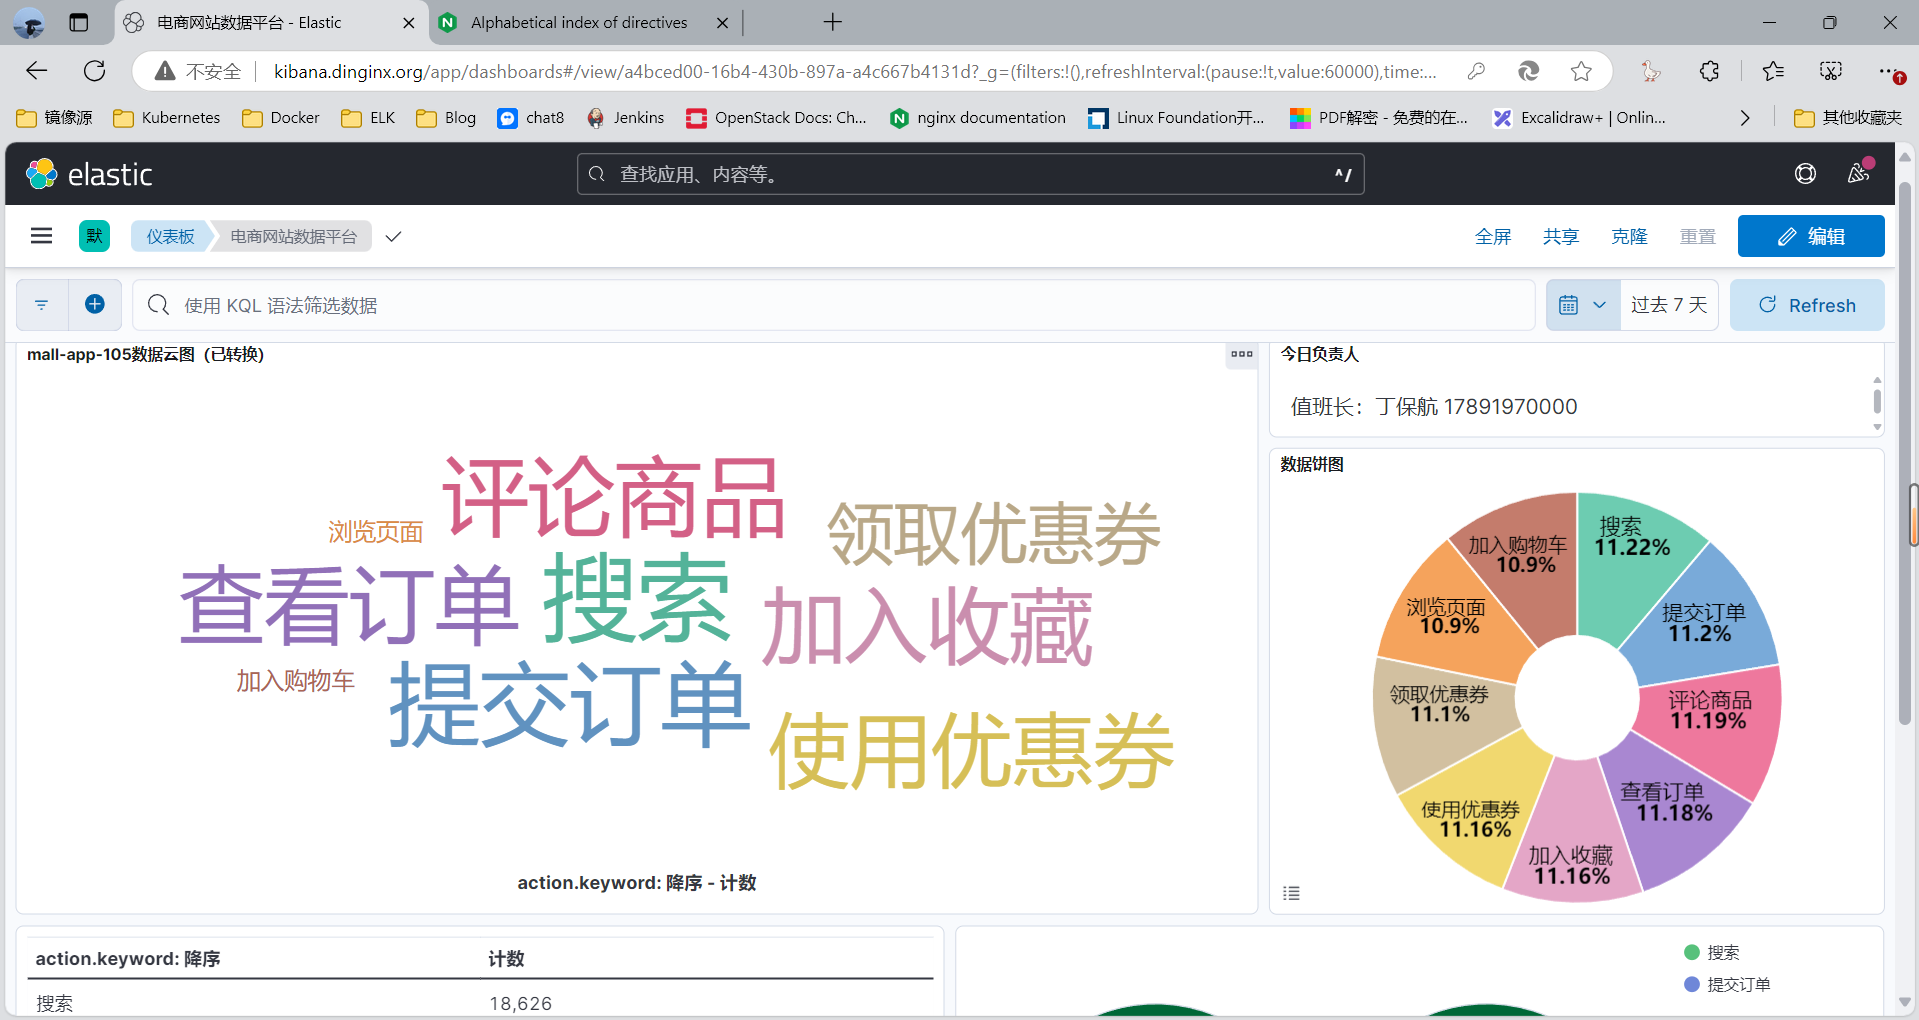
5 Kibana 图形显示
5.1 Kibana 介绍
Kibana 是一款开源的数据分析和可视化平台,它是 Elastic Stack 成员之一,设计用于和 Elasticsearch 协作,可以使用 Kibana 对 Elasticsearch 索引中的数据进行搜索、查看、交互操作,您可以很方便的利用图表、表格及地图对数据进行多元化的分析和呈现。
Kibana 可以使大数据通俗易懂。基于浏览器的界面便于您快速创建和分享动态数据仪表板来追踪Elasticsearch 的实时数据变化。
Kibana 基于 TypeScript 语言开发
Kibana 官方下载链接:
https://www.elastic.co/cn/downloads/kibana
https://www.elastic.co/cn/downloads/past-releases#kibana#国内软件源
https://mirrors.tuna.tsinghua.edu.cn/elasticstack/8.x/
https://demo.elastic.co/
5.2 安装并配置 Kibana
可以通过包或者二进制的方式进行安装,可以安装在独立服务器,或者也可以和elasticsearch的主机安装在一起
注意: Kibana的版本要和 Elasticsearch 相同的版本,否则可能会出错
官方说明:https://github.com/elastic/kibana
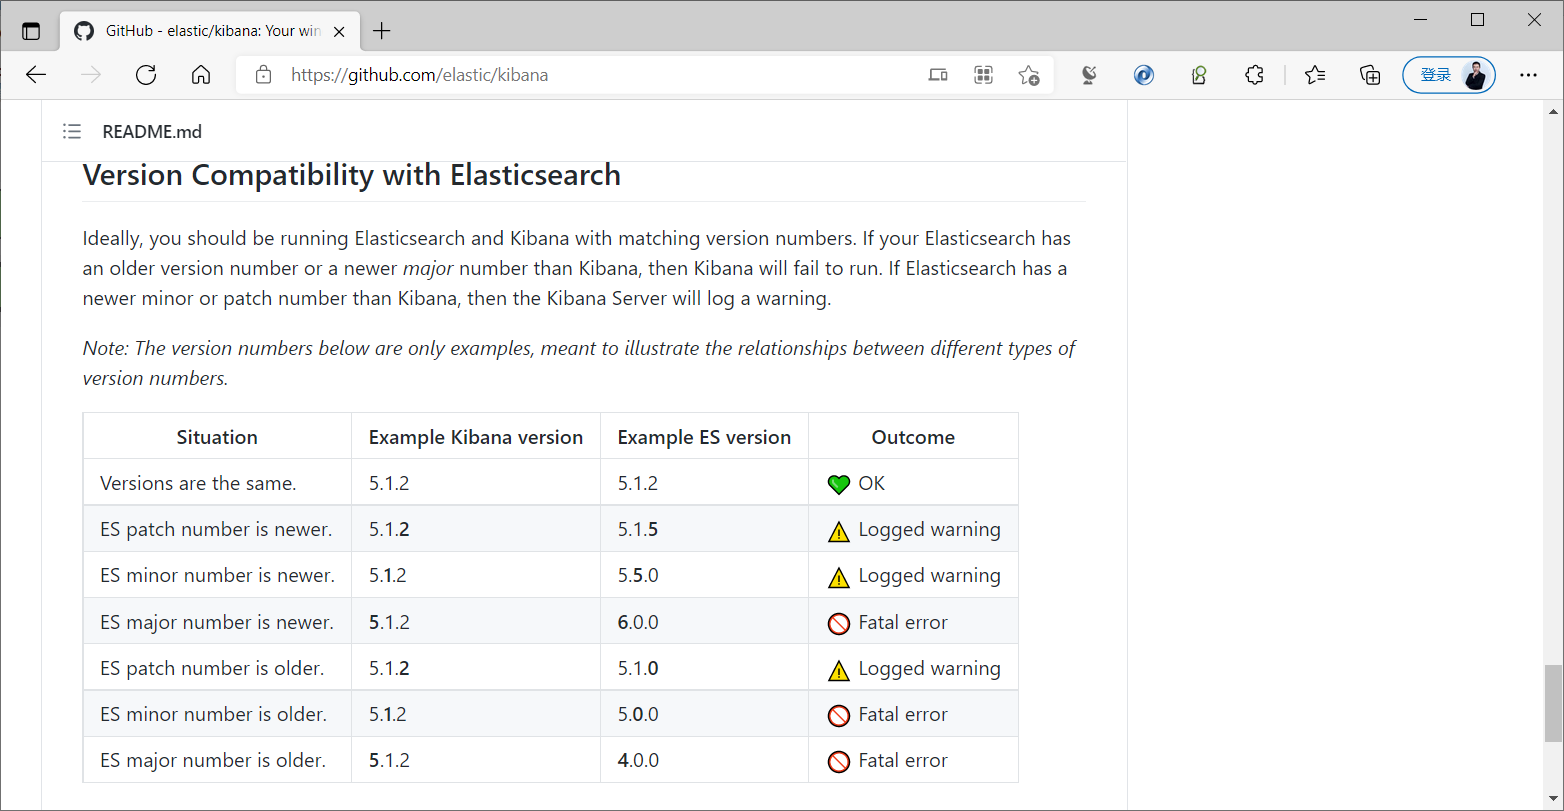
5.2.1 下载安装
基于性能原因,建议将Kibana安装到独立节点上,而非和ES节点复用
下载链接
https://www.elastic.co/cn/downloads/kibana
https://mirrors.tuna.tsinghua.edu.cn/elasticstack/
Ubuntu 安装 kibana安装
#地址规划,所有实验环境节点
cat >> /etc/hosts <<EOF
11.0.1.104 kibana01.dinginx.org
11.0.1.105 kibana02.dinginx.org
EOF#下载包
[root@kibana01 ~]#ll -h kibana-8.14.3-amd64.deb
-rw-r--r-- 1 root root 326M Sep 23 21:57 kibana-8.14.3-amd64.deb
[root@kibana01 ~]#dpkg -i kibana-7.6.2-amd64.deb##centos环境安装
[root@es-node1 ~]#wget https://mirrors.tuna.tsinghua.edu.cn/elasticstack/7.x/yum/7.6.2/kibana-7.6.2-x86_64.rpm
[root@es-node1 ~]#yum localinstall kibana-7.6.2-x86_64.rpm#获取进程pid
#方法一
[root@kibana01 ~]#systemctl show --property=MainPID kibana.service
MainPID=121978#方法二不适应systemd的方式管理进程,需发送&给$!才可以返回PID的值
[root@kibana01 ~]#sleep 10 &
[1] 122231
[root@kibana01 ~]#echo $!
122231
5.2.2 修改配置
[root@kibana01 ~]#grep '^[a-z]' /etc/kibana/kibana.yml
server.port: 5601		 #监听端口,此为默认值
server.host: "0.0.0.0"		#修改此行的监听地址,默认为localhost,即:127.0.0.1:5601
server.publicBaseUrl: "http://kibana.dinginx.org"		#8.X版本新添加配置,默认被注释,会显示下面提示
elasticsearch.hosts: ["http://11.0.1.101:9200","http://11.0.1.102:9200","http://11.0.1.103:9200"]	#修改此行,指向ES任意服务器地址或多个节点地址实现容错,默认为localhost
logging:appenders:file:type: filefileName: /var/log/kibana/kibana.loglayout:type: jsonroot:appenders:- default- filepid.file: /run/kibana/kibana.pid	#进程pid路径
i18n.locale: "zh-CN"		 #修改此行,使用"zh-CN"显示中文界面,默认英文
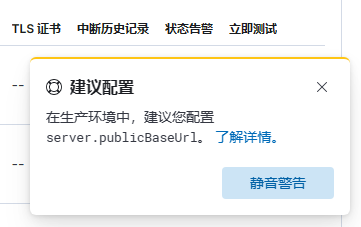
访问测试
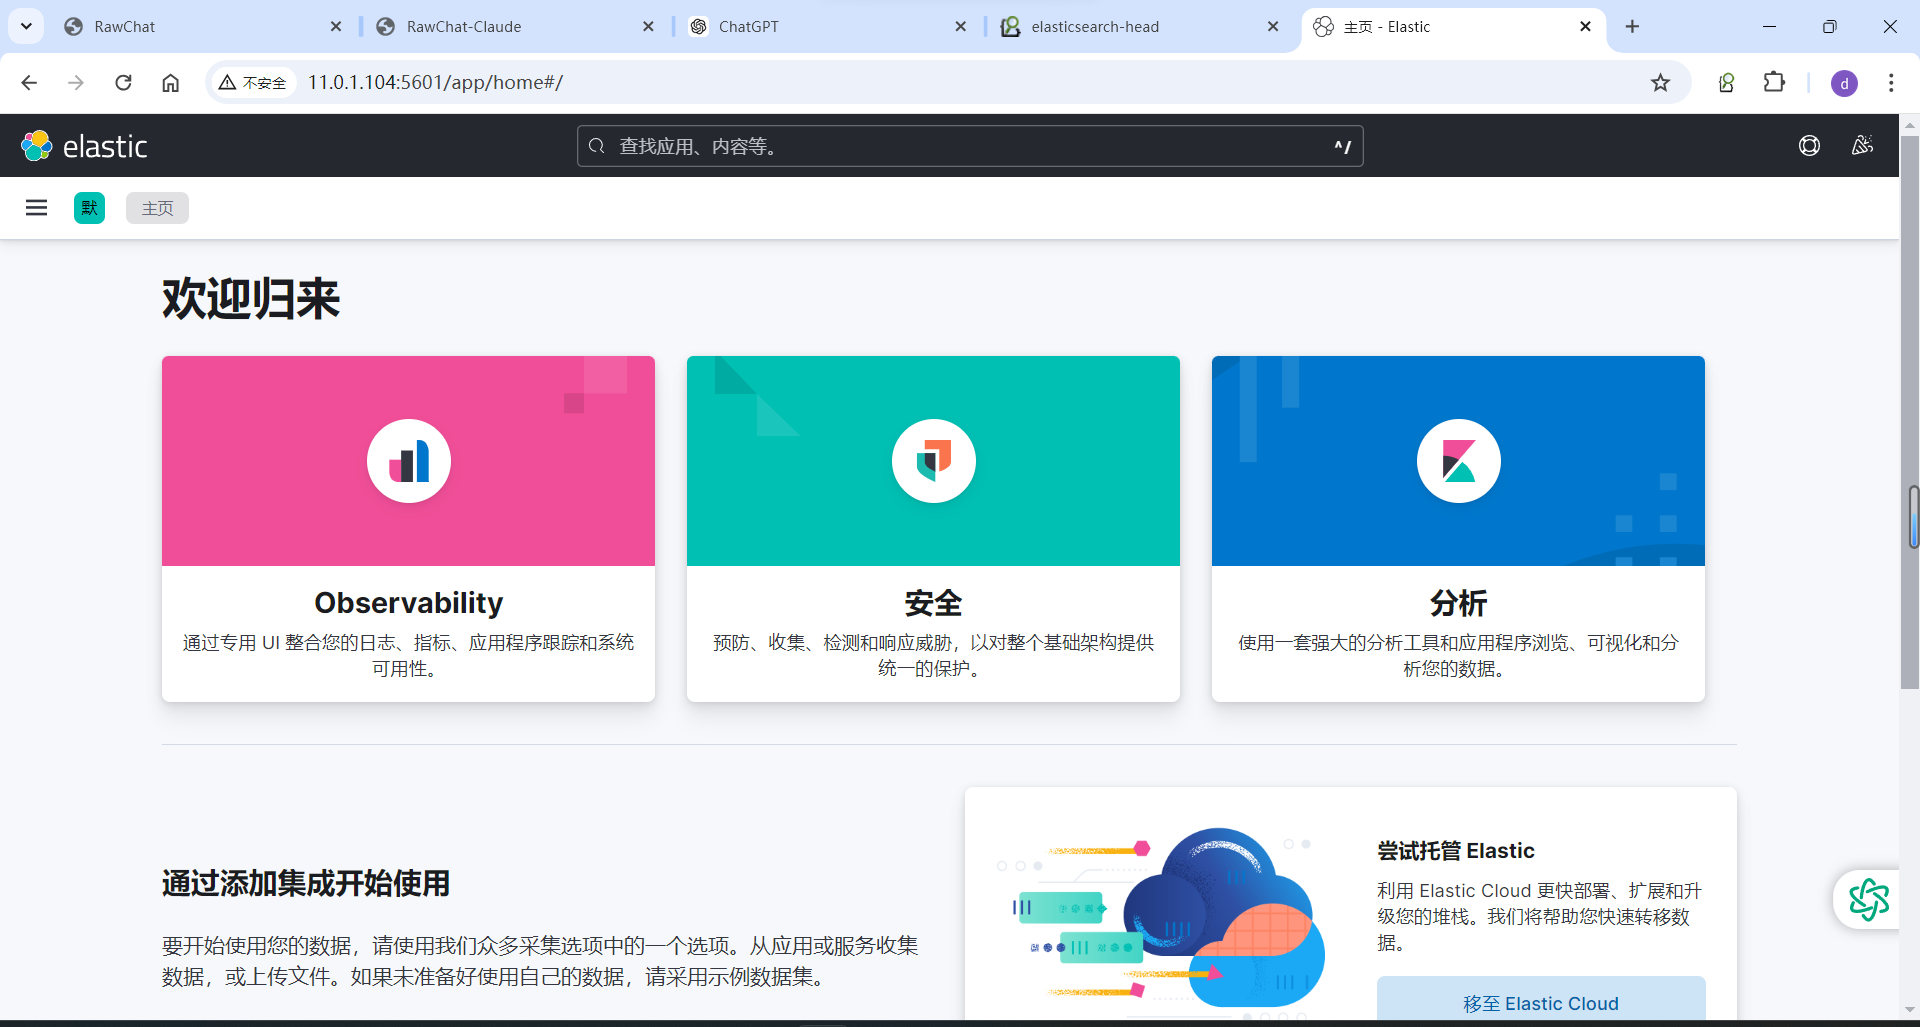
5.2.3 启动 Kibana 服务并验证
[root@kibana01 ~]#systemctl enable --now kibana.service
[root@kibana01 ~]#systemctl is-active kibana.service
active[root@kibana01 ~]#ps aux|grep kibana
kibana      9152  6.8 13.3 22727428 532220 ?     Ssl  10:47   0:56 /usr/share/kibana/bin/../node/bin/node /usr/share/kibana/bin/../src/cli/dist
root        9683  0.0  0.0   6432   720 pts/2    S+   11:01   0:00 grep --color=auto kibana
[root@kibana01 ~]#pstree -p|grep node|-node(9152)-+-{node}(9159)|            |-{node}(9160)|            |-{node}(9161)|            |-{node}(9162)|            |-{node}(9163)|            |-{node}(9180)|            |-{node}(9187)|            |-{node}(9188)|            |-{node}(9189)|            `-{node}(9190)[root@kibana01 ~]#id kibana
uid=114(kibana) gid=118(kibana) groups=118(kibana)
5.3 使用 Kibana
5.3.1 查看和操作Web界面
#浏览器访问下面链接
http://kabana-server:5601
如果出现下面提示,需要删除相关插件或重置浏览器
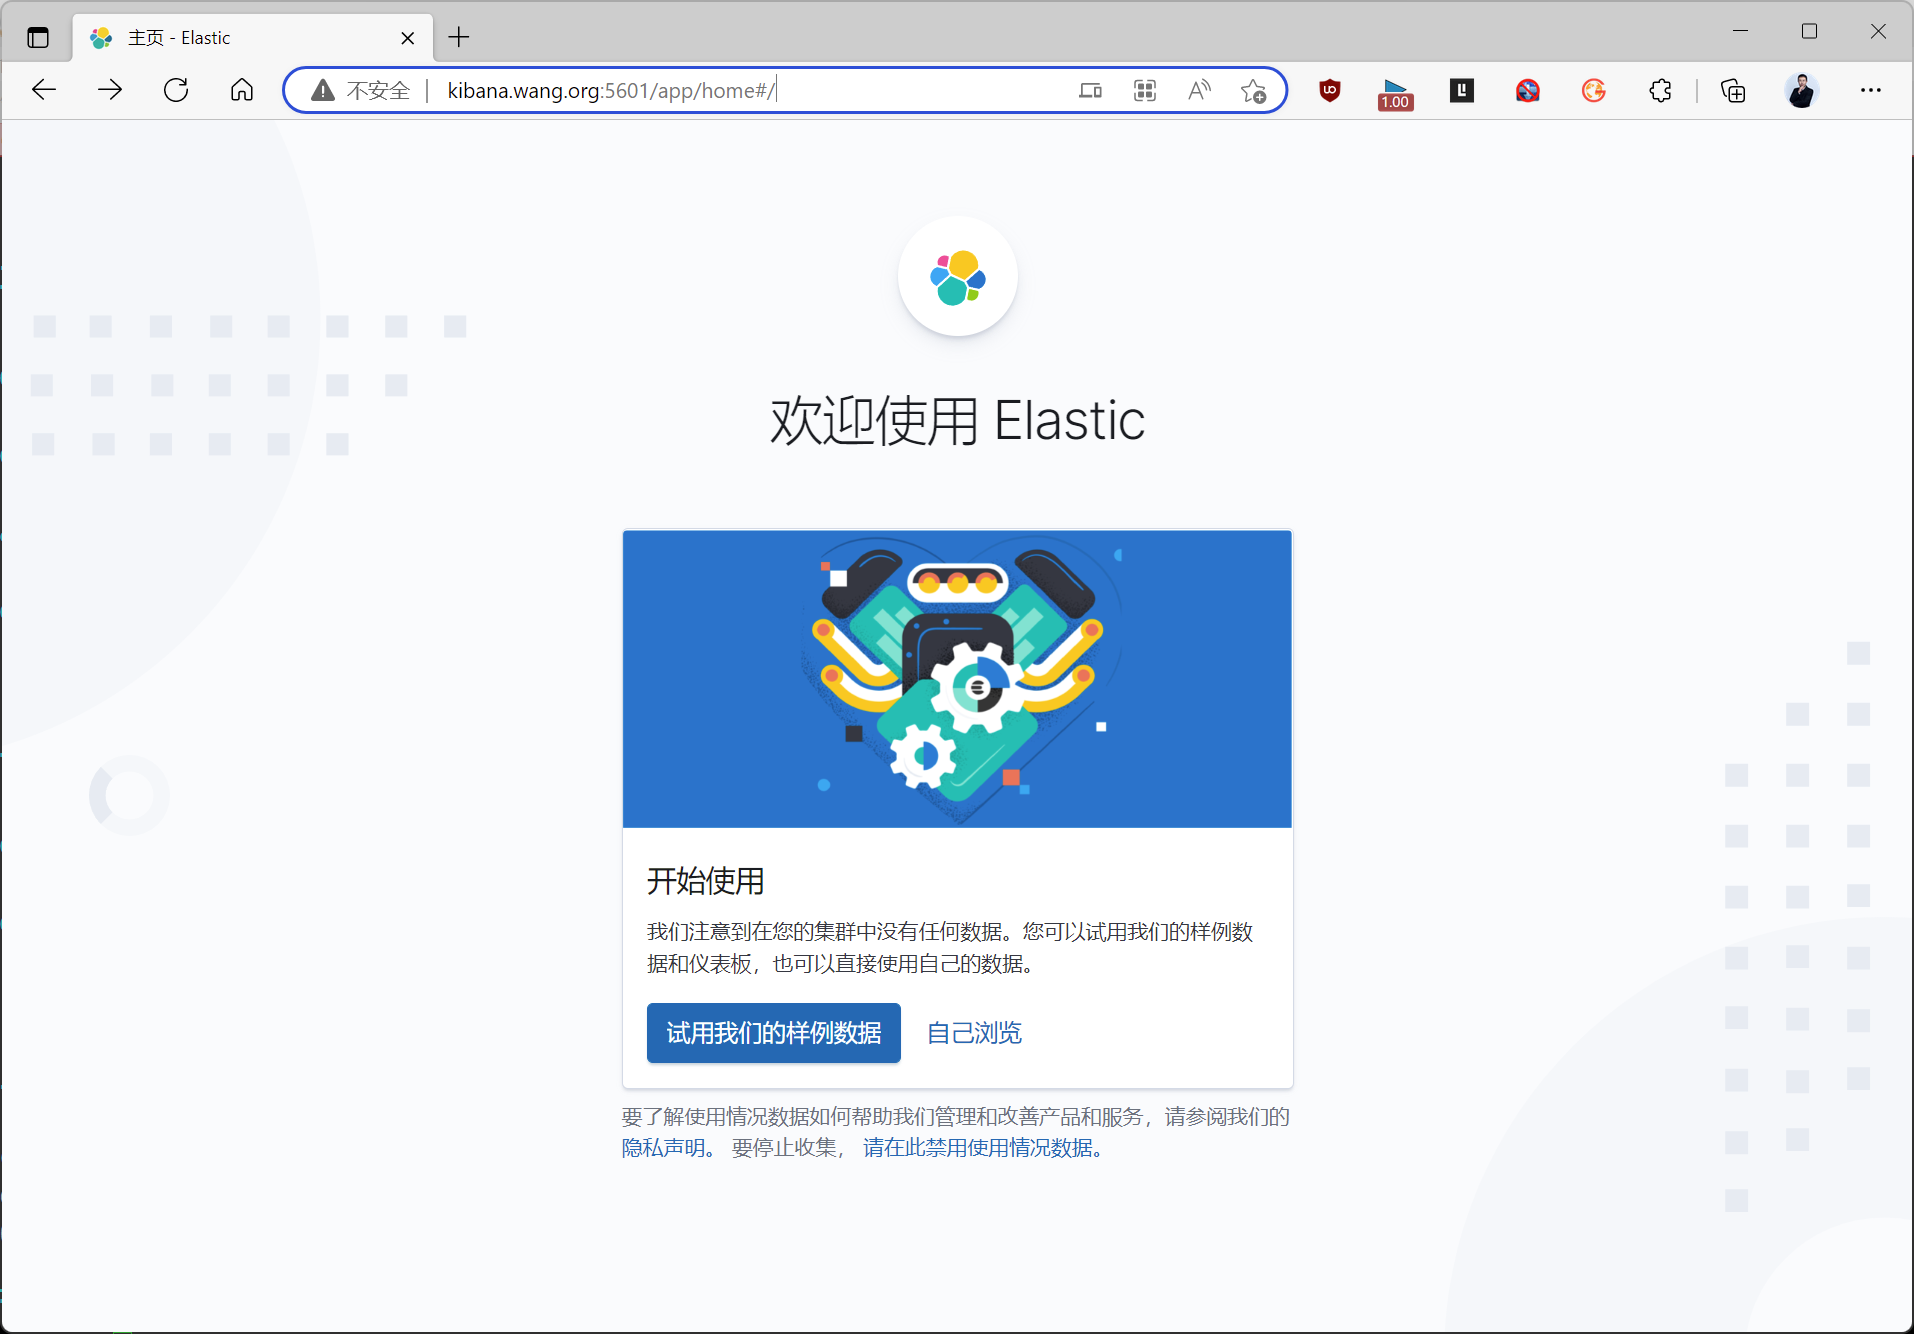
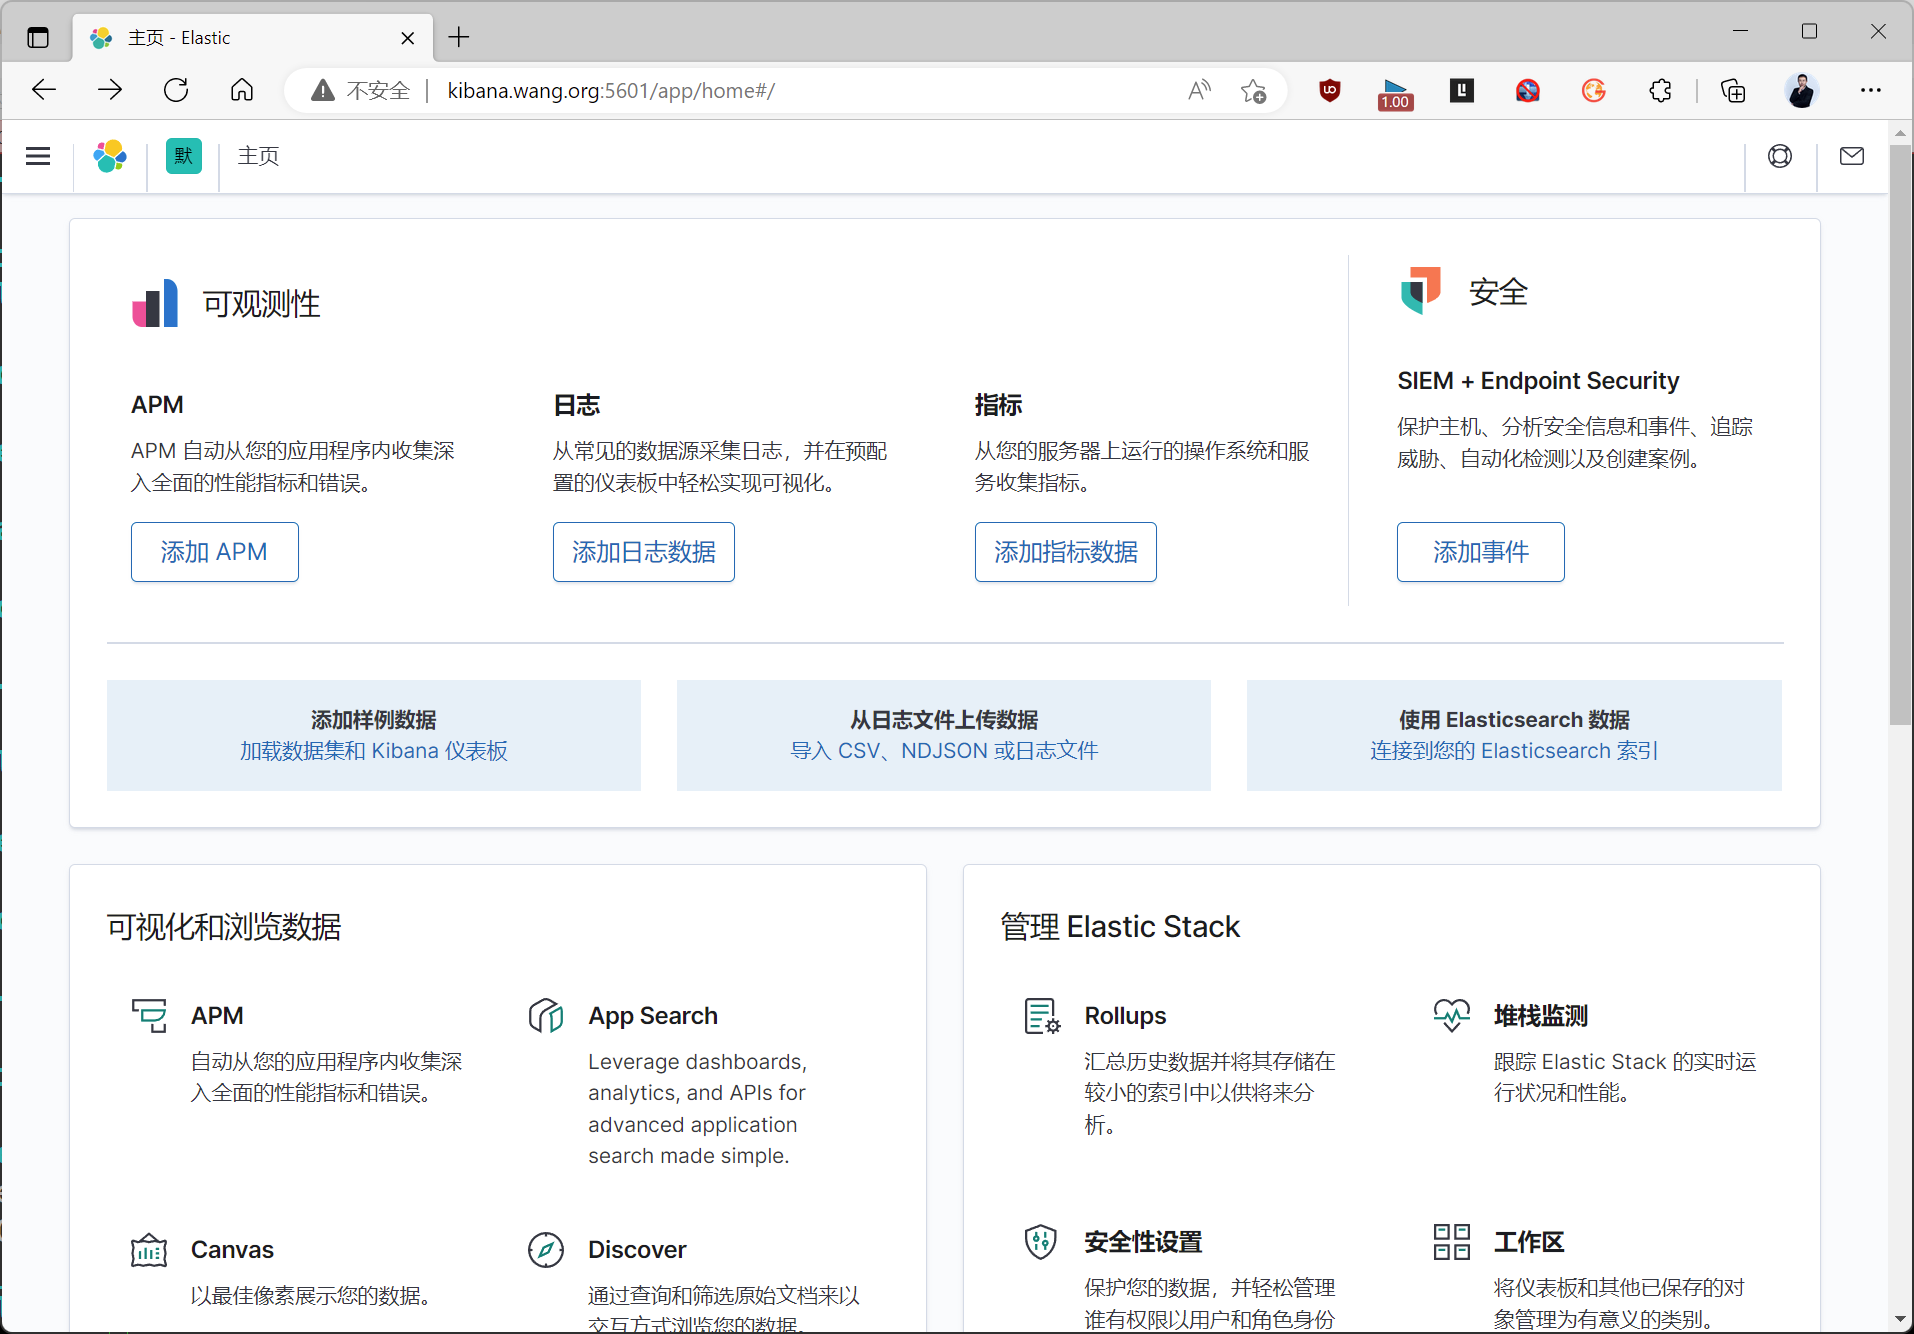

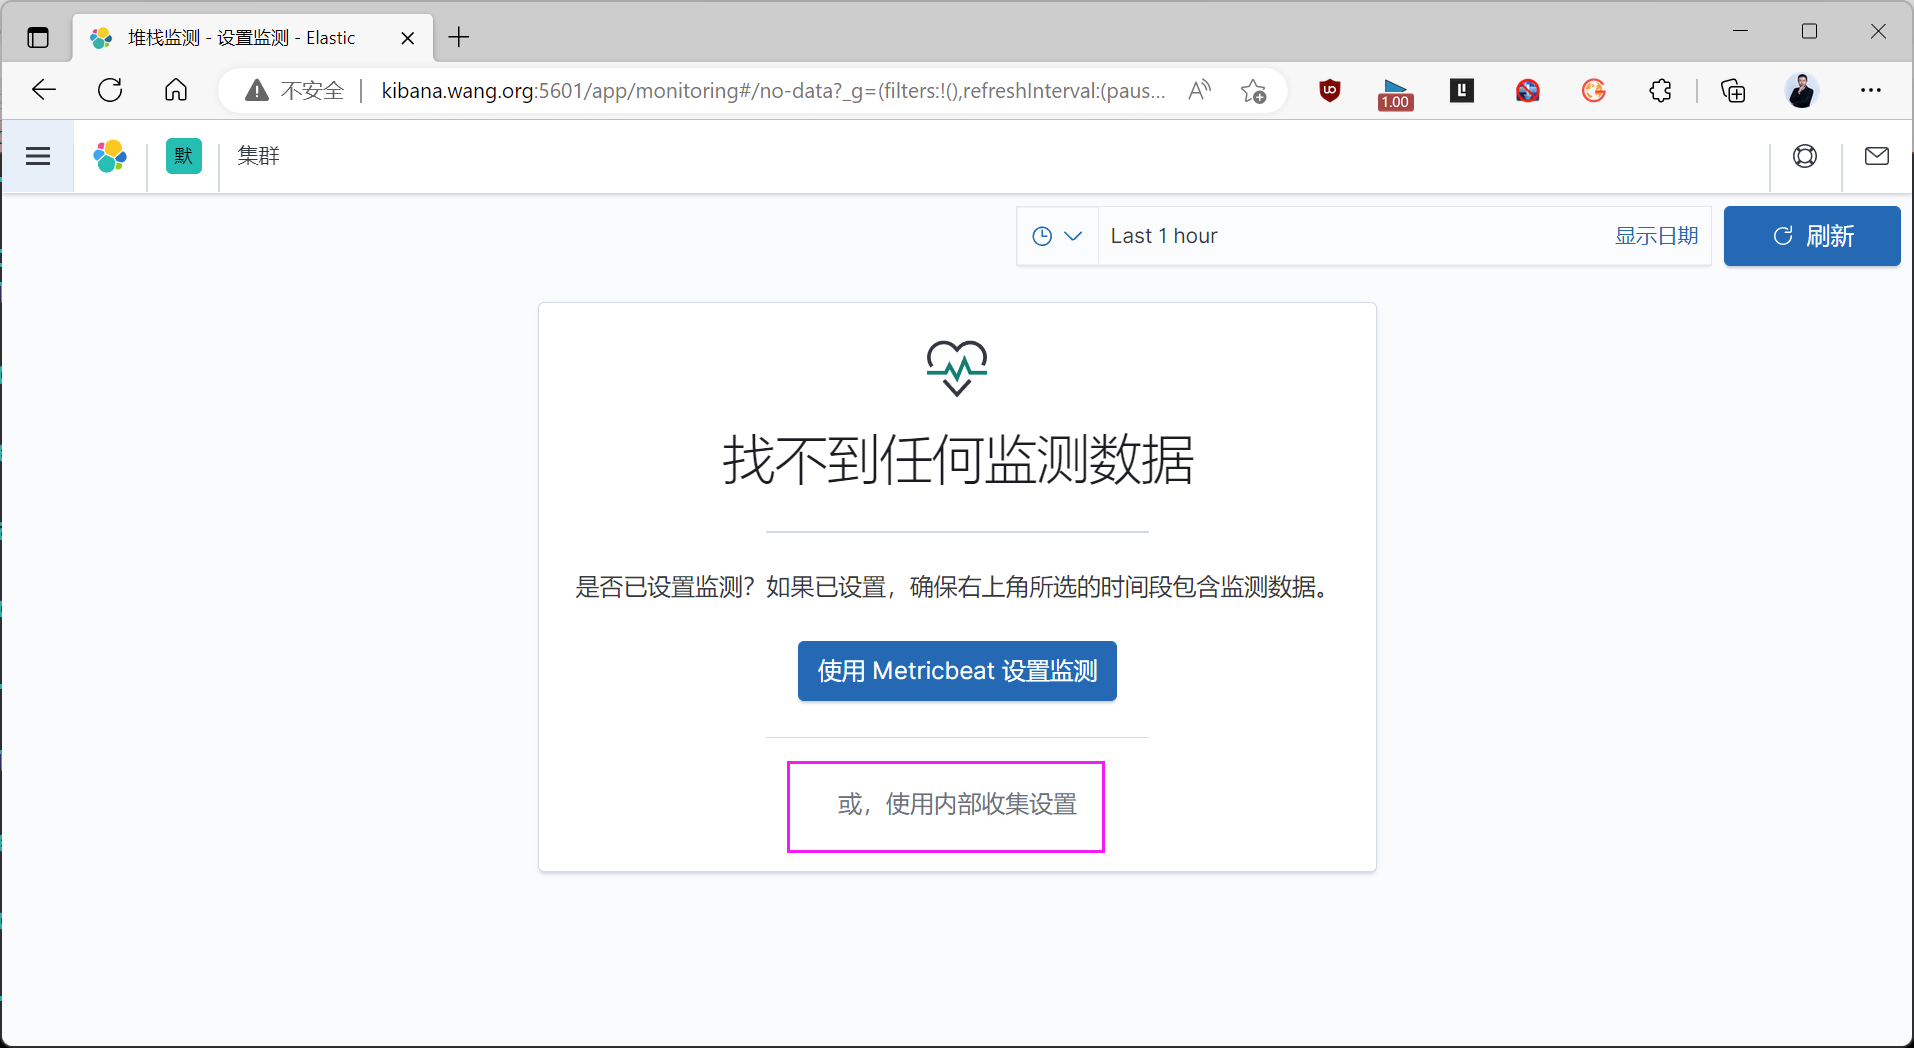
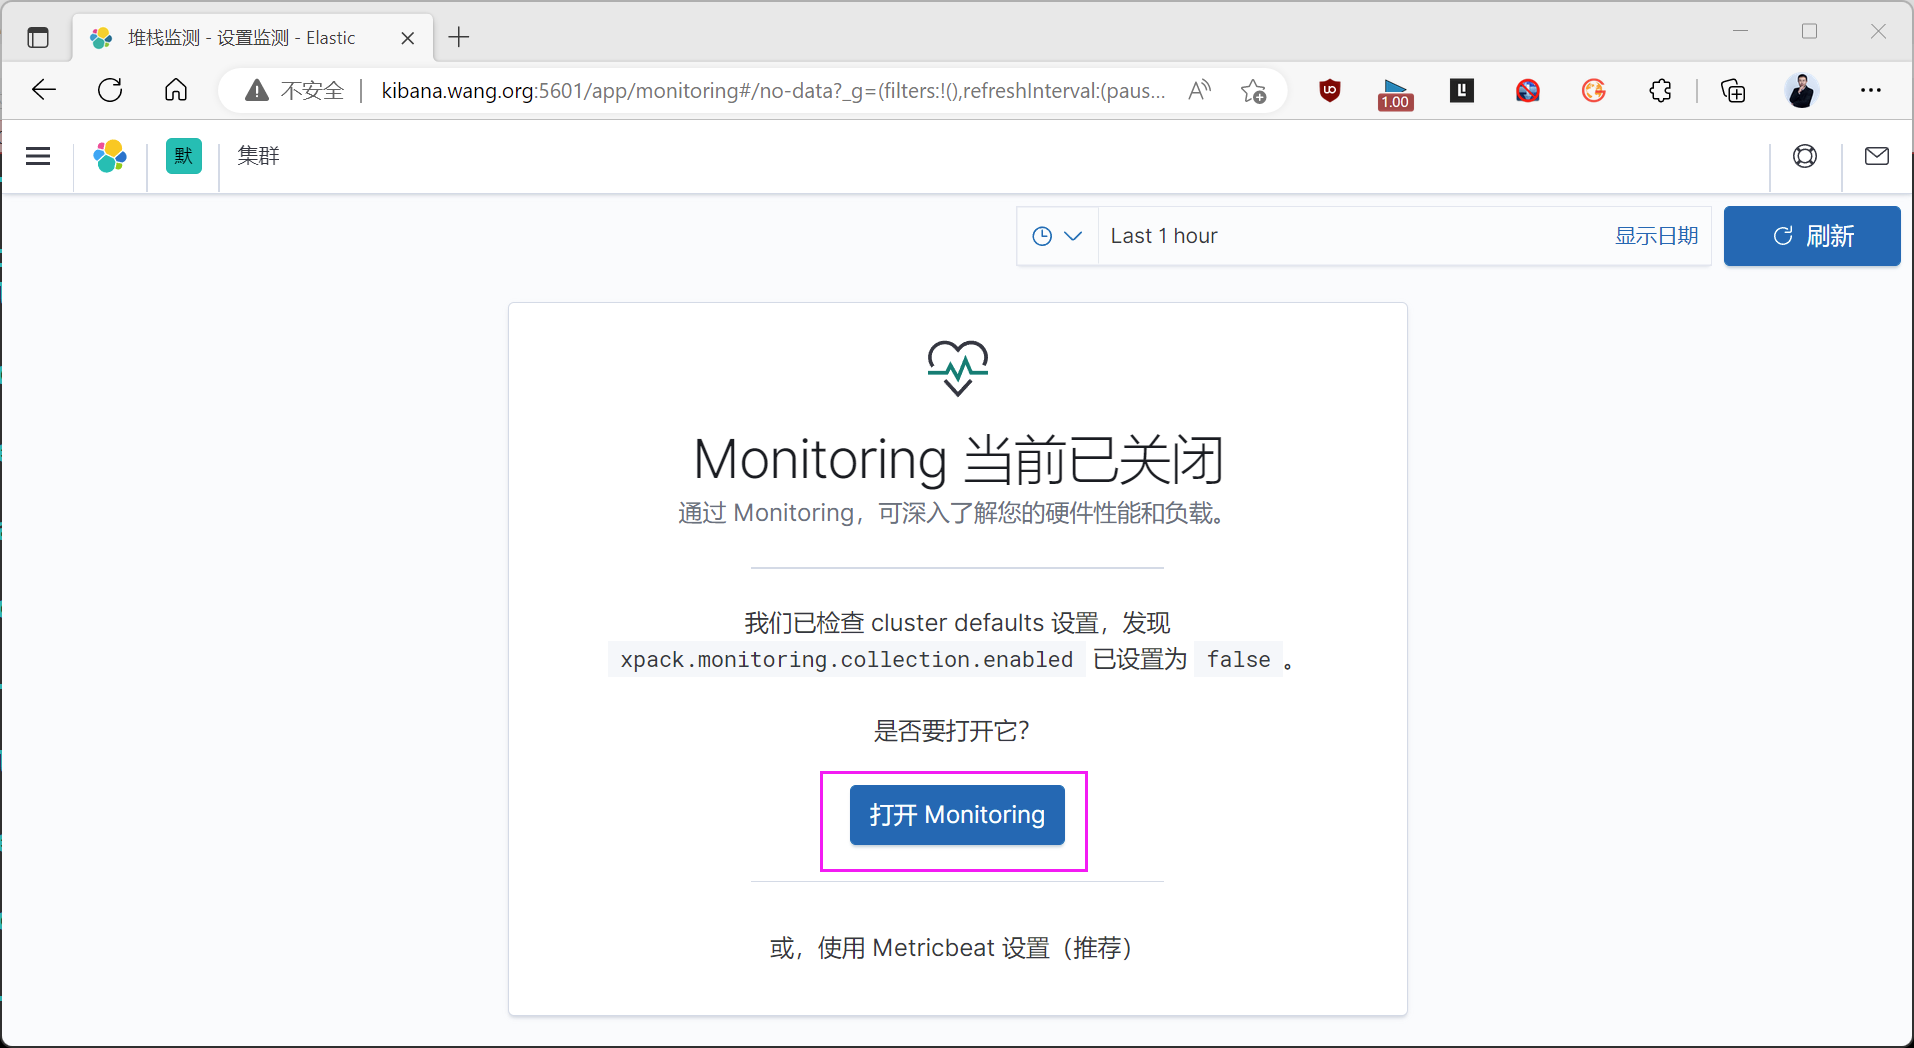
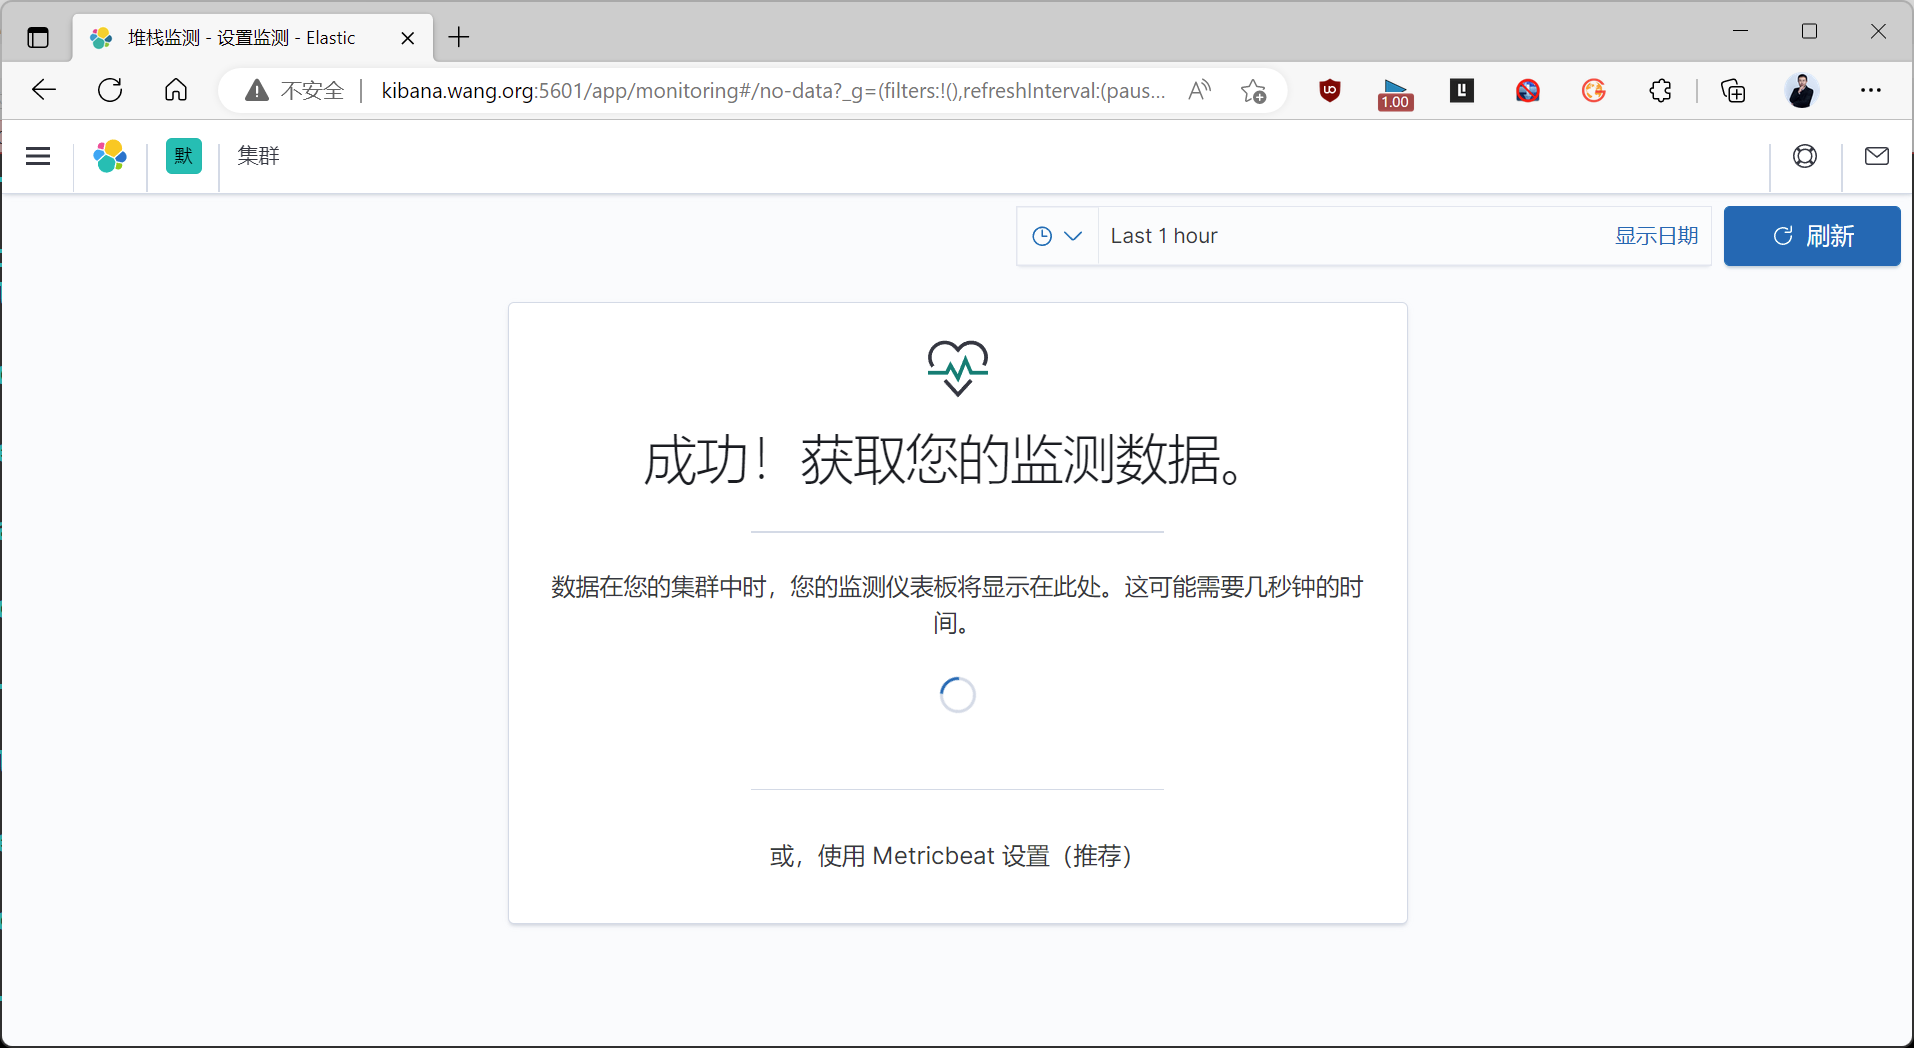
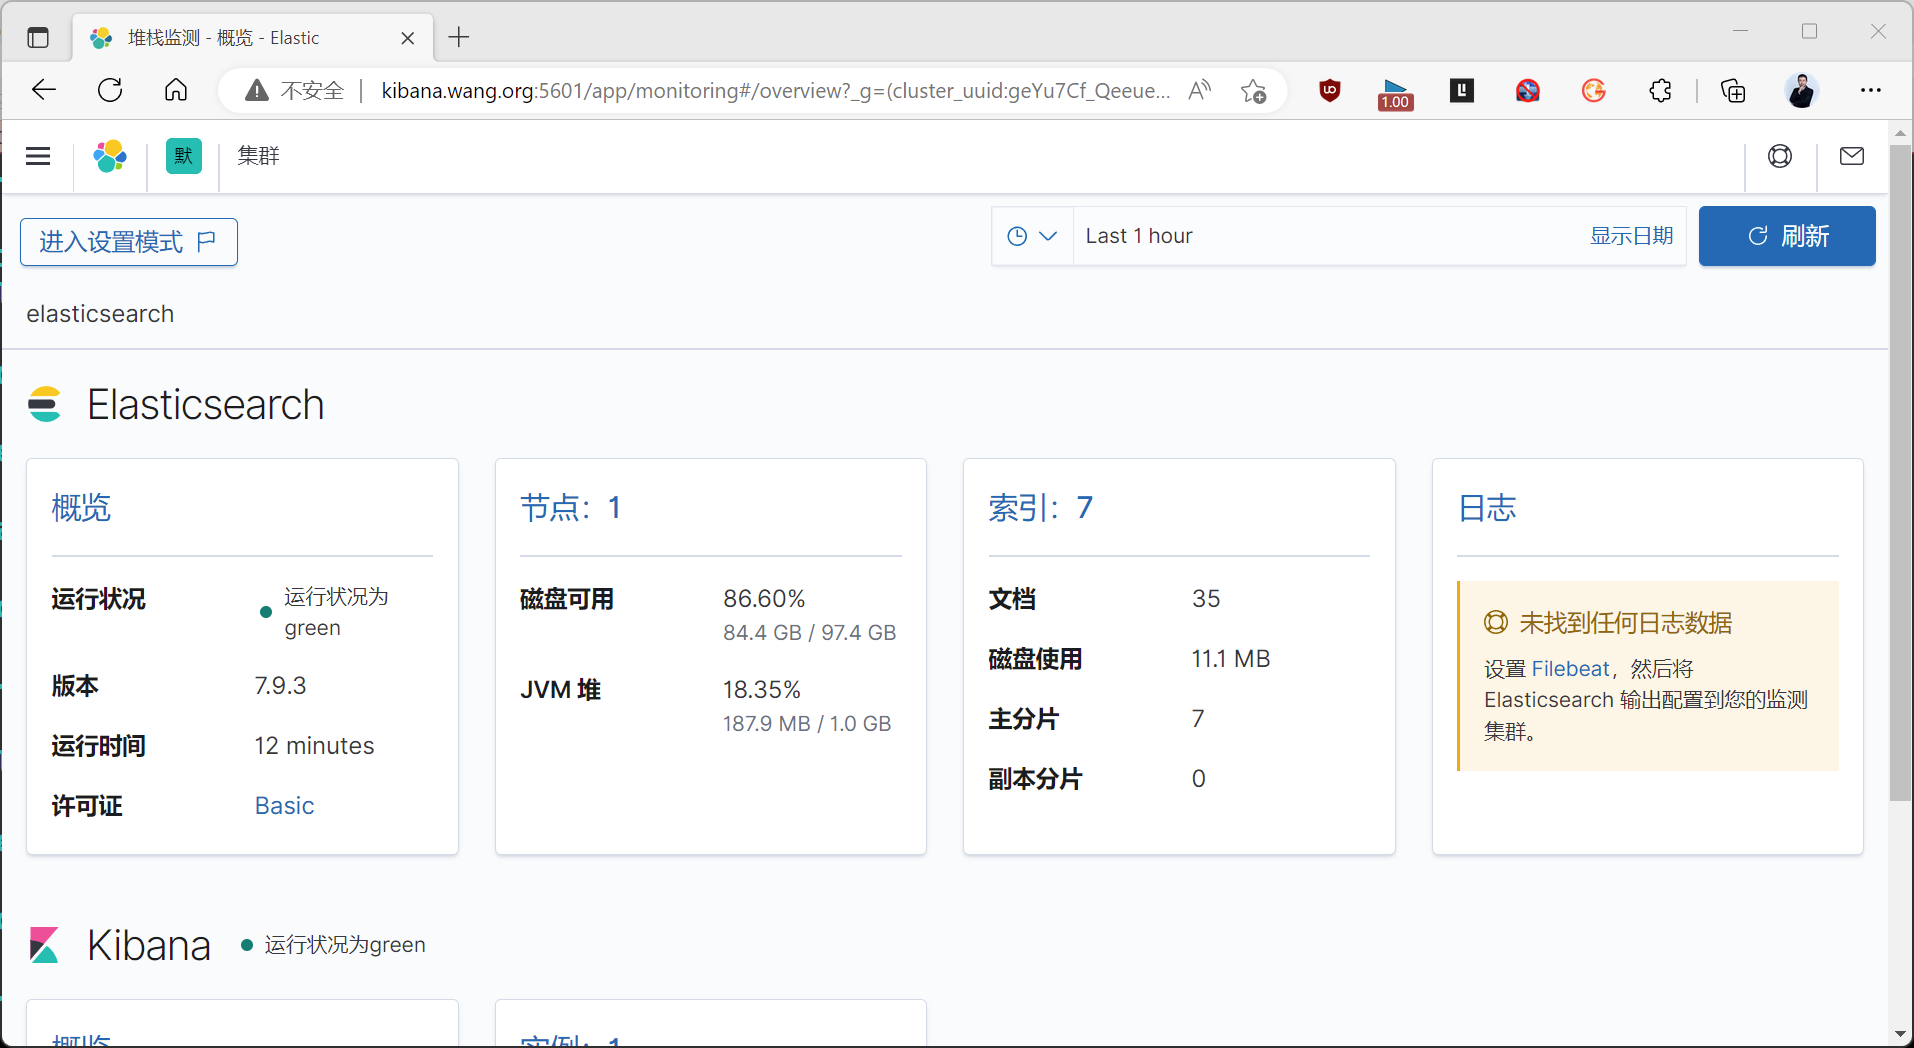
6 ELK 综合实战案例
6.1 Filebeat 收集Nginx日志利用 Redis 缓存发送至Elasticsearch,并创建IP地图显示
利用 Redis 缓存日志数据,主要解决应用解耦,异步消息,流量削锋等问题
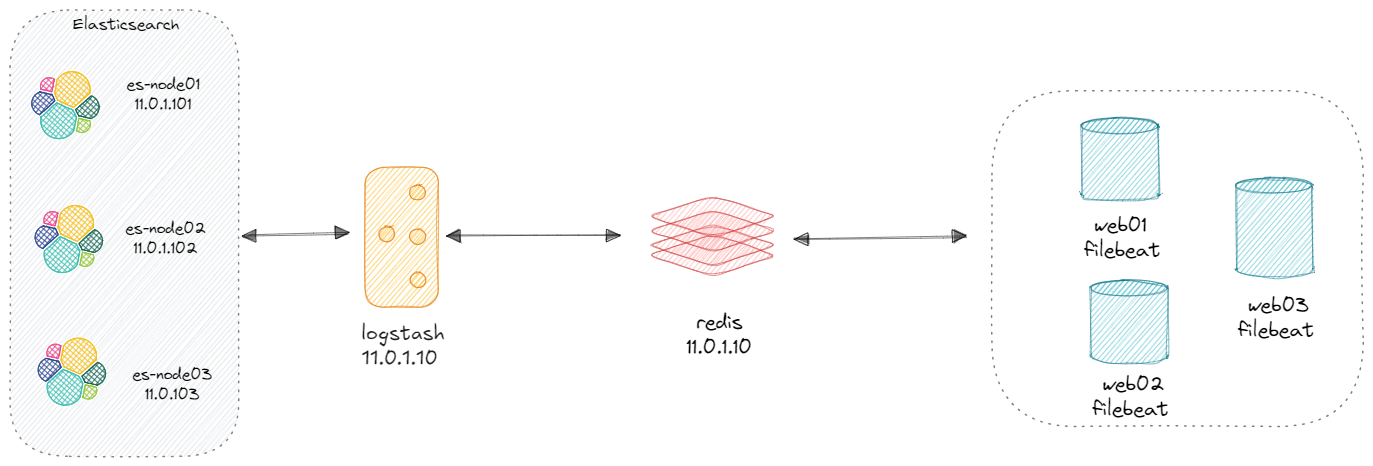
将nginx 服务器的logstash收集之后的访问日志写入到redis服务器,然后通过另外的logstash将redis服务器的数据取出在写入到elasticsearch服务器。
官方文档:
https://www.elastic.co/guide/en/logstash/current/plugins-inputs-redis.html
https://www.elastic.co/guide/en/logstash/current/plugins-outputs-redis.html
局限性
- 不支持Redis 集群,存在单点问题,但是可以多节点负载均衡
- Redis 基于内存,因此存放数据量有限
6.1.1 部署 Nginx 服务配置 Json 格式的访问日志
范例:包安装 Nginx
#安装部署nginx
[root@web-server ~]# apt install -y nginx#修改nginx访问日志为Json格式
[root@web-server ~]#grep -Ev '^#|^$' /etc/nginx/nginx.conf
user nginx;
worker_processes auto;
pid /run/nginx.pid;
include /etc/nginx/modules-enabled/*.conf;
events {worker_connections 768;# multi_accept on;
}
http {### Basic Settings##sendfile on;tcp_nopush on;tcp_nodelay on;keepalive_timeout 65;types_hash_max_size 2048;# server_tokens off;# server_names_hash_bucket_size 64;# server_name_in_redirect off;include /etc/nginx/mime.types;default_type application/octet-stream;ssl_protocols TLSv1 TLSv1.1 TLSv1.2 TLSv1.3; # Dropping SSLv3, ref: POODLEssl_prefer_server_ciphers on;### Logging Settings### 定义自定义日志格式为 JSON 格式,并进行 JSON 字符转义log_format json_logs escape=json '{''"@timestamp":"$time_iso8601",'               # 记录 ISO 8601 格式的时间戳'"host":"$server_addr",'                      # 服务器地址'"clientip":"$remote_addr",'                  # 客户端 IP 地址'"size":$body_bytes_sent,'                    # 响应发送给客户端的字节数'"responsetime":$request_time,'               # 请求处理时间'"upstreamtime":"$upstream_response_time",'   # 上游服务器响应时间'"upstreamhost":"$upstream_addr",'            # 上游服务器地址'"http_host":"$host",'                        # 请求中的 Host 头部'"uri":"$uri",'                               # 请求的 URI'"domain":"$host",'                           # 请求中的域名'"xff":"$http_x_forwarded_for",'              # 客户端的 X-Forwarded-For 头,表示客户端的原始 IP'"referer":"$http_referer",'                  # 请求的 Referer 头'"tcp_xff":"$proxy_protocol_addr",'           # 通过 TCP 代理协议传递的原始客户端 IP 地址'"http_user_agent":"$http_user_agent",'       # 用户代理(客户端的浏览器或其他信息)'"status":"$status"}';                        # HTTP 响应状态码# 使用自定义的 JSON 格式记录访问日志access_log /var/log/nginx/access_json.log json_logs;# 指定错误日志的输出位置error_log /var/log/nginx/error_json.log;#access_log /var/log/nginx/access.log;#error_log /var/log/nginx/error.log;gzip on;include /etc/nginx/conf.d/*.conf;include /etc/nginx/sites-enabled/*;
}#默认开启nginx的错误日志,但如果是ubuntu,还需要修改下面行才能记录错误日志
[root@web-server ~]#vim /etc/nginx/sites-available/default ......location / {# First attempt to serve request as file, then# as directory, then fall back to displaying a 404.#try_files $uri $uri/ =404;		#将此行注释}[root@web-server ~]# systemctl restart nginx#web界面配置文件
[root@web-server ~]# vim /etc/nginx/conf.d/pc.conf server {listen 8080;server_name t1.dinginx.org;root /data/html/wordpress/;index index.php index.html index.htm;location /basic_status {stub_status;}# PHP-FPM 状态查看地址location ~ ^/(fpm_status|ping)$ {fastcgi_pass 127.0.0.1:9000;fastcgi_param SCRIPT_FILENAME /data/html/wordpress/fpm_status.php;  # 指定 PHP 文件位置include fastcgi_params;}# PHP 处理,确保所有的 .php 文件都通过 PHP-FPM 处理location ~ \.php$ {root /data/html/wordpress;fastcgi_index index.php;fastcgi_pass 127.0.0.1:9000;fastcgi_param SCRIPT_FILENAME $document_root$fastcgi_script_name;include fastcgi_params;}
}#验证日志格式
[root@web-server ~]#tail -f /var/log/nginx/access_json.log -n1|jq
{"@timestamp": "2024-11-18T04:47:14+00:00","host": "11.0.1.105","clientip": "11.0.1.99","size": 1484,"responsetime": 0.073,"upstreamtime": "0.072","upstreamhost": "127.0.0.1:9000","http_host": "phpipam.dinginx.org","uri": "/app/dashboard/widgets/top10_hosts_v4.php","domain": "phpipam.dinginx.org","xff": "","referer": "http://phpipam.dinginx.org/","tcp_xff": "","http_user_agent": "Mozilla/5.0 (Windows NT 10.0; Win64; x64) AppleWebKit/537.36 (KHTML, like Gecko) Chrome/130.0.0.0 Safari/537.36","status": "200"
}
6.1.2 利用 Filebeat 收集日志到 Redis
6.1.2.1 Filebeat 安装
[root@web-server ~]# dpkg -i filebeat-8.14.3-amd64.deb
6.1.2.2 修改 Filebeat 配置
[root@web-server ~]#grep -Ev '^#|^$' /etc/filebeat/filebeat.yml
filebeat.inputs:
- type: logenabled: truepaths:- /var/log/nginx/access_json.logjson.keys_under_root: true       # 将JSON键值提升到根级别json.overwrite_keys: true        # 如果键值存在,允许覆盖tags: ["nginx-access"]        # 给日志打上标签,便于区分
- type: logenabled: truepaths:- /var/log/nginx/error_json.logjson.keys_under_root: true       # 将JSON键值提升到根级别tags: ["nginx-error"]         # 给日志打上标签,便于区分#output.logstash:#  hosts: ["11.0.1.10:5044"]
output.redis:hosts: ["11.0.1.10:6379"]key: "filebeat"password: "123456"db: "0"timeout: 5#output.elasticsearch:#  hosts: ["11.0.1.101:9200", "11.0.1.102:9200", "11.0.1.103:9200"]##  indices:#    - index: "nginx-access-%{[agent.version]}-%{+yyyy.MM.dd}"#      when.contains:#        tags: "nginx-access"  # 匹配单个值,而非数组##    - index: "nginx-error-%{[agent.version]}-%{+yyyy.MM.dd}"#      when.contains:#        tags: "nginx-error"#setup.ilm.enabled: false  # 禁用 Elasticsearch 的索引生命周期管理(ILM)#setup.template.name: "nginx104"  # 模板名称,用于处理 NGINX 日志的字段映射#setup.template.pattern: "nginx104-*"  # 模板匹配模式,应用于所有以 "nginx-" 开头的索引##setup.template.settings:  # 定义 Elasticsearch 模板的配置选项#  index.number_of_shards: 3  # 设置每个索引的主分片数量为 3#  index.number_of_replicas: 1  # 设置每个分片的副本数量为 1
6.1.2.3 启动 filebeat 服务
[root@web-server ~]# systemctl enable --now filebeat.service
[root@web-server ~]# systemctl status filebeat.service
● filebeat.service - Filebeat sends log files to Logstash or directly to Elasticsearch.Loaded: loaded (/lib/systemd/system/filebeat.service; enabled; vendor preset: enabled)Active: active (running) since Fri 2024-11-15 05:05:15 UTC; 3 days agoDocs: https://www.elastic.co/beats/filebeatMain PID: 13563 (filebeat)Tasks: 9 (limit: 2218)Memory: 31.1MCGroup: /system.slice/filebeat.service└─13563 /usr/share/filebeat/bin/filebeat --environment systemd -c /etc/filebeat/filebeat.yml --path.home /usr/share/filebeat --path.config /etc/filebeat --path.data /var/li>Nov 18 05:15:42 web-server.dinginx.org filebeat[13563]: {"log.level":"info","@timestamp":"2024-11-18T05:15:42.438Z","log.logger":"monitoring","log.origin":{"function":"github.com/elasti>......
6.1.3 安装配置 Redis
[root@redis ~]#apt update && apt -y install redis
[root@redis ~]#vim /etc/redis/redis.conf
bind 0.0.0.0
save ""           #禁用rdb持久保存
#save 900 1
#save 300 10
#save 60 10000
requirepass 123456
[root@redis ~]#systemctl restart redis
6.1.4 安装并配置logstash收集Redis数据发送至Elasticsearch
范例:将日志中的客户端IP添加地理位置信息
#8.X 要求JDK11或17
[root@logstash ~]#apt update && apt -y install openjdk-17-jdk
[root@logstash ~]#apt -y install openjdk-8-jdk
[root@logstash ~]#wget
https://mirrors.tuna.tsinghua.edu.cn/elasticstack/7.x/apt/pool/main/l/logstash/logstash-7.6.2.deb
[root@logstash ~]#dpkg -i logstash-7.6.2.deb
#注意:必须删除下面的文件中注释
范例: logstash配置文件
#需取消注释方可生效
root@logstash:/etc/logstash/conf.d# cat nginx_redis_to_es.conf
input {redis {host => "11.0.1.10"         # 这里填写 Redis 服务器的 IP 地址port => 6379               # Redis 默认端口password => "123456"        # Redis 的密码,如果没有密码认证,可以删除此行db => 0                    # 选择 Redis 数据库,0 为默认数据库data_type => "list"         # Redis 数据类型为 listkey => "filebeat"    # 从 Redis 的 list 中读取数据的 key}
}filter {if "nginx-access" in [tags] {geoip {source => "clientip"target => "geoip"add_field => ["[geoip][coordinates]","%{[geoip][geo][location][lon]}"]add_field => ["[geoip][coordinates]","%{[geoip][geo][location][lat]}"]}mutate {convert => [ "[geoip][coordinates]", "float"]       }}mutate {convert => ["upstreamtime","float"]}
}output {# 处理三种类型的日志:# 1. 系统日志if "syslog" in [tags] {elasticsearch {hosts => ["11.0.1.101:9200", "11.0.1.102:9200", "11.0.1.103:9200"]index => "syslog-%{+YYYY.MM.dd}"  # 按天轮转索引}}# 2. Nginx 访问日志if "nginx-access" in [tags] {elasticsearch {hosts => ["11.0.1.101:9200", "11.0.1.102:9200", "11.0.1.103:9200"]index => "nginxaccess-%{+YYYY.MM.dd}"template_overwrite => true  # 如果索引模板存在则更新}stdout { codec => "rubydebug" }  # 输出调试信息到控制台}# 3. Nginx 错误日志if "nginx-error" in [tags] {elasticsearch {hosts => ["11.0.1.101:9200", "11.0.1.102:9200", "11.0.1.103:9200"]index => "nginxerrorlog-%{+YYYY.MM.dd}"template_overwrite => true}}
}#***************需取消注释*************logstash配置文件示例*****************************************************
root@logstash:~# cat /etc/logstash/conf.d/test_redis_to_es.conf
input {redis {host => "11.0.1.10"port => "6379"password => "123456"db => "0"key => "filebeat"data_type => "list"}
}filter {if "nginx-access" in [tags] {geoip {source => "clientip"target => "geoip"add_field => ["[geoip][coordinates]","%{[geoip][geo][location][lon]}"]add_field => ["[geoip][coordinates]","%{[geoip][geo][location][lat]}"]}mutate {convert => [ "[geoip][coordinates]", "float"]       }}mutate {convert => ["upstreamtime","float"]}
}output {if "syslog" in [tags] {elasticsearch {hosts => ["11.0.1.101:9200","11.0.1.102:9200","11.0.1.103:9200"]index => "syslog-%{+YYYY.MM.dd}"}}if "nginx-access" in [tags] {elasticsearch {hosts => ["11.0.1.101:9200","11.0.1.102:9200","11.0.1.103:9200"]index => "nginxaccess-%{+YYYY.MM.dd}"template_overwrite => true}stdout {codec => "rubydebug"}}if "nginx-error" in [tags] {elasticsearch {hosts => ["11.0.1.101:9200","11.0.1.102:9200","11.0.1.103:9200"]index => "nginxerrorlog-%{+YYYY.MM.dd}"template_overwrite => true}}
}
#***********************************************END*****************************************************#验证logstash显示数据
root@logstash:~# /usr/share/logstash/bin/logstash -f /etc/logstash/conf.d/nginx_redis_to_es.conf -r......{"agent" => {"id" => "c5e80544-fb8d-4ec1-a3de-d954f88c429a","version" => "8.14.3","ephemeral_id" => "7d6e0699-087a-4de2-9d7a-5a545687ad94","name" => "kibana01.dinginx.org","type" => "filebeat"},"http_host" => "kibana.dinginx.org","@version" => "1","responsetime" => 0.742,"status" => "200","@timestamp" => 2024-11-18T05:43:08.000Z,"tags" => [[0] "nginx-access"],"event" => {"original" => "{\"@timestamp\":\"2024-11-18T05:43:08.000Z\",\"@metadata\":{\"beat\":\"filebeat\",\"type\":\"_doc\",\"version\":\"8.14.3\"},\"xff\":\"\",\"clientip\":\"11.0.1.99\",\"host\":{\"name\":\"kibana01.dinginx.org\"},\"referer\":\"http://kibana.dinginx.org/app/visualize\",\"upstreamtime\":\"0.740\",\"http_host\":\"kibana.dinginx.org\",\"input\":{\"type\":\"log\"},\"agent\":{\"ephemeral_id\":\"7d6e0699-087a-4de2-9d7a-5a545687ad94\",\"id\":\"c5e80544-fb8d-4ec1-a3de-d954f88c429a\",\"name\":\"kibana01.dinginx.org\",\"type\":\"filebeat\",\"version\":\"8.14.3\"},\"size\":15,\"status\":\"200\",\"domain\":\"kibana.dinginx.org\",\"tcp_xff\":\"\",\"responsetime\":0.742,\"tags\":[\"nginx-access\"],\"ecs\":{\"version\":\"8.0.0\"},\"log\":{\"offset\":288723,\"file\":{\"path\":\"/var/log/nginx/access_json.log\"}},\"http_user_agent\":\"Mozilla/5.0 (Windows NT 10.0; Win64; x64) AppleWebKit/537.36 (KHTML, like Gecko) Chrome/131.0.0.0 Safari/537.36\",\"uri\":\"/api/ui_counters/_report\",\"upstreamhost\":\"127.0.0.1:5601\"}"},"tcp_xff" => "","clientip" => "11.0.1.99","domain" => "kibana.dinginx.org","referer" => "http://kibana.dinginx.org/app/visualize","upstreamtime" => 0.74,"upstreamhost" => "127.0.0.1:5601","xff" => "","host" => {"name" => "kibana01.dinginx.org"},"size" => 15,"ecs" => {"version" => "8.0.0"},"input" => {"type" => "log"},"geoip" => {"geo" => {"location" => {"lon" => -97.822,"lat" => 37.751},"country_iso_code" => "US","timezone" => "America/Chicago","country_name" => "United States","continent_code" => "NA"},"ip" => "11.0.1.99","coordinates" => 37.751},"log" => {"offset" => 288723,"file" => {"path" => "/var/log/nginx/access_json.log"}},"http_user_agent" => "Mozilla/5.0 (Windows NT 10.0; Win64; x64) AppleWebKit/537.36 (KHTML, like Gecko) Chrome/131.0.0.0 Safari/537.36","uri" => "/api/ui_counters/_report"
}
6.1.5 通过 cerebro 插件查看索引
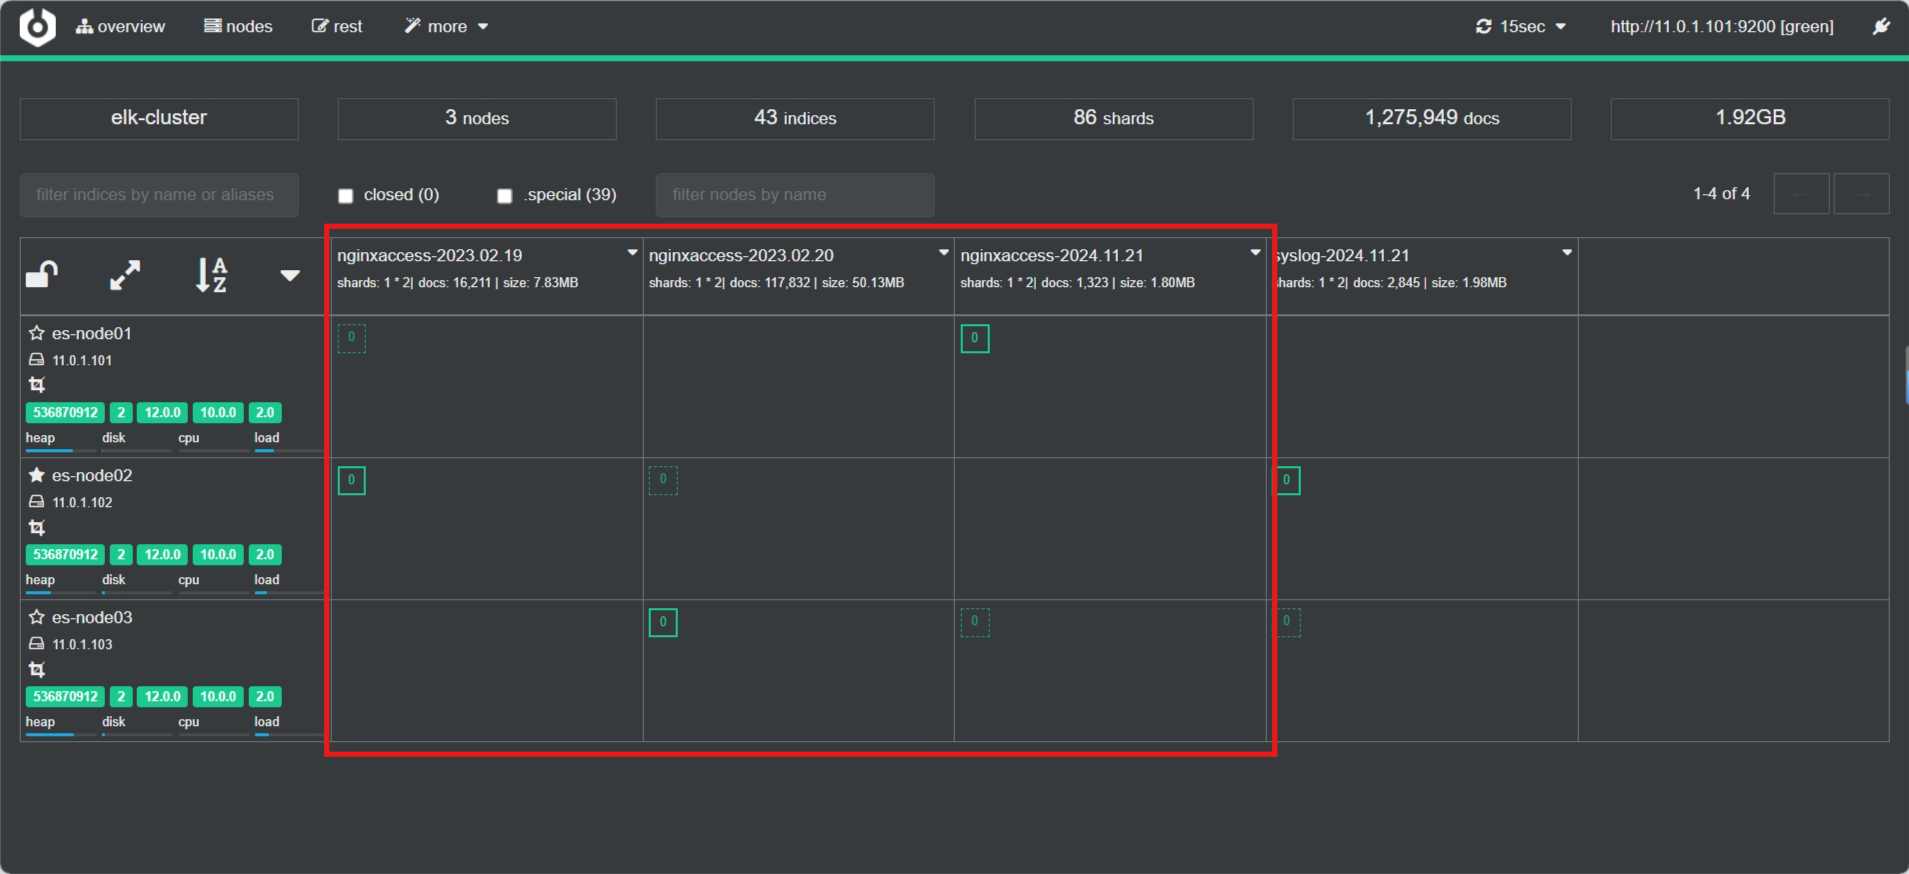
6.1.6 通过 Kibana 创建索引模式查看
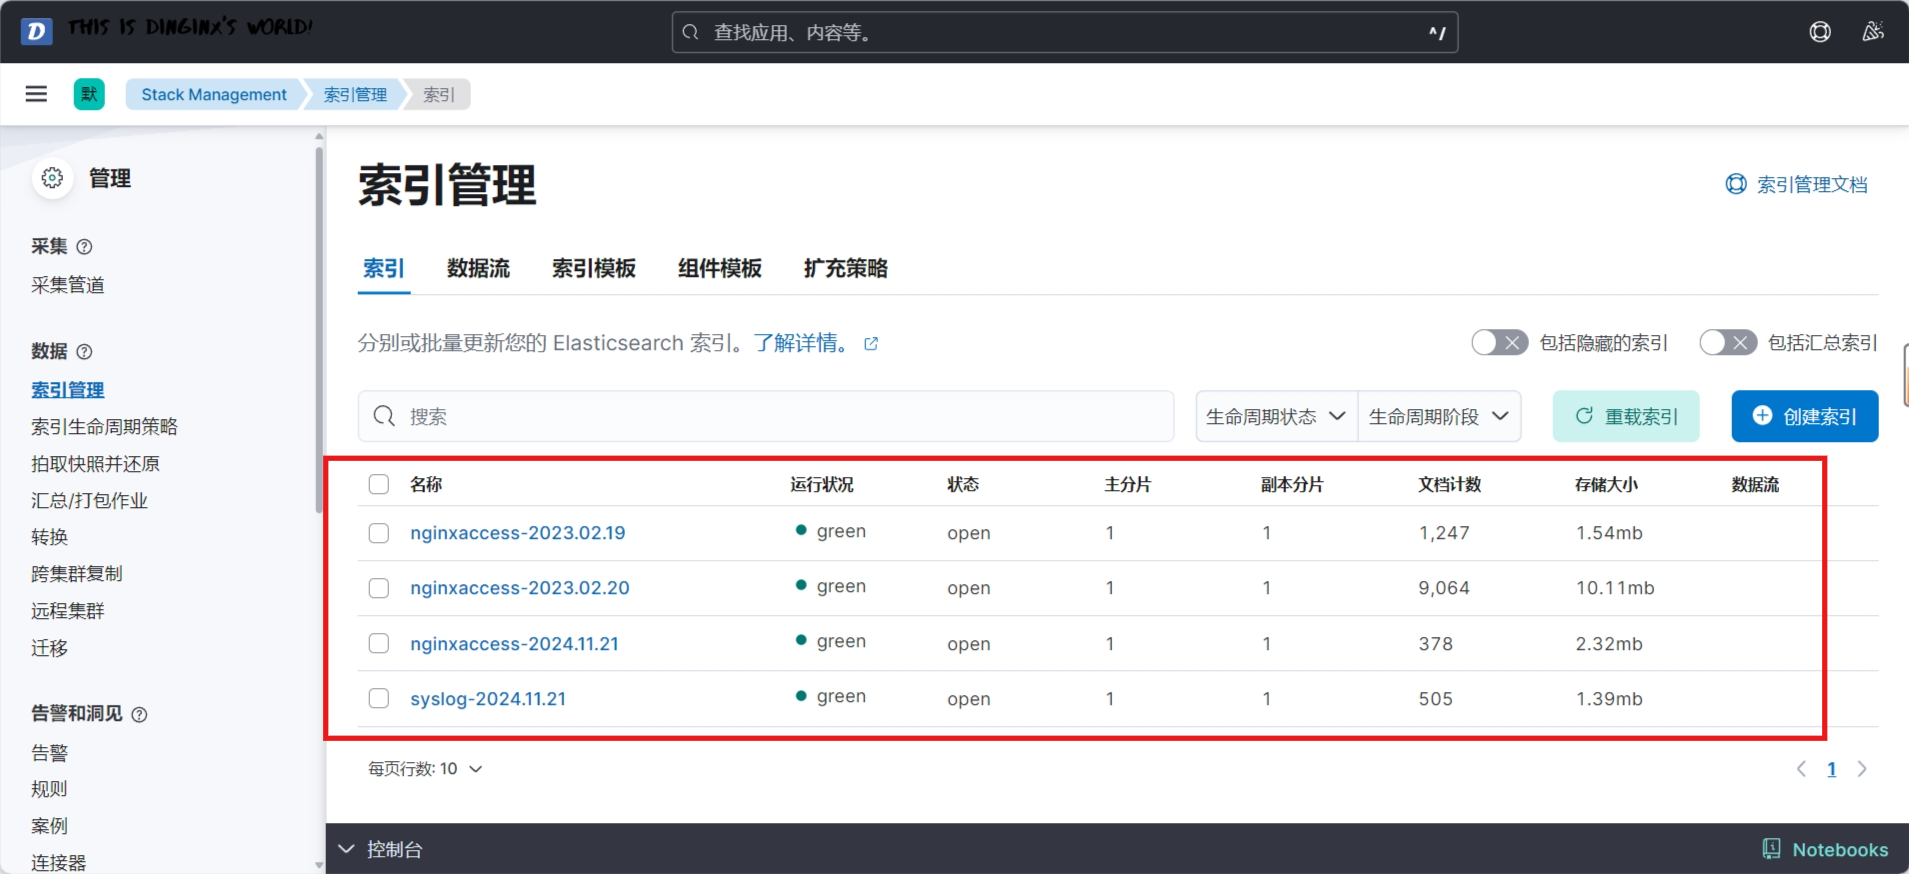
6.1.7 Kibana 创建地图数据
对于区域地图、坐标地图、Coordinate Map之类的图形展示,新版的Kibana已经将其整合到了一个统一的功能模块 Map;
通过左侧边栏的 analytics的Maps中来创建图形
6.1.7.1 查看 Kibana 样例地图
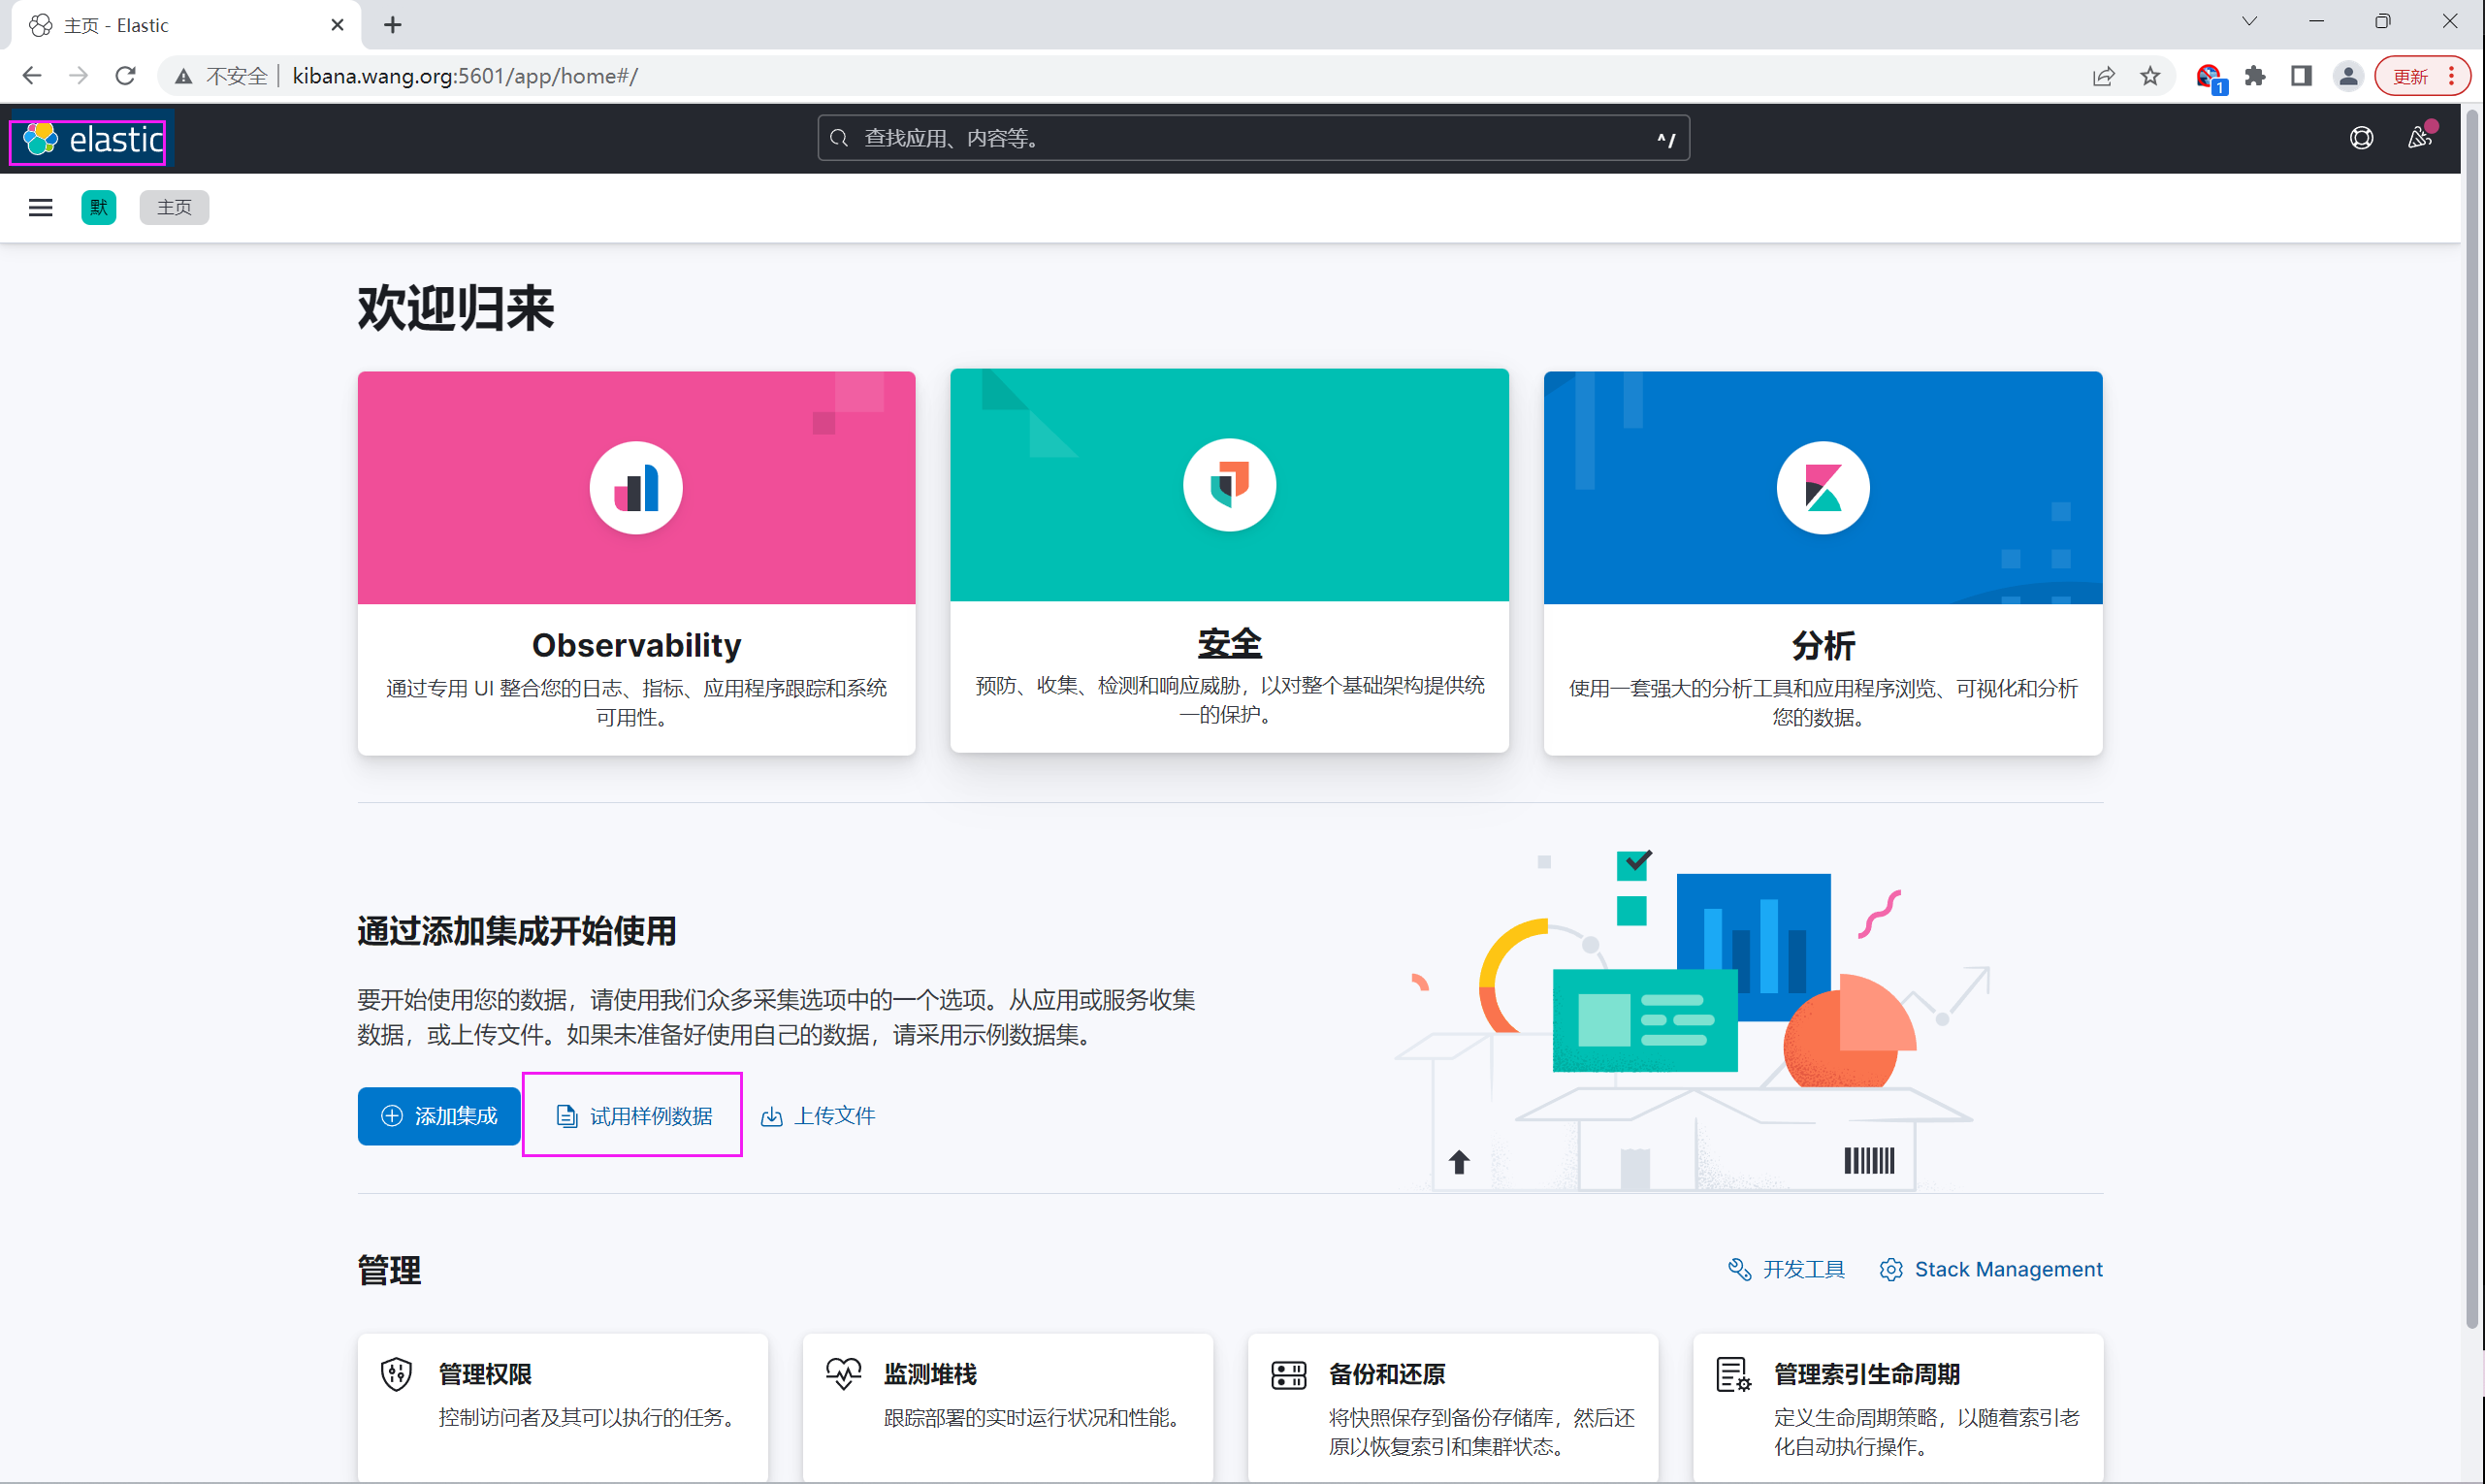
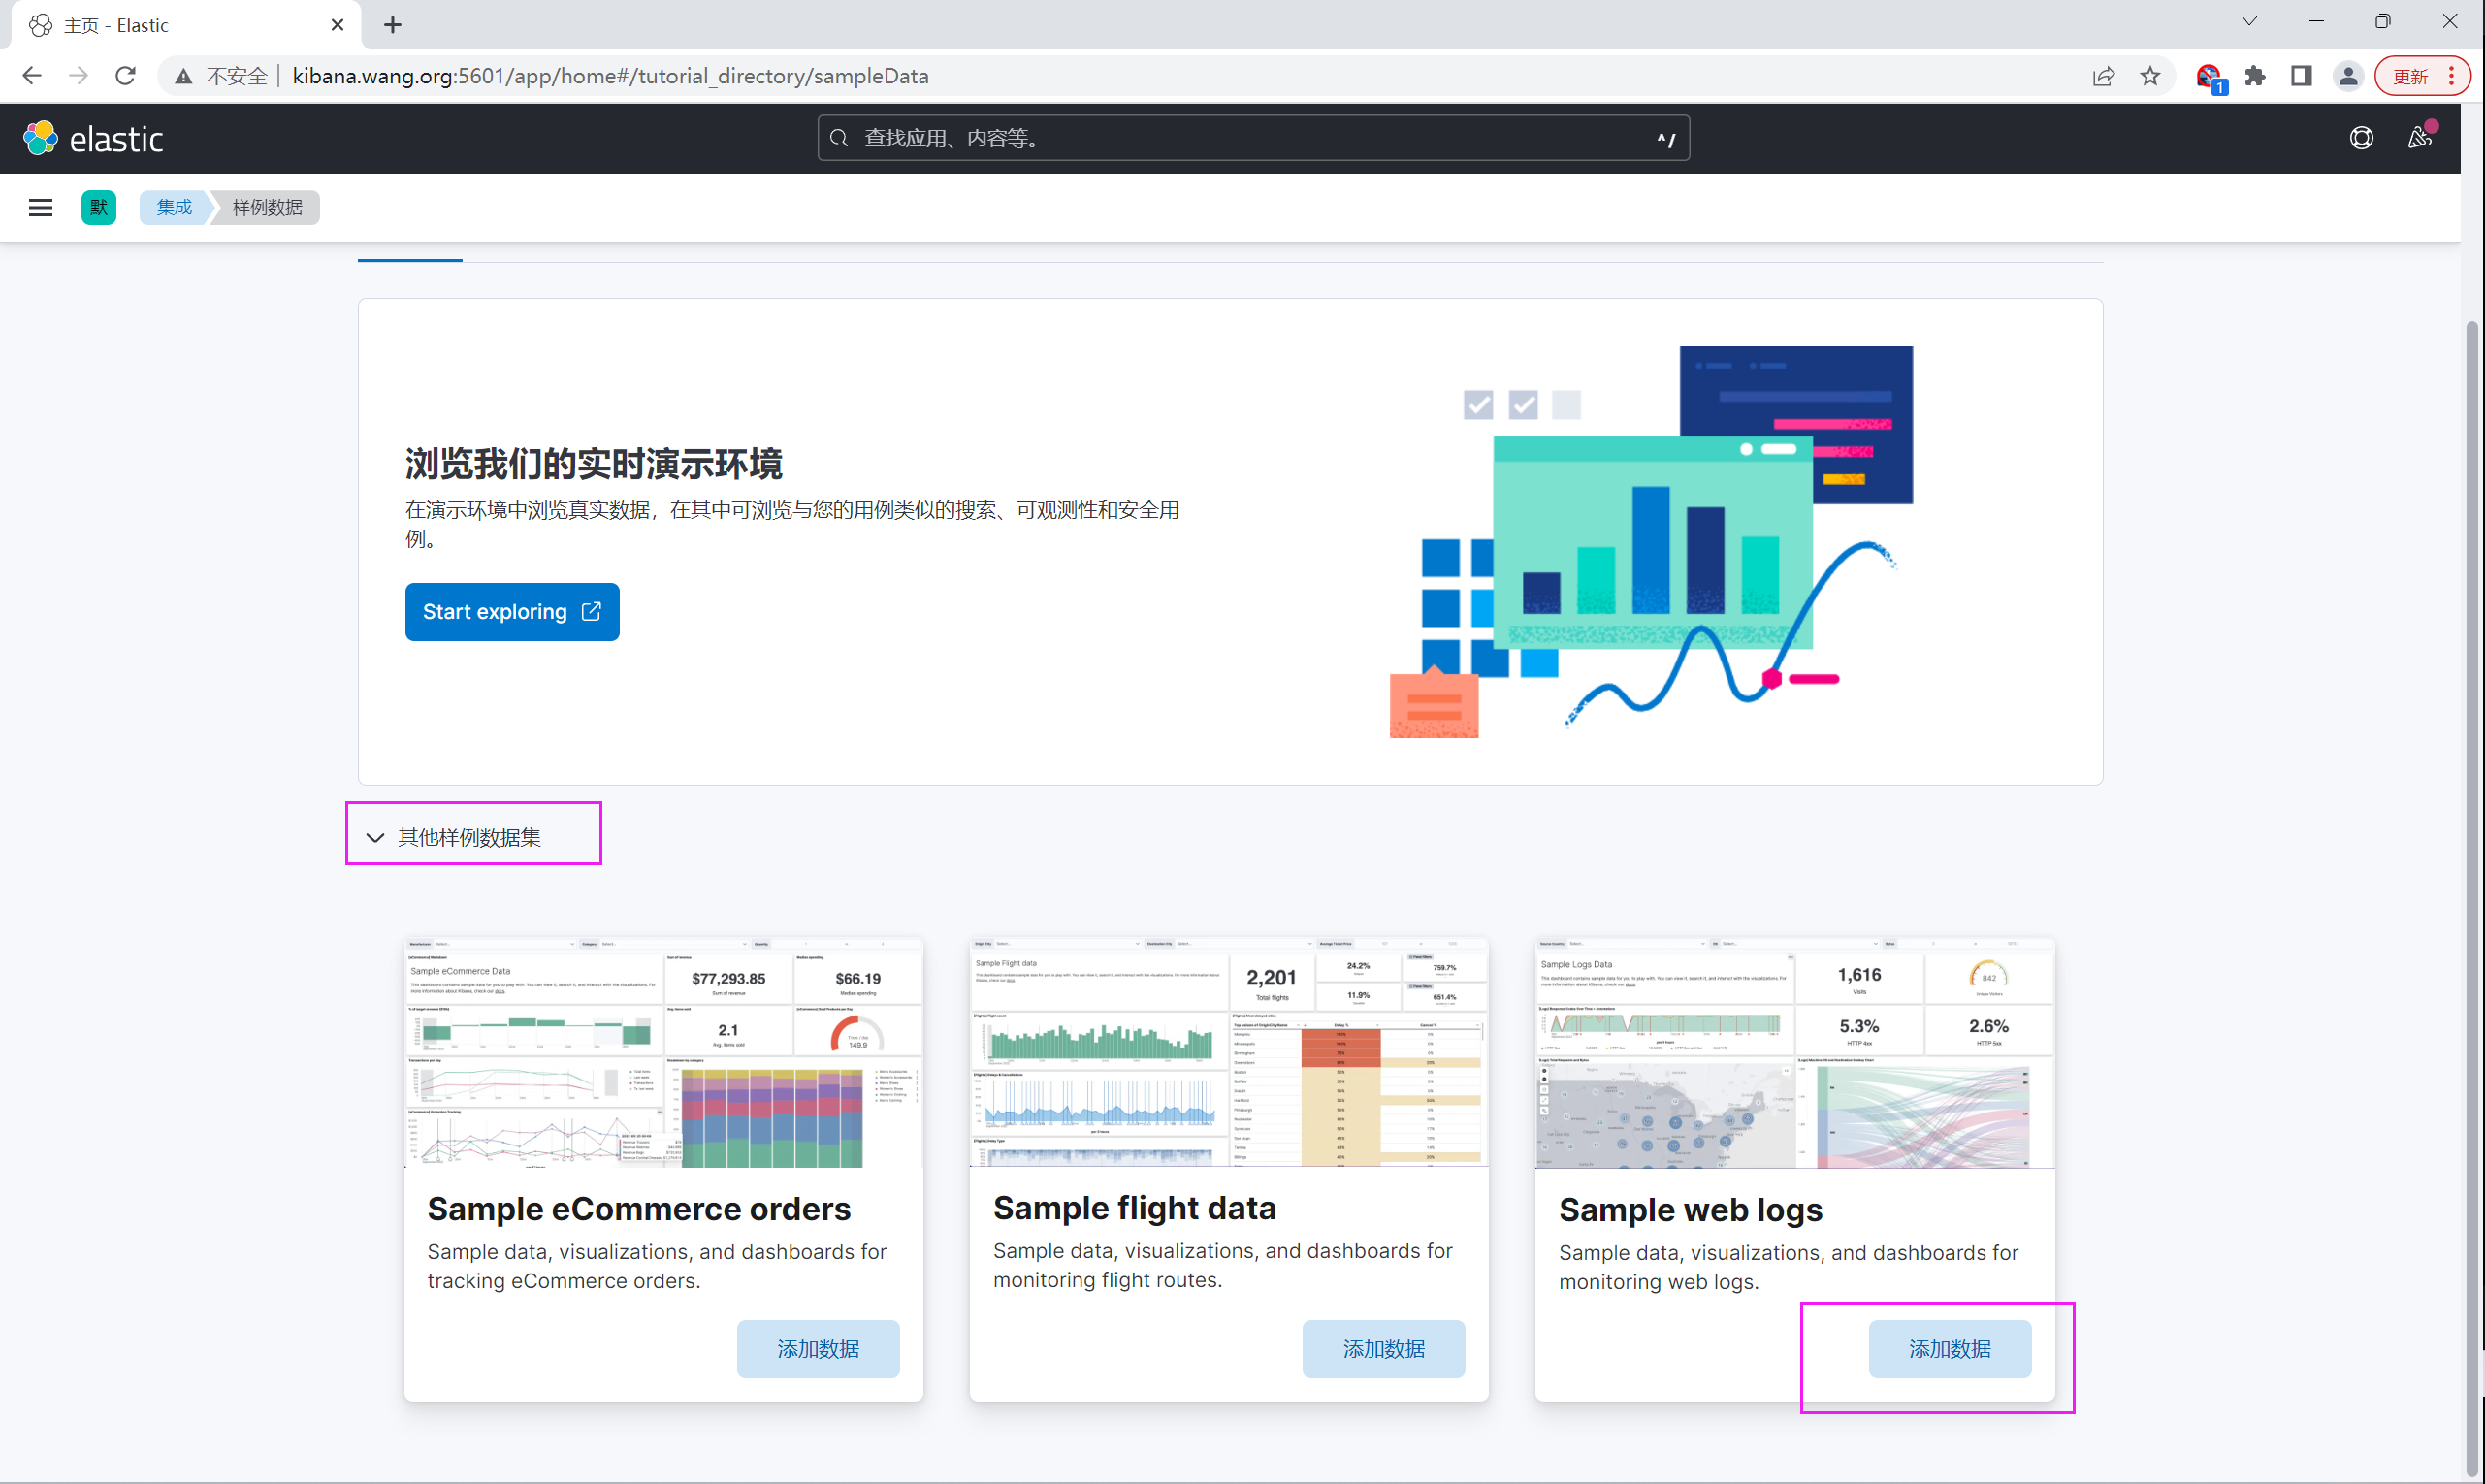
查看内置的数据视图
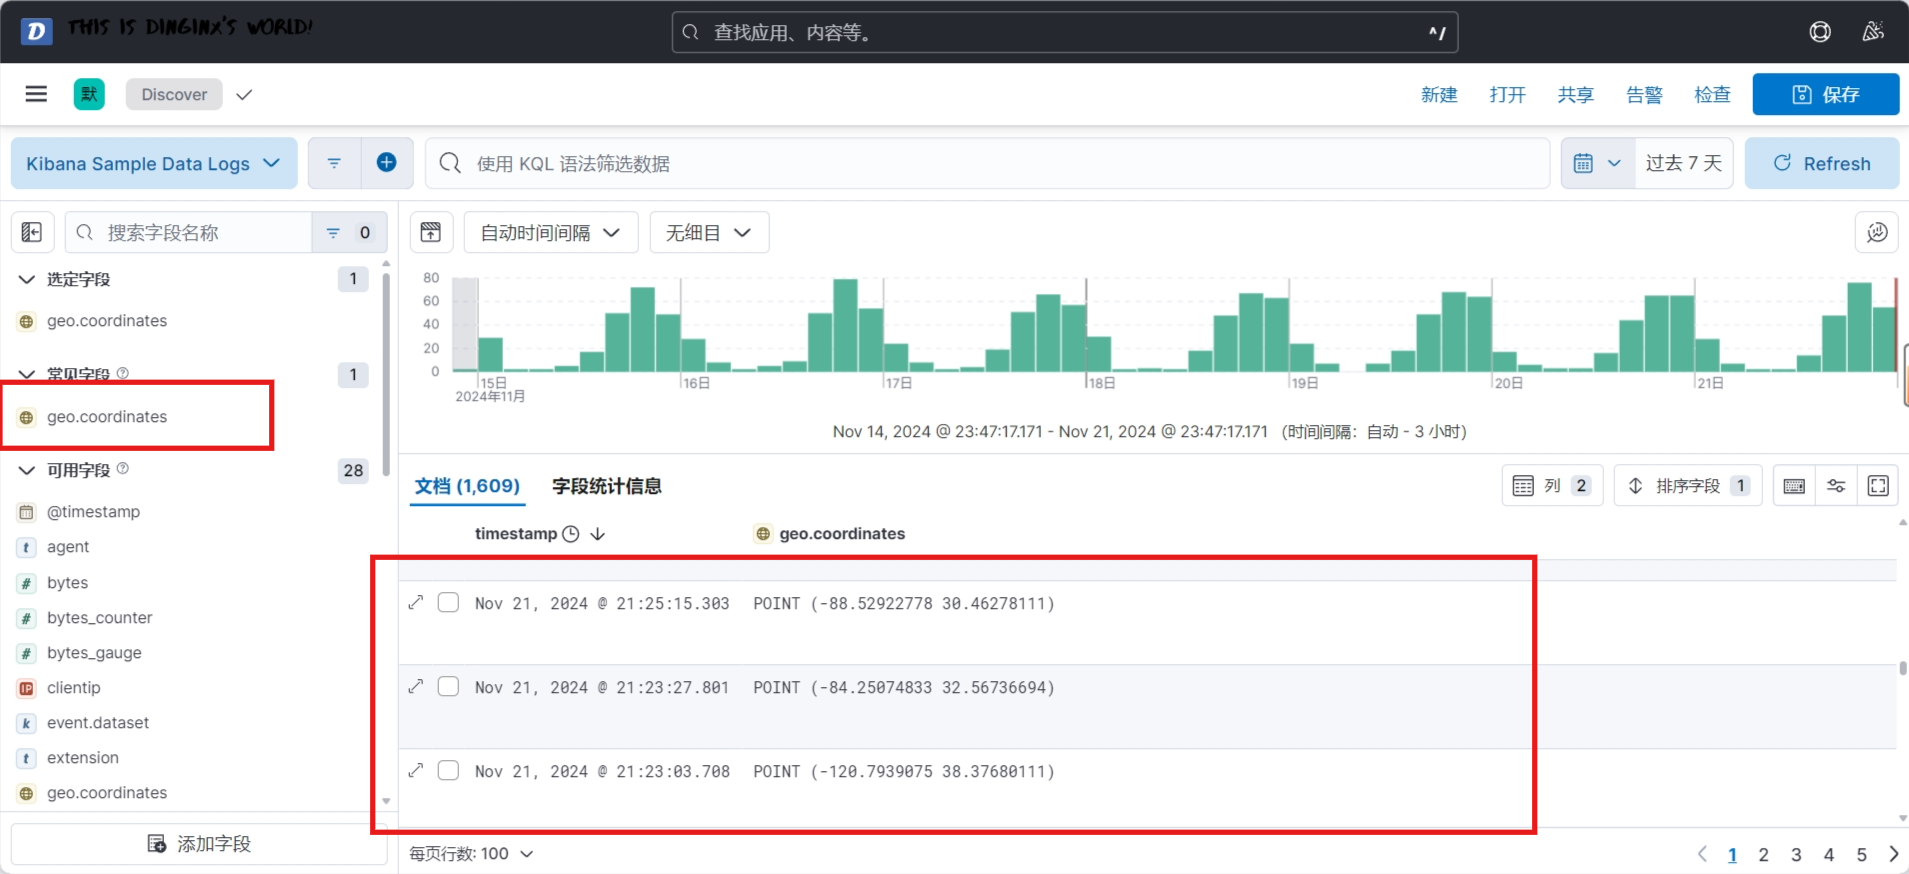
查看maps
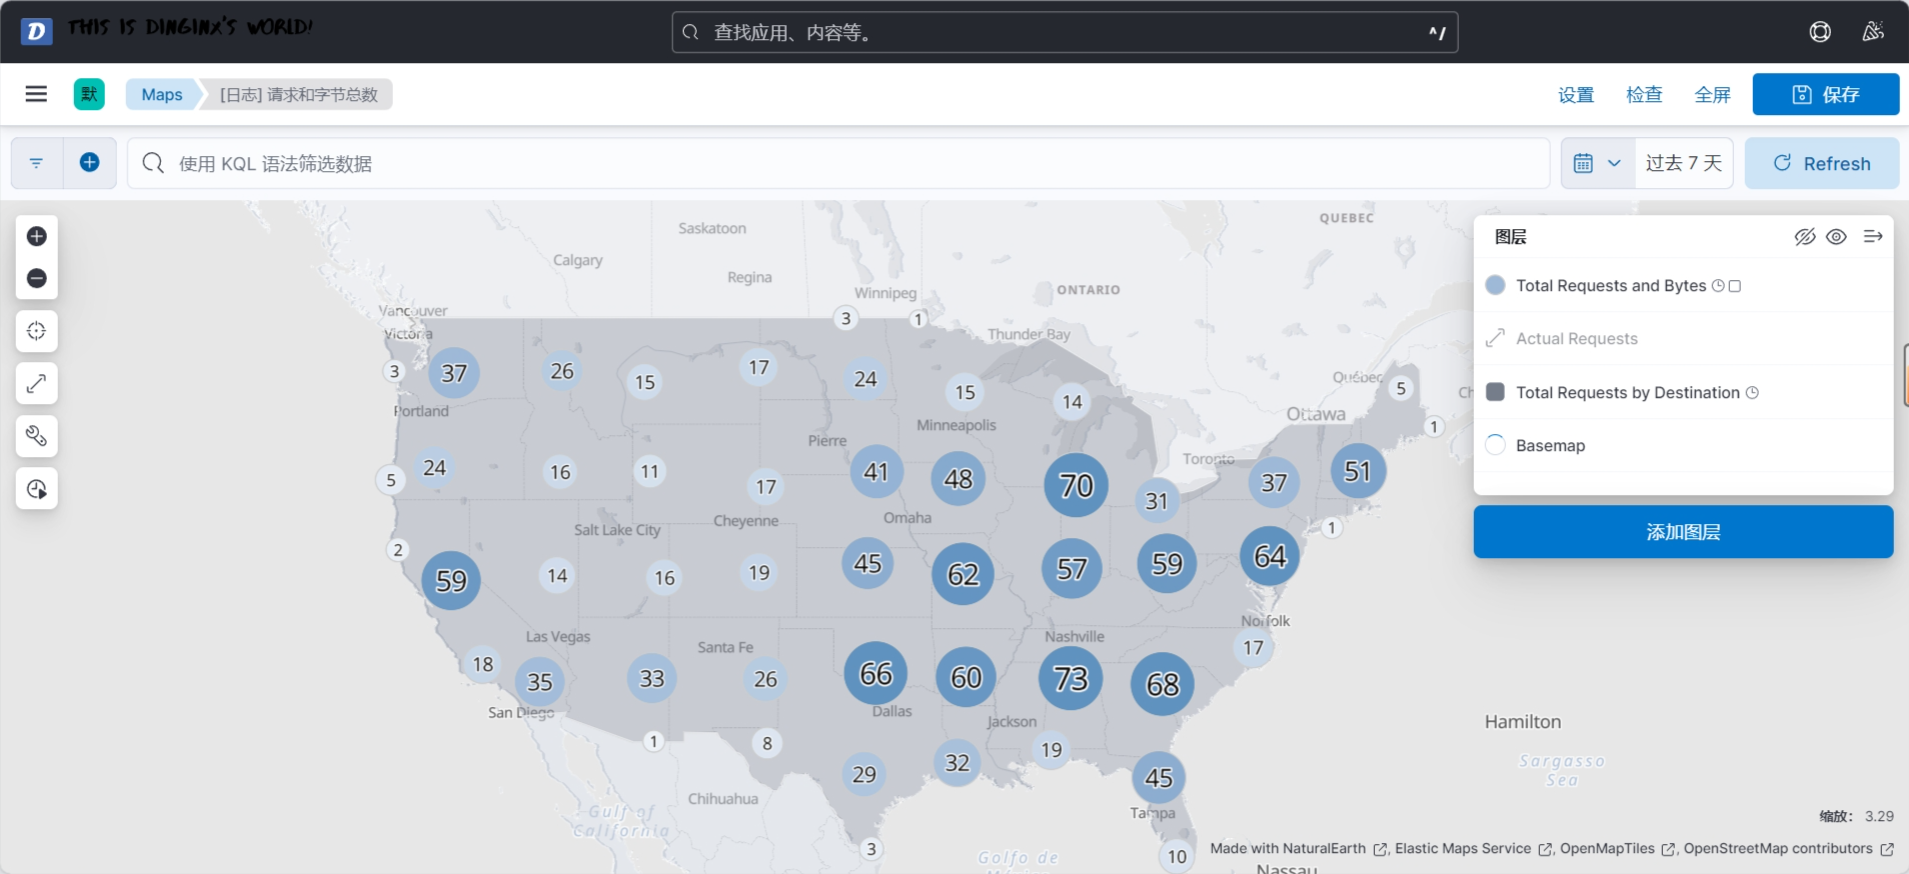
6.1.7.2 创建地图
7.x支持 float格式,8.x支持geo_point类型。
默认的地理位置字段的类型导致出现下面的错误
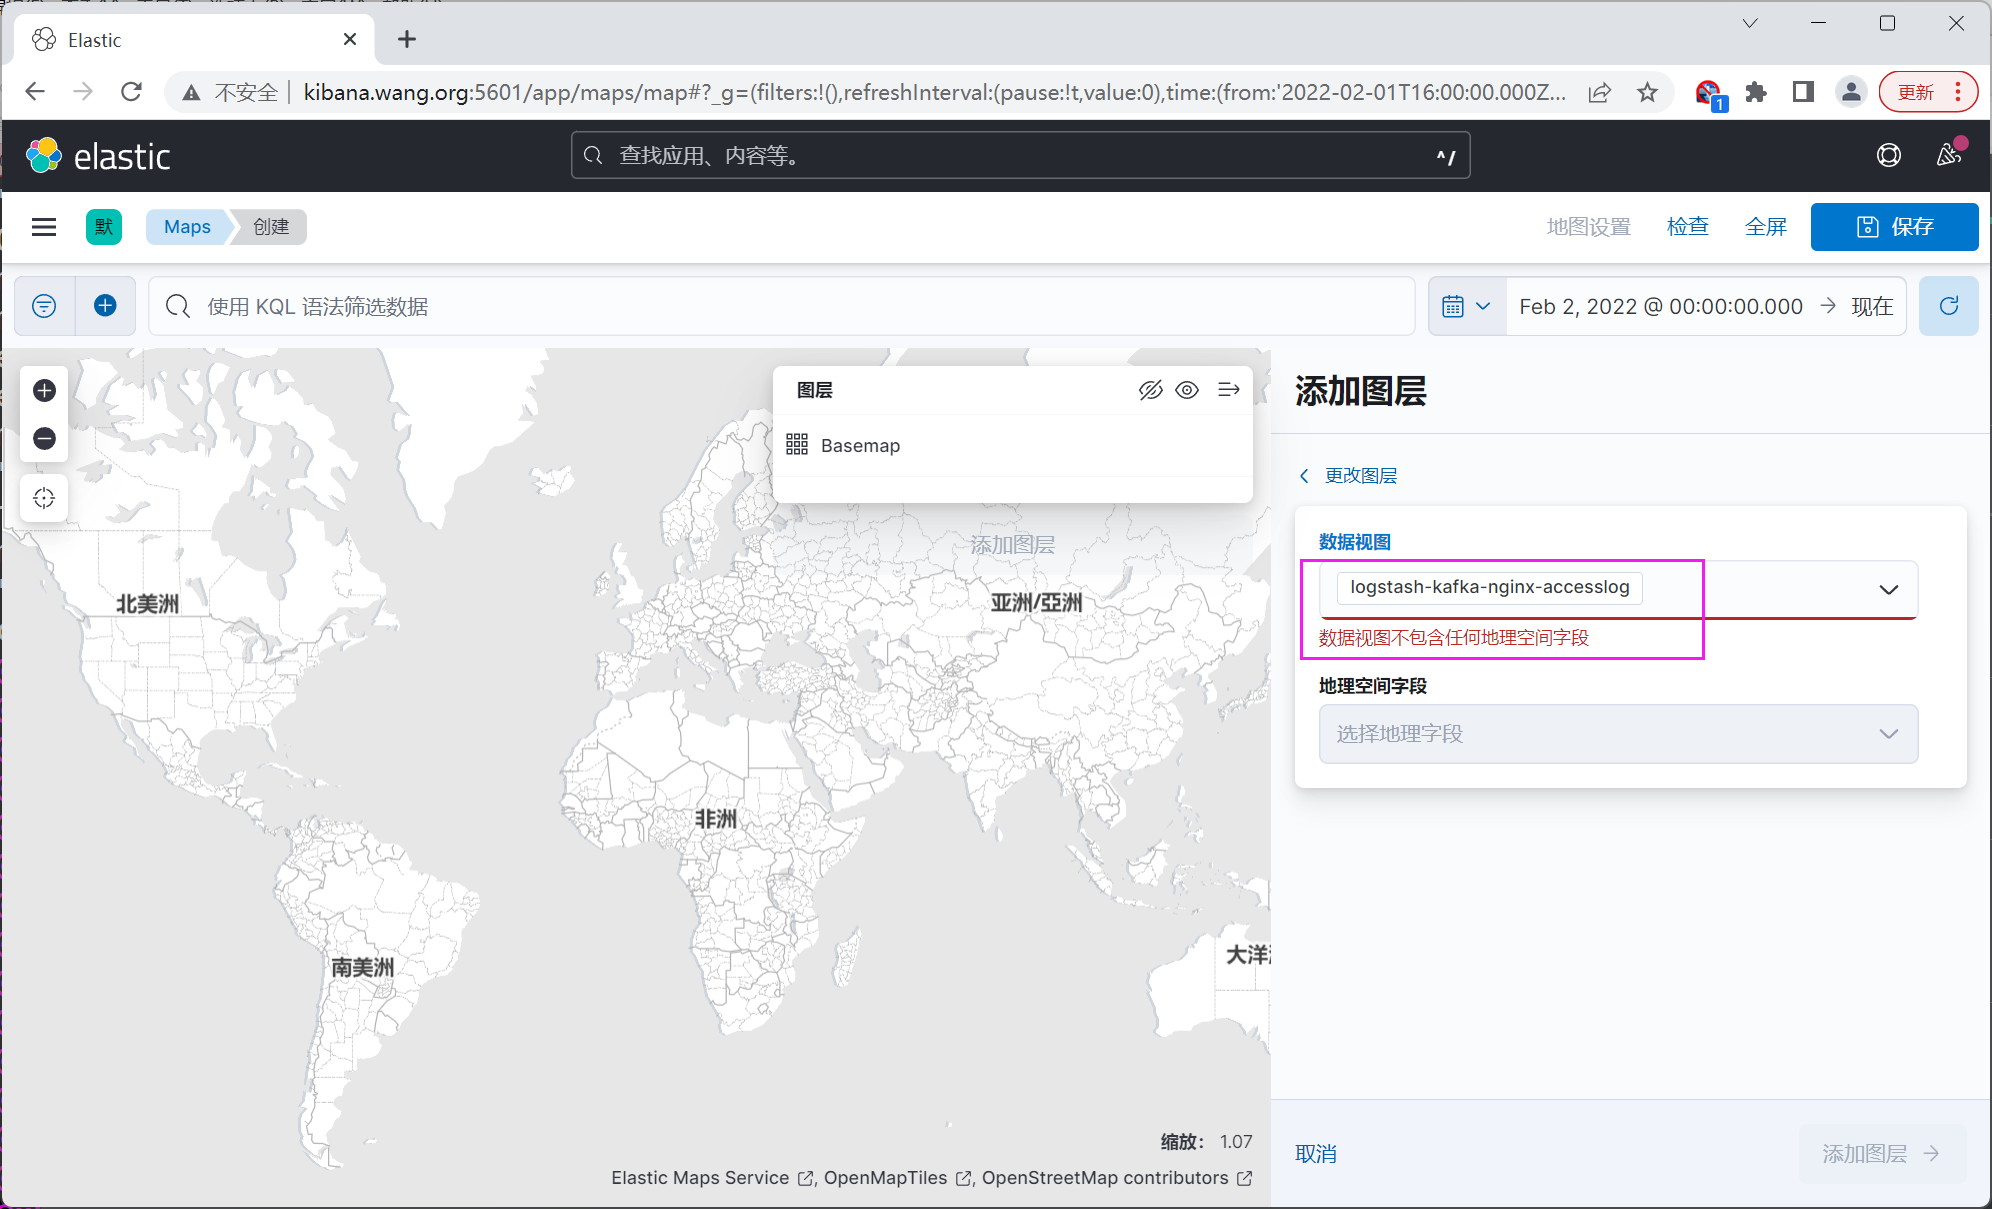
说明
ES8 要求地图数据类型geo_point类型,在logstash的地址信息的格式使用mutate(支持的数据类型:integer,integer_eu,float,float_eu,string,boolean)可以转换成 float类型而不支持geo_point类型,所以需要转换一下logstash在传递信息到es时候的模板信息,将地址信息转换成geo_point类型即可
解决方案:
-
获取模板
-
修改模板
-
使用模板
在开发工具执行下面指令,获取模版设置,复制mappings块中的所有内容
#查询索引信息
GET nginxaccess-2023.02.20#修改索引信息并生成索引模板,文章末尾需要补一个}
PUT /_template/template_nginx_accesslog
{"index_patterns": ["nginxaccess-*"],"order": 0,"aliases": {},"mappings": {			#复制从此处开始到setting以上内容"properties": {"@timestamp": {"type": "date"},"@version": {"type": "text","fields": {"keyword": {"type": "keyword","ignore_above": 256}}},"agent": {"properties": {"ephemeral_id": {"type": "text","fields": {"keyword": {"type": "keyword","ignore_above": 256}}},"id": {"type": "text","fields": {"keyword": {"type": "keyword","ignore_above": 256}}},"name": {"type": "text","fields": {"keyword": {"type": "keyword","ignore_above": 256}}},"type": {"type": "text","fields": {"keyword": {"type": "keyword","ignore_above": 256}}},"version": {"type": "text","fields": {"keyword": {"type": "keyword","ignore_above": 256}}}}},"clientip": {"type": "text","fields": {"keyword": {"type": "keyword","ignore_above": 256}}},"domain": {"type": "text","fields": {"keyword": {"type": "keyword","ignore_above": 256}}},"ecs": {"properties": {"version": {"type": "text","fields": {"keyword": {"type": "keyword","ignore_above": 256}}}}},"event": {"properties": {"original": {"type": "text","fields": {"keyword": {"type": "keyword","ignore_above": 256}}}}},"geoip": {"properties": {"coordinates": {"type": "geo_point"		#只需修改此行即可},"geo": {"properties": {"city_name": {"type": "text","fields": {"keyword": {"type": "keyword","ignore_above": 256}}},"continent_code": {"type": "text","fields": {"keyword": {"type": "keyword","ignore_above": 256}}},"country_iso_code": {"type": "text","fields": {"keyword": {"type": "keyword","ignore_above": 256}}},"country_name": {"type": "text","fields": {"keyword": {"type": "keyword","ignore_above": 256}}},"location": {"properties": {"lat": {"type": "float"},"lon": {"type": "float"}}},"postal_code": {"type": "text","fields": {"keyword": {"type": "keyword","ignore_above": 256}}},"region_iso_code": {"type": "text","fields": {"keyword": {"type": "keyword","ignore_above": 256}}},"region_name": {"type": "text","fields": {"keyword": {"type": "keyword","ignore_above": 256}}},"timezone": {"type": "text","fields": {"keyword": {"type": "keyword","ignore_above": 256}}}}},"ip": {"type": "text","fields": {"keyword": {"type": "keyword","ignore_above": 256}}},"mmdb": {"properties": {"dma_code": {"type": "long"}}}}},"host": {"properties": {"name": {"type": "text","fields": {"keyword": {"type": "keyword","ignore_above": 256}}}}},"http_host": {"type": "text","fields": {"keyword": {"type": "keyword","ignore_above": 256}}},"http_user_agent": {"type": "text","fields": {"keyword": {"type": "keyword","ignore_above": 256}}},"input": {"properties": {"type": {"type": "text","fields": {"keyword": {"type": "keyword","ignore_above": 256}}}}},"log": {"properties": {"file": {"properties": {"path": {"type": "text","fields": {"keyword": {"type": "keyword","ignore_above": 256}}}}},"offset": {"type": "long"}}},"referer": {"type": "text","fields": {"keyword": {"type": "keyword","ignore_above": 256}}},"responsetime": {"type": "float"},"size": {"type": "long"},"status": {"type": "text","fields": {"keyword": {"type": "keyword","ignore_above": 256}}},"tags": {"type": "text","fields": {"keyword": {"type": "keyword","ignore_above": 256}}},"tcp_xff": {"type": "text","fields": {"keyword": {"type": "keyword","ignore_above": 256}}},"upstreamhost": {"type": "text","fields": {"keyword": {"type": "keyword","ignore_above": 256}}},"upstreamtime": {"type": "float"},"uri": {"type": "text","fields": {"keyword": {"type": "keyword","ignore_above": 256}}},"xff": {"type": "text","fields": {"keyword": {"type": "keyword","ignore_above": 256}}}}}
}
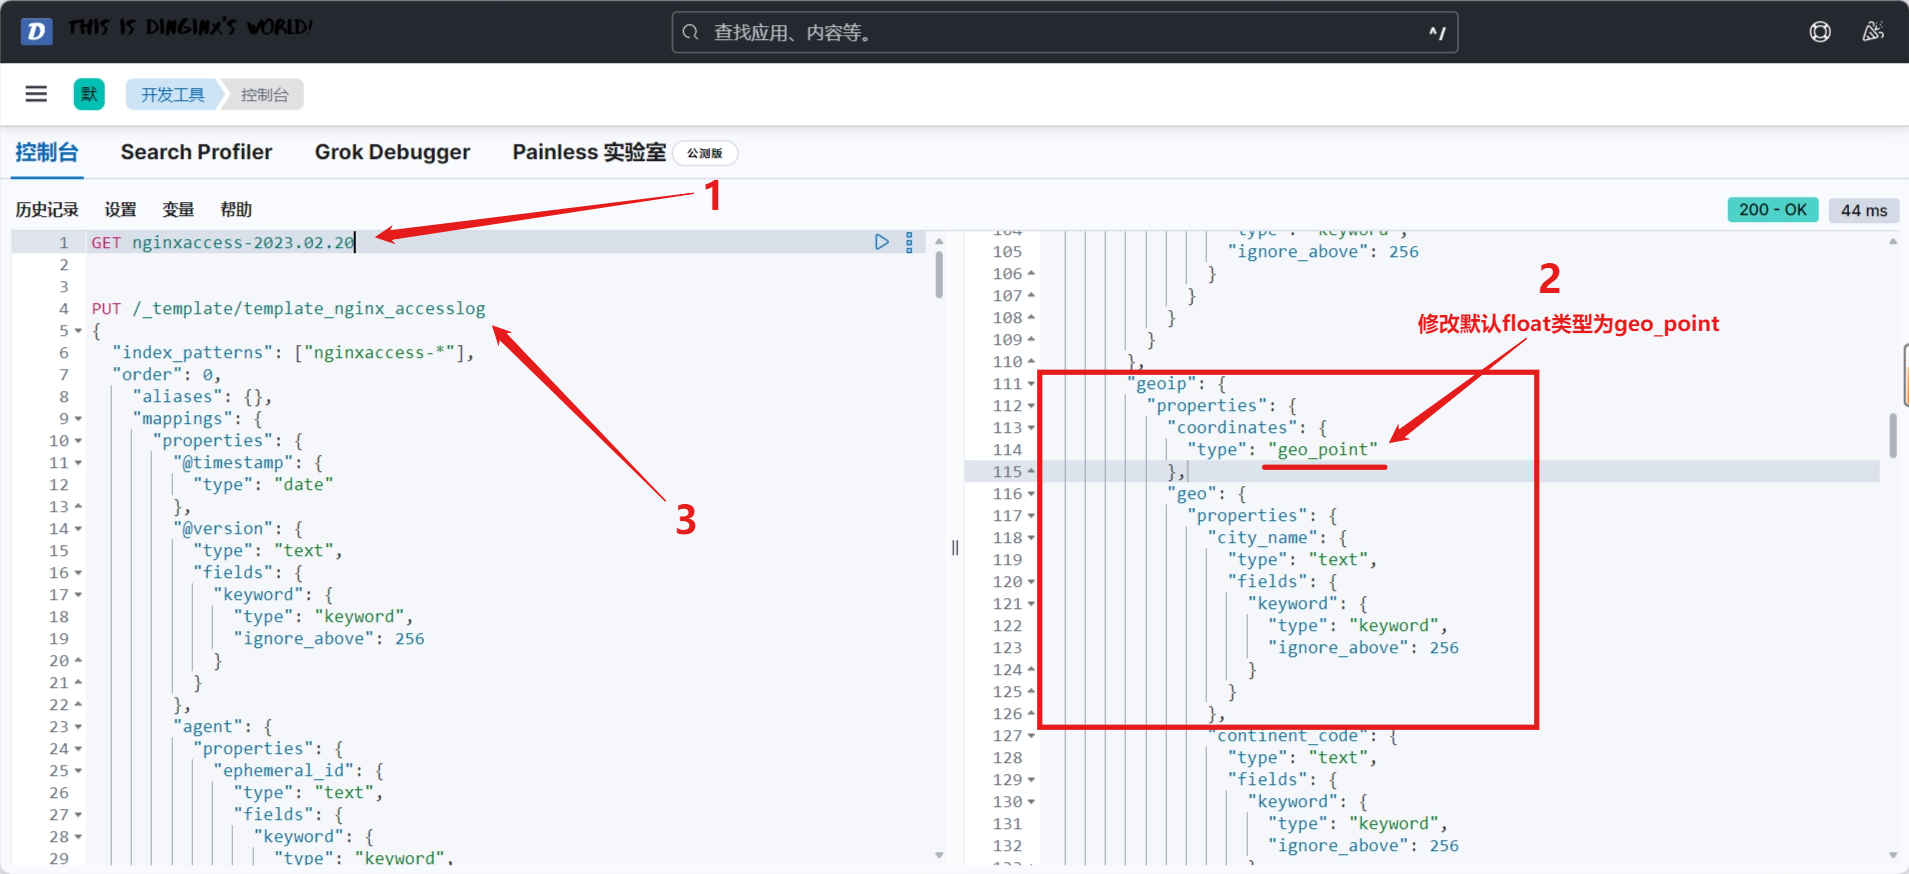
确认出现geoip 相关字段
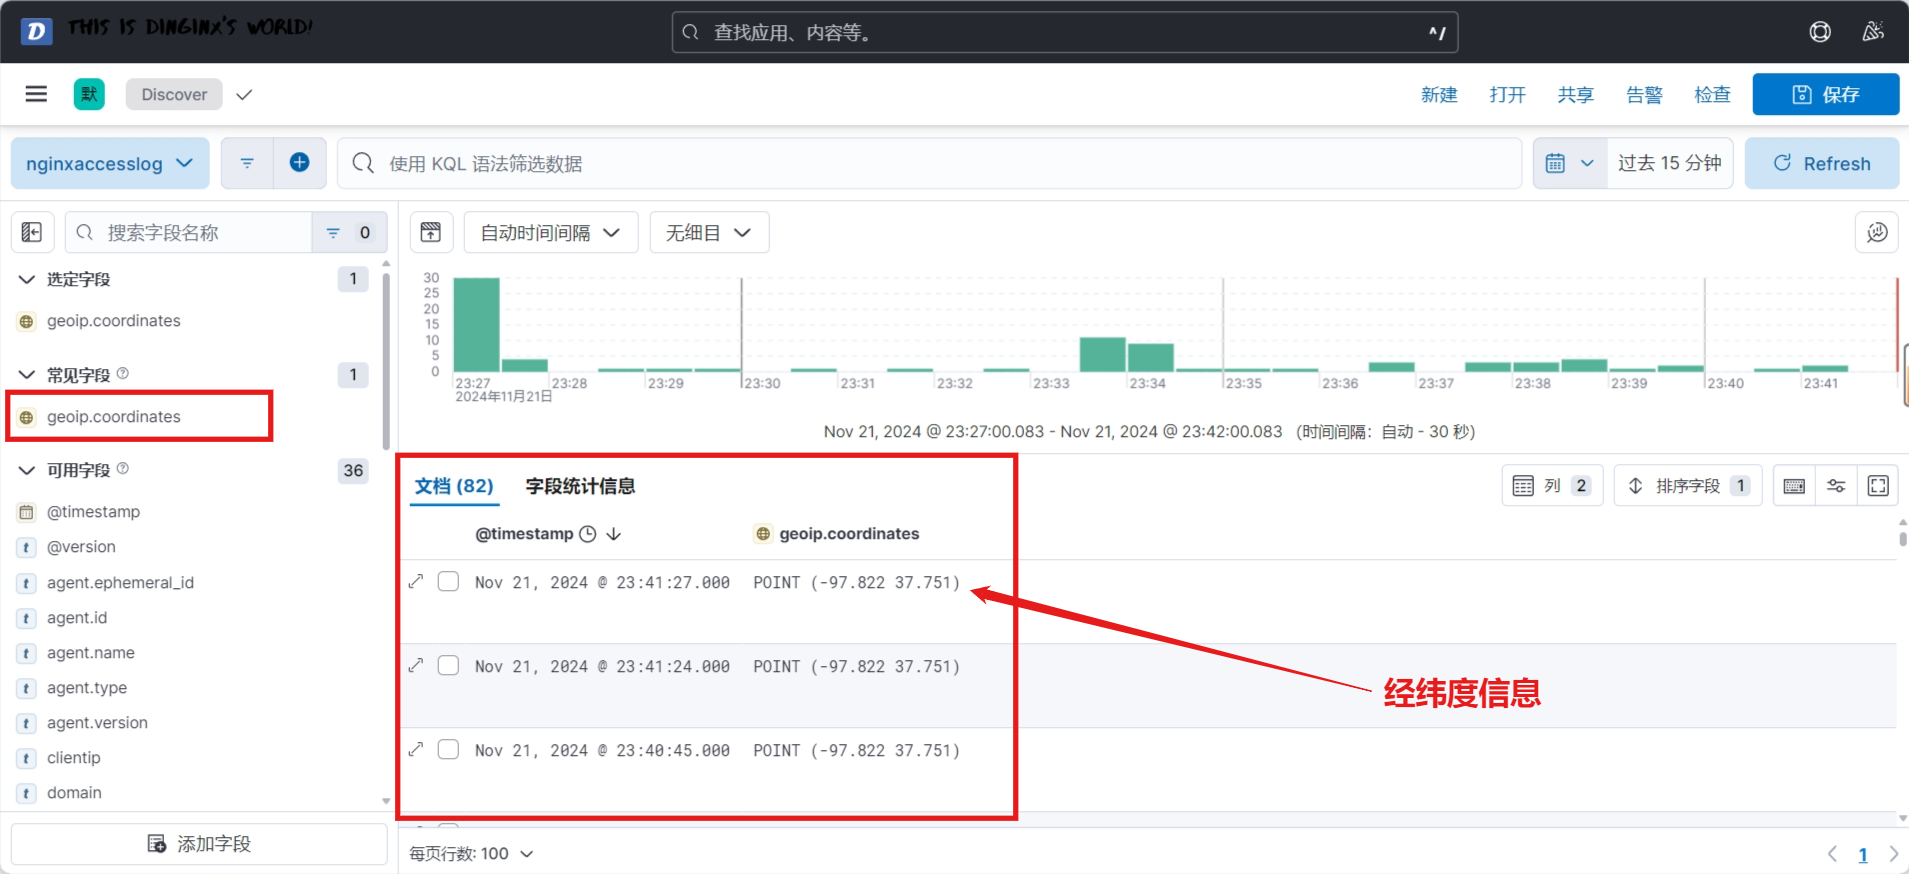
6.1.7.2.1 8.14实现
要解决默认的地理位置字段的类型导致出现下面的错误
必须要先删除旧的索引数据,上面修改才能生效
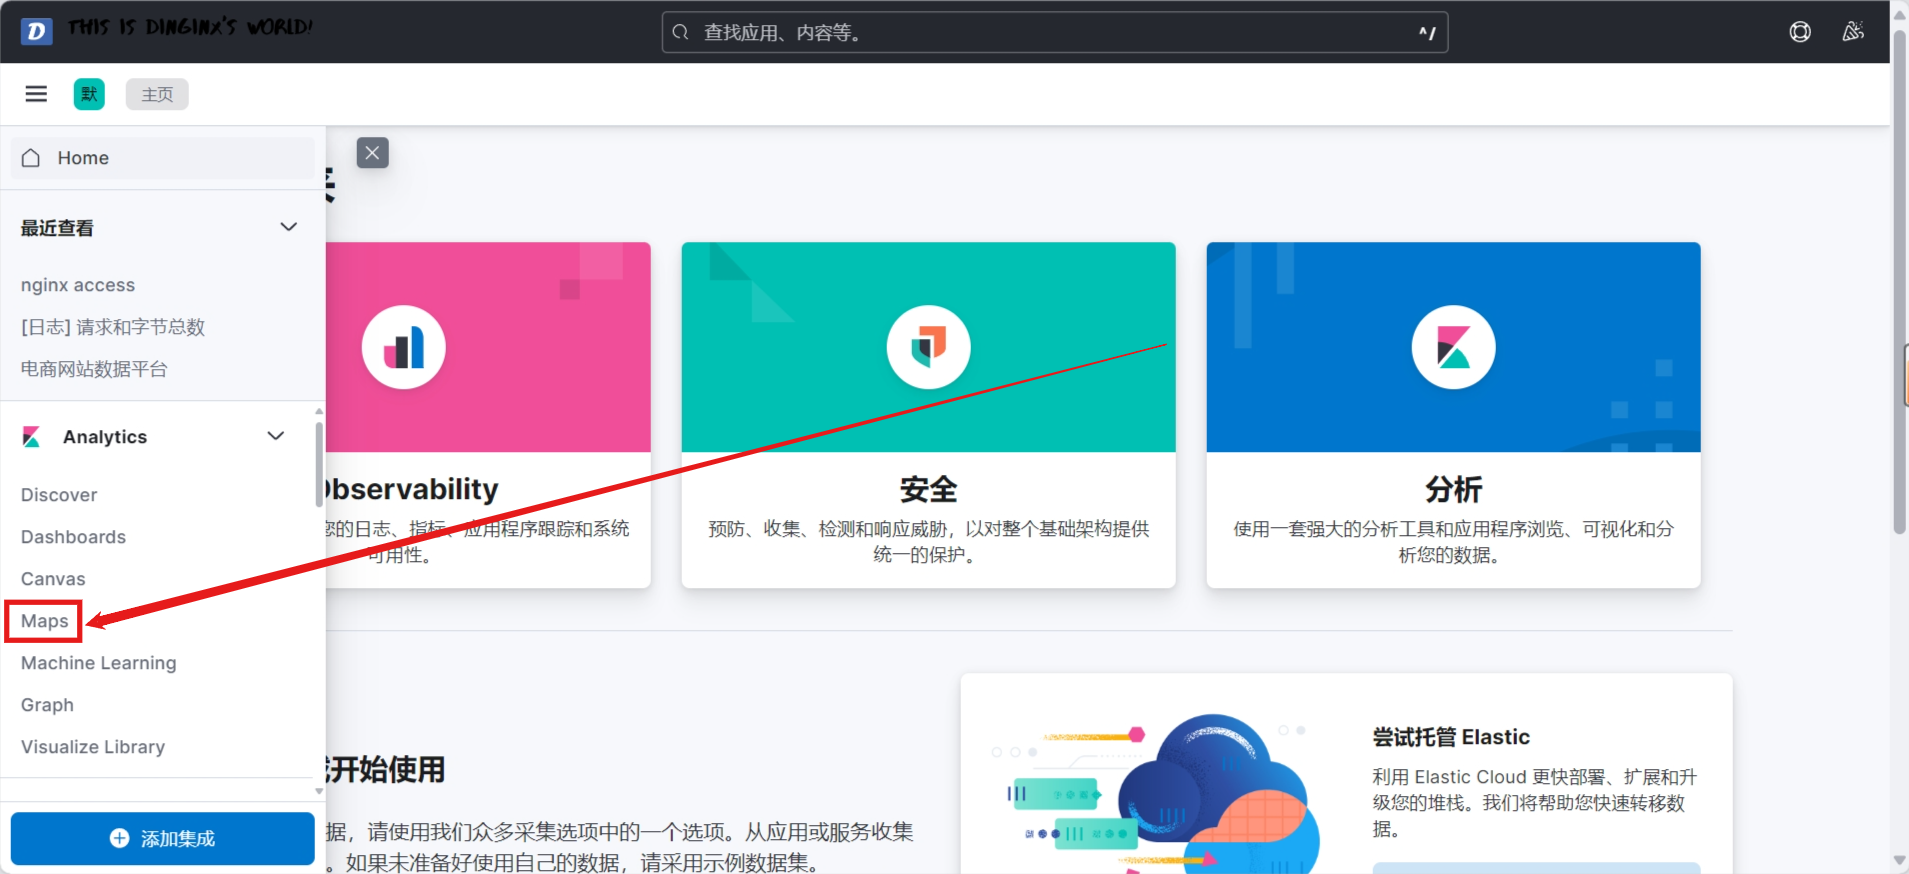
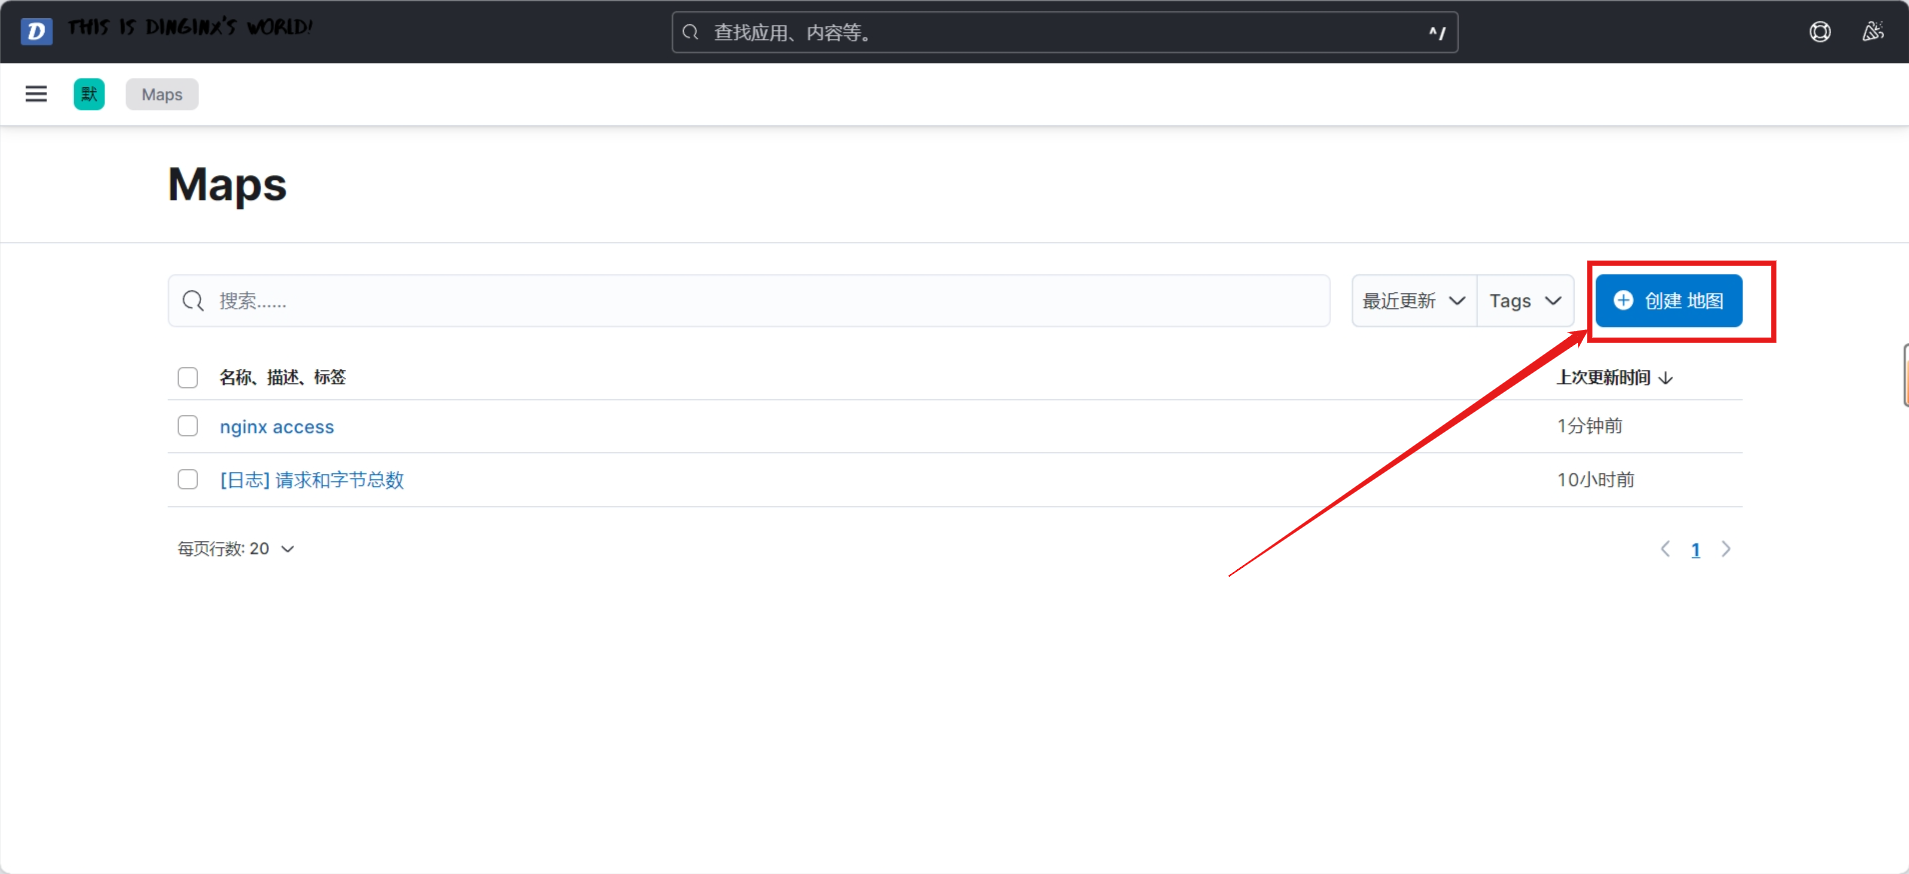
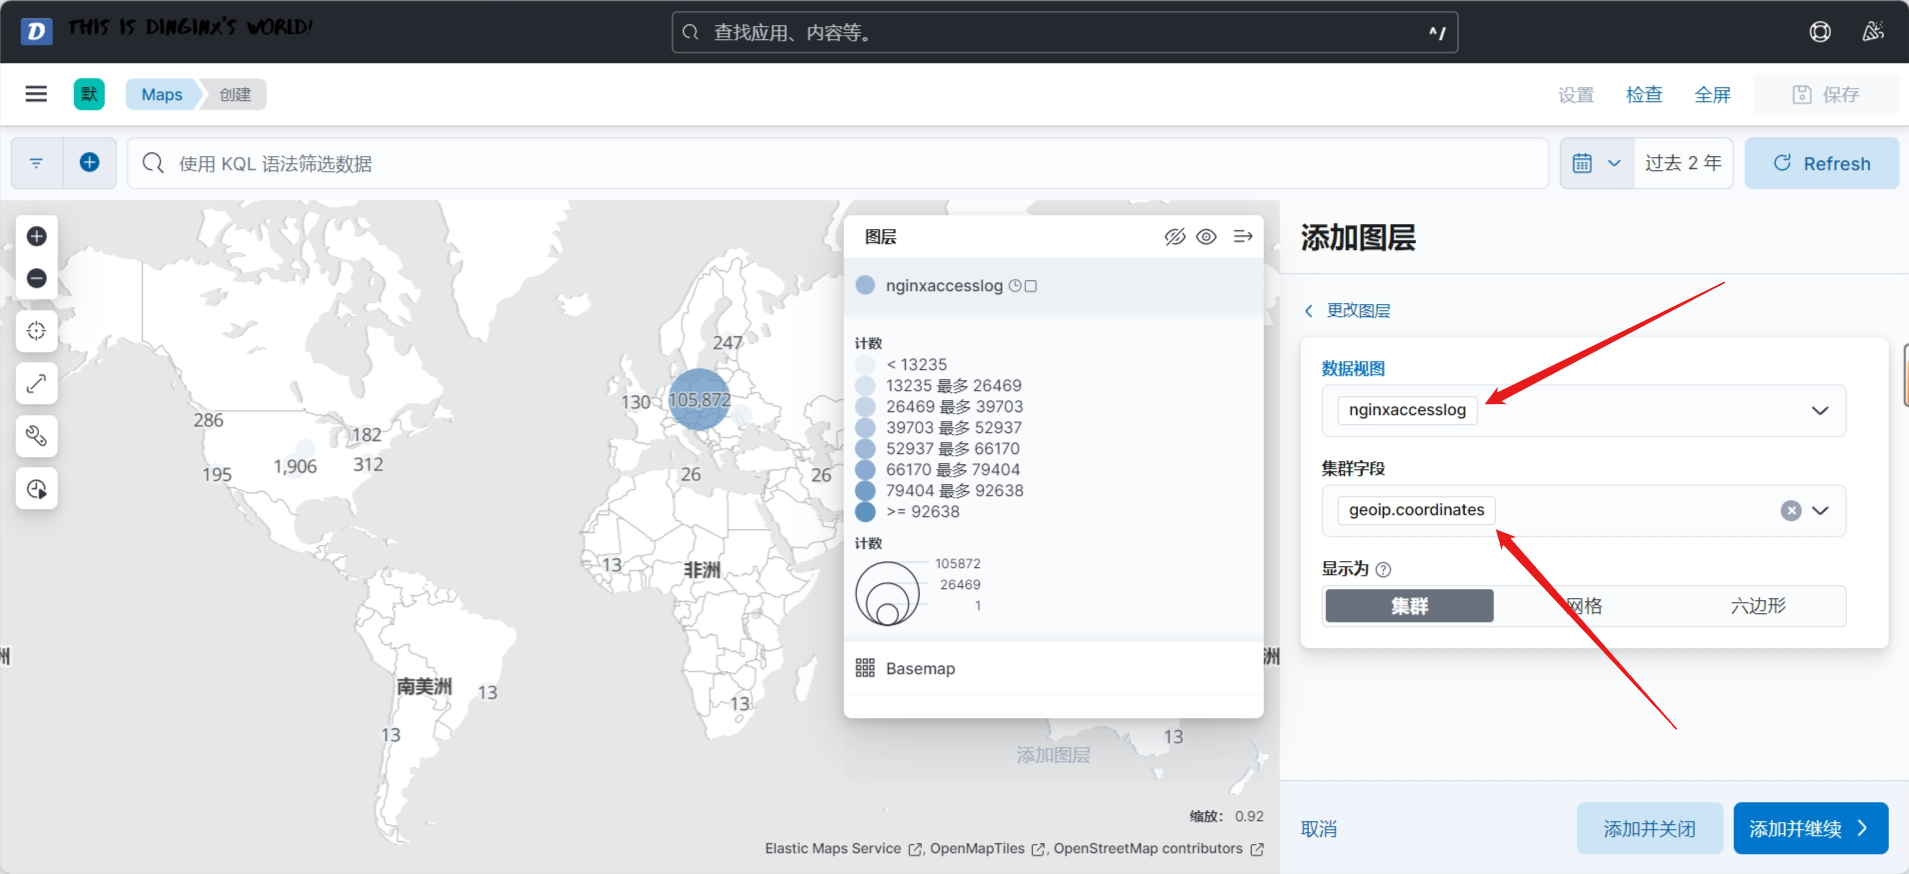
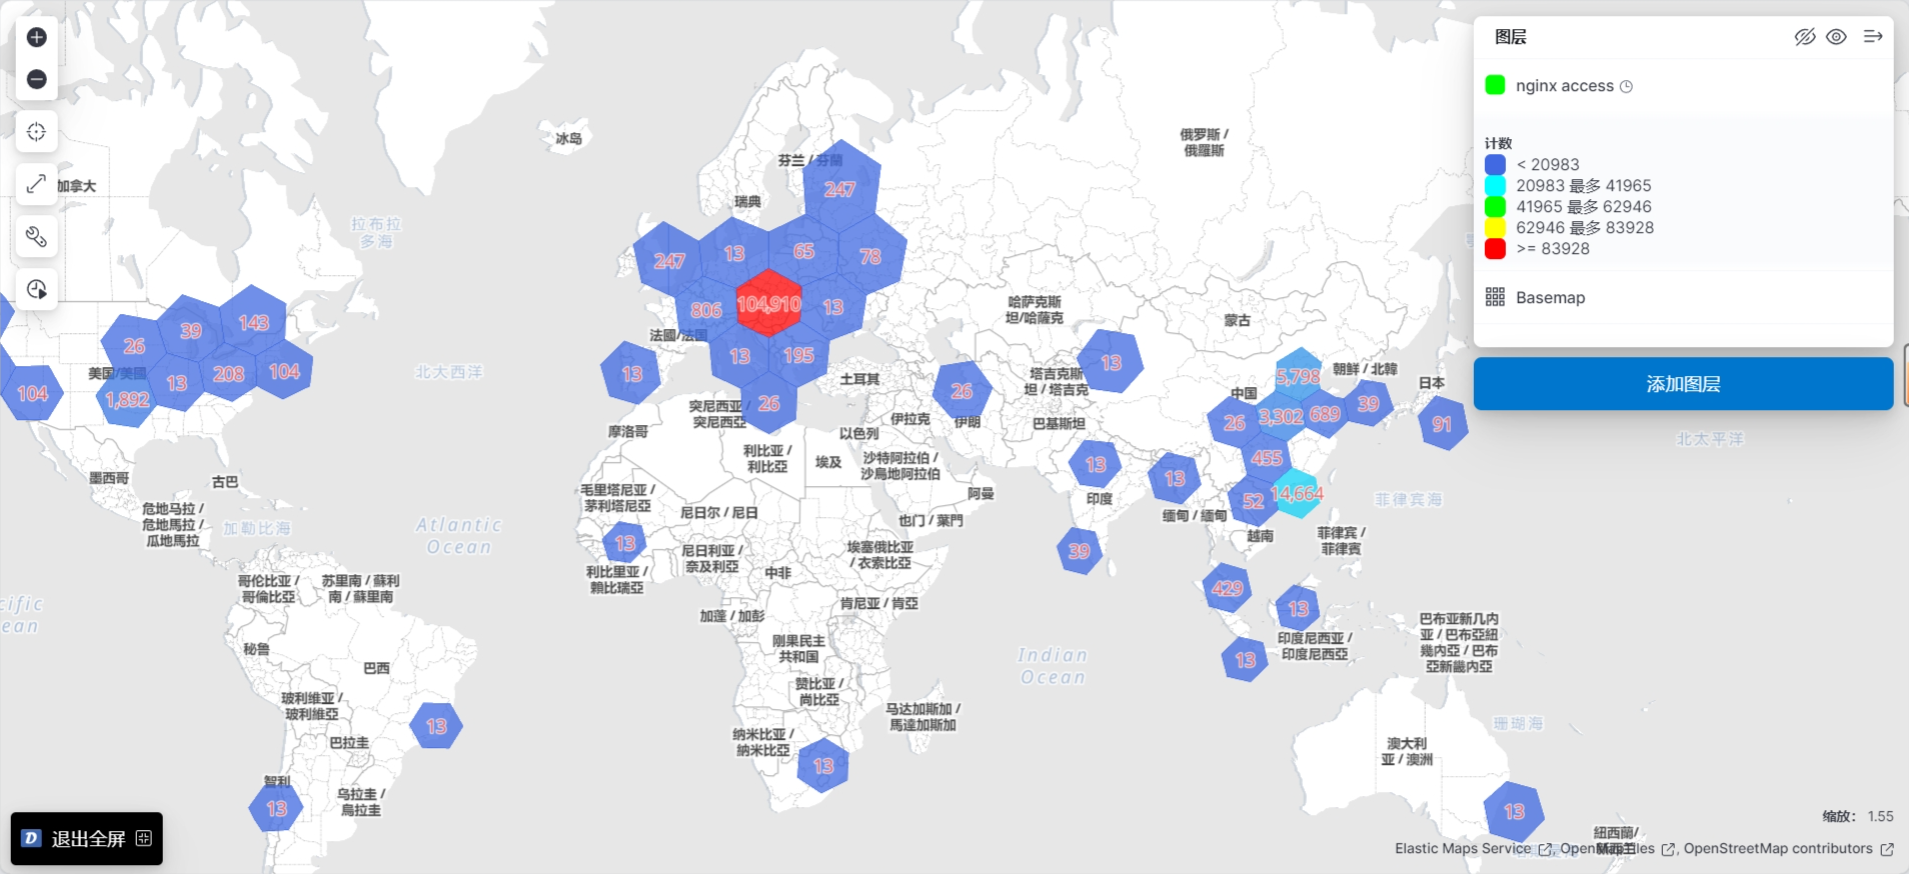
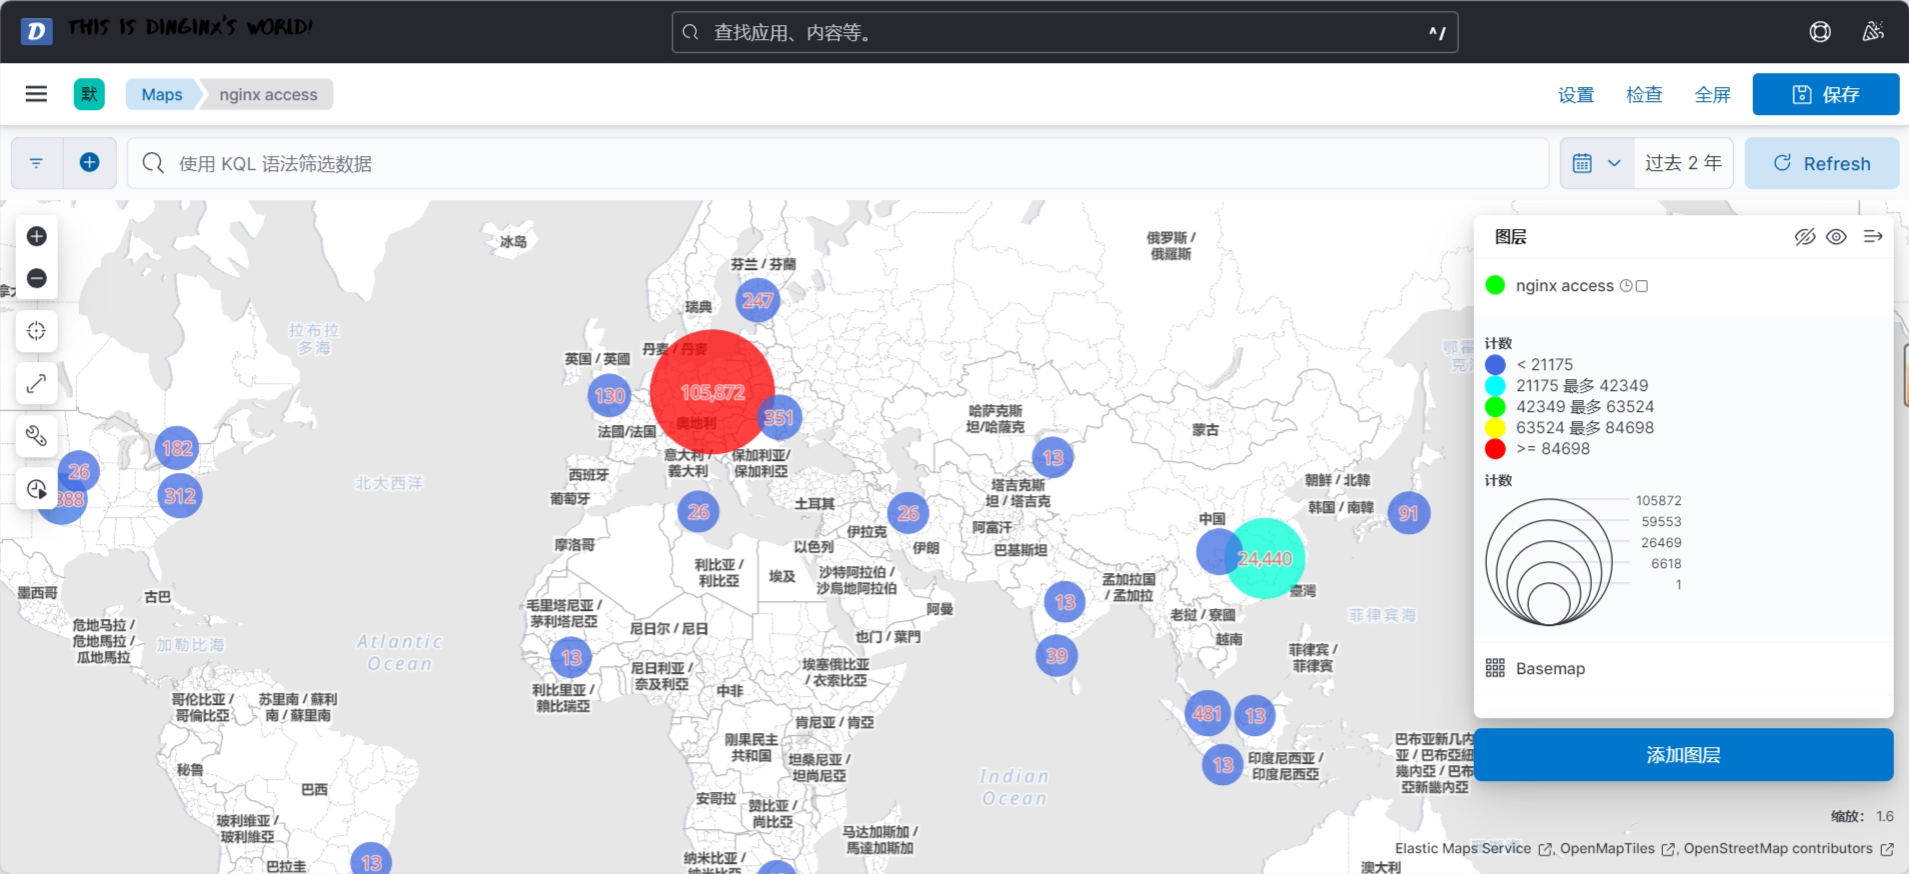
6.1.7.2.2 7.X实现
直接按6.1.7.2.1 8.14实现步骤添加即可,无需修改索引模板。索引模板名必须以 logstash- 开头
所有的事情,只是在开始的时候是原本的样子,越往后越偏离;
6.2 Filebeat 收集Nginx日志并写入 Kafka 缓存发送至Elasticsearch
虽然利用redis 可以实现elasticsearch 缓存功能,减轻elasticsearch的压力,但不支持的redis集群,存在单点问题,可以利用kafka代替redis,且支持kafka集群,消除单点故障隐患。
官方文档
https://www.elastic.co/guide/en/beats/filebeat/current/kafka-output.html
6.2.1 环境规划
#一台Kibana
11.0.1.100#三台ES集群
11.0.1.101
11.0.1.102
11.0.1.103#logstash
11.0.1.10 logstash1
11.0.1.100 logstash2#准备三台kafka,安装过程略
11.0.1.11
11.0.1.12
11.0.1.13#filebeat和nginx
11.0.1.104
6.2.2 Filebeat 收集 Nginx 的访问和错误日志并发送至 kafka
[root@kibana01 ~]# cat /etc/filebeat/filebeat.yml
# Filebeat Inputs
filebeat.inputs:
- type: logenabled: truepaths:- /var/log/nginx/access_json.logjson.keys_under_root: true       # 将JSON键值提升到根级别json.overwrite_keys: true        # 如果键值存在,允许覆盖tags: ["nginx-access"]        # 给日志打上标签,便于区分- type: logenabled: truepaths:- /var/log/nginx/error_json.logjson.keys_under_root: true       # 将JSON键值提升到根级别tags: ["nginx-error"]         # 给日志打上标签,便于区分- type: logenabled: truepaths:- /var/log/syslogtags: ["syslog"]#output.logstash:#  hosts: ["11.0.1.10:5044"]# Kafka Output Configuration
output.kafka:hosts: ["11.0.1.11:9092", "11.0.1.12:9092", "11.0.1.13:9092"]  # Kafka broker 列表topic: filebeat-log                                          # 指定 Kafka topicpartition.round_robin:reachable_only: true                                          # 仅发送到可用的分区required_acks: 1                                                # 等待主分区的确认compression: gzip                                               # 使用 gzip 压缩消息max_message_bytes: 11.0.10                                      # 每条消息最大1MB# redis为标准输出
#output.redis:
#  hosts: ["11.0.1.10:6379"]
#  key: "filebeat"
#  password: "123456"
#  db: "0"
#  timeout: 5#output.elasticsearch:#  hosts: ["11.0.1.101:9200", "11.0.1.102:9200", "11.0.1.103:9200"]##  indices:#    - index: "nginx-access-%{[agent.version]}-%{+yyyy.MM.dd}"#      when.contains:#        tags: "nginx-access"  # 匹配单个值,而非数组##    - index: "nginx-error-%{[agent.version]}-%{+yyyy.MM.dd}"#      when.contains:#        tags: "nginx-error"#setup.ilm.enabled: false  # 禁用 Elasticsearch 的索引生命周期管理(ILM)#setup.template.name: "nginx104"  # 模板名称,用于处理 NGINX 日志的字段映射#setup.template.pattern: "nginx104-*"  # 模板匹配模式,应用于所有以 "nginx-" 开头的索引##setup.template.settings:  # 定义 Elasticsearch 模板的配置选项#  index.number_of_shards: 3  # 设置每个索引的主分片数量为 3#  index.number_of_replicas: 1  # 设置每个分片的副本数量为 1[root@kibana01 ~]# systemctl restart filebeat.service
#输入模拟访问数据
[root@kibana01 ~]# cat /var/log/nginx/access_json.log-20230221 > /var/log/nginx/access_json.log
6.2.3 配置 Logstash 发送读取 Kafka 日志到 Elasticsearch
root@logstash:~# cat /etc/logstash/conf.d/nginx_kafka_to_es.conf
input {kafka {bootstrap_servers => "11.0.1.11:9092"topics => "filebeat-log"codec => "json"}
}filter {if "nginx-access" in [tags] {geoip {source => "clientip"target => "geoip"add_field => ["[geoip][coordinates]","%{[geoip][geo][location][lon]}"]add_field => ["[geoip][coordinates]","%{[geoip][geo][location][lat]}"]}mutate {convert => [ "[geoip][coordinates]", "float"]       }}mutate {convert => ["upstreamtime","float"]}
}
output {if "syslog" in [tags] {elasticsearch {hosts => ["11.0.1.101:9200","11.0.1.102:9200","11.0.1.103:9200"]index => "syslog-%{+YYYY.MM.dd}"}}if "nginx-access" in [tags] {elasticsearch {hosts => ["11.0.1.101:9200","11.0.1.102:9200","11.0.1.103:9200"]index => "nginxaccess-%{+YYYY.MM.dd}"template_overwrite => true}stdout {codec => "rubydebug"}}if "nginx-error" in [tags] {elasticsearch {hosts => ["11.0.1.101:9200","11.0.1.102:9200","11.0.1.103:9200"]index => "nginxerrorlog-%{+YYYY.MM.dd}"template_overwrite => true}}
}
6.2.4 验证结果
注意:Logstash先启动订阅kafka,再生成新数据才能采集
利用 kafka tool 工具查看
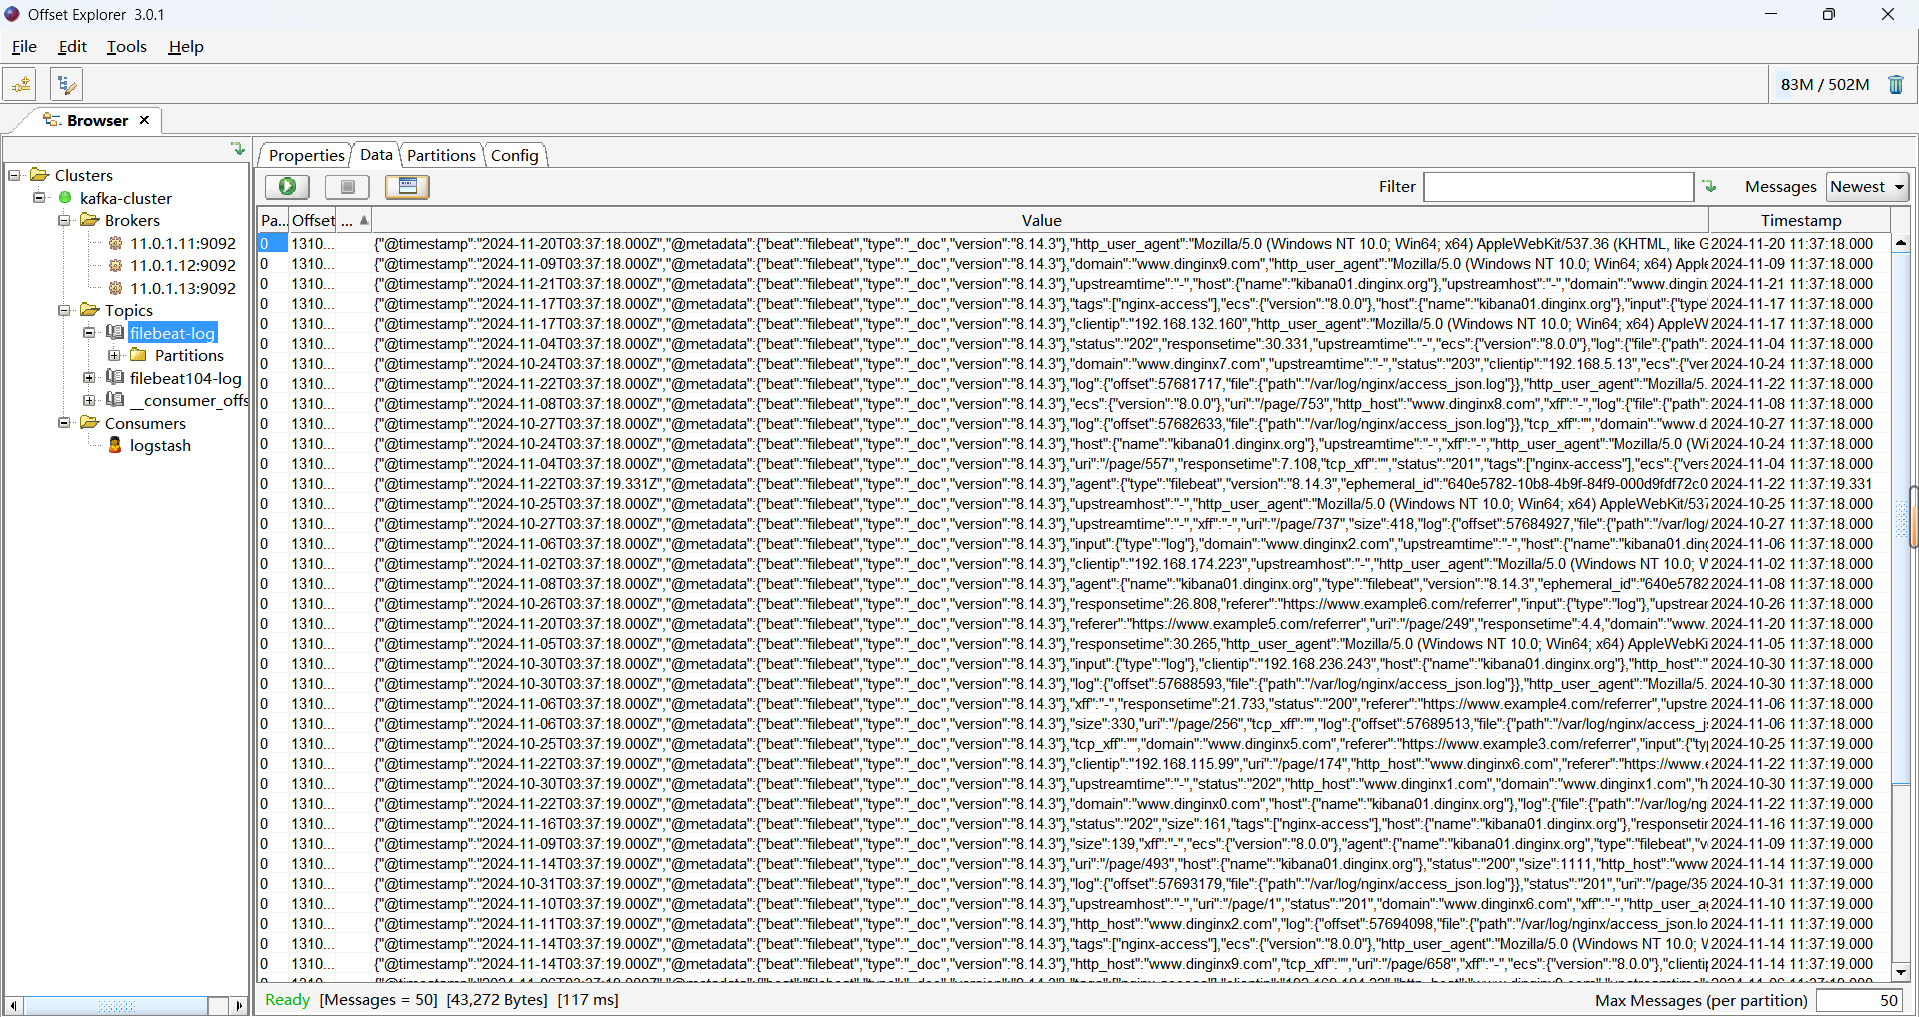
6.3 Logstash收集日志写入 MySQL 数据库
ES中的日志后续会被删除,但有些重要数据,比如状态码、客户端IP、客户端浏览器版本等,后期可以会按月或年做数据统计等,因此需要持久保存;
可以将重要数据写入数据库达到持久保存目的;
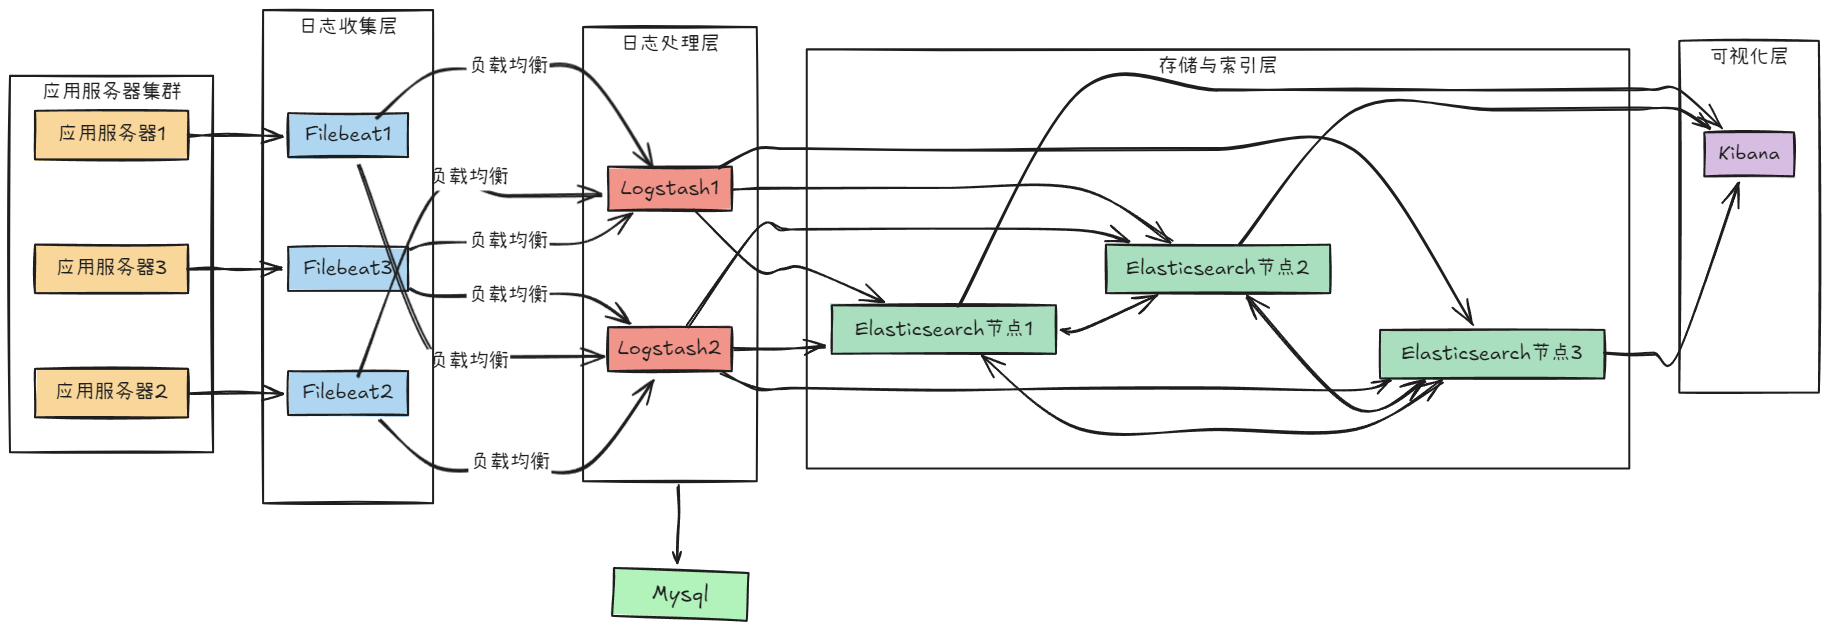
6.4.1 安装 MySQL 数据库
root@logstash:~# apt update && apt -y install mysql-server
root@logstash:~# sed -i '/127.0.0.1/s/^/#/' /etc/mysql/mysql.conf.d/mysqld.cnfroot@logstash:~# vim /etc/mysql/mysql.conf.d/mysqld.cnf
bind-address        = 0.0.0.0
mysqlx-bind-address = 0.0.0.0root@logstash:~# systemctl restart mysql.service
root@logstash:~# ss -ntl|grep 3306
LISTEN   0         80                  0.0.0.0:3306             0.0.0.0:*
6.4.2 创建库和表并授权用户登录
root@logstash:~# mysql -uroot -pmysql> create database elk character set utf8 collate utf8_bin;
Query OK, 1 row affected, 2 warnings (0.02 sec)mysql> create user elk@"11.0.1.%" identified by '123456';
Query OK, 0 rows affected (0.10 sec)mysql> grant all privileges on elk.* to elk@"11.0.1.%";
Query OK, 0 rows affected (0.00 sec)mysql> flush privileges;
Query OK, 0 rows affected (0.01 sec)mysql> #创建表,字段对应需要保存的数据字段
mysql> use elk;
Database changed
mysql> CREATE TABLE elklog (->     clientip VARCHAR(39),->     responsetime FLOAT(10,3),->     uri VARCHAR(256),->     status CHAR(3),->     time TIMESTAMP DEFAULT CURRENT_TIMESTAMP,->     INDEX idx_time (time),->     INDEX idx_clientip (clientip)-> );
Query OK, 0 rows affected, 1 warning (0.05 sec)mysql> desc elklog;
+--------------+--------------+------+-----+-------------------+-------------------+
| Field        | Type         | Null | Key | Default           | Extra             |
+--------------+--------------+------+-----+-------------------+-------------------+
| clientip     | varchar(39)  | YES  | MUL | NULL              |                   |
| responsetime | float(10,3)  | YES  |     | NULL              |                   |
| uri          | varchar(256) | YES  |     | NULL              |                   |
| status       | char(3)      | YES  |     | NULL              |                   |
| time         | timestamp    | YES  | MUL | CURRENT_TIMESTAMP | DEFAULT_GENERATED |
+--------------+--------------+------+-----+-------------------+-------------------+
5 rows in set (0.01 sec)
6.4.3 测试用户从 Logstash 主机远程登录
[root@logstash1 ~]#apt -y install mysql-client
root@logstash:~# mysql -uelk -p123456 -h11.0.1.10 -e 'show databases'
mysql: [Warning] Using a password on the command line interface can be insecure.
+--------------------+
| Database           |
+--------------------+
| elk                |
| information_schema |
| performance_schema |
+--------------------+
6.4.4 Logstash 配置 mysql-connector-java 包
MySQL Connector/J是MySQL官方JDBC驱动程序,JDBC(Java Data Base Connectivity,java数据库连接)是一种用于执行SQL语句的Java API,可以为多种关系数据库提供统一访问,它由一组用Java语言编写的类和接口组成。
官方下载地址:https://dev.mysql.com/downloads/connector/
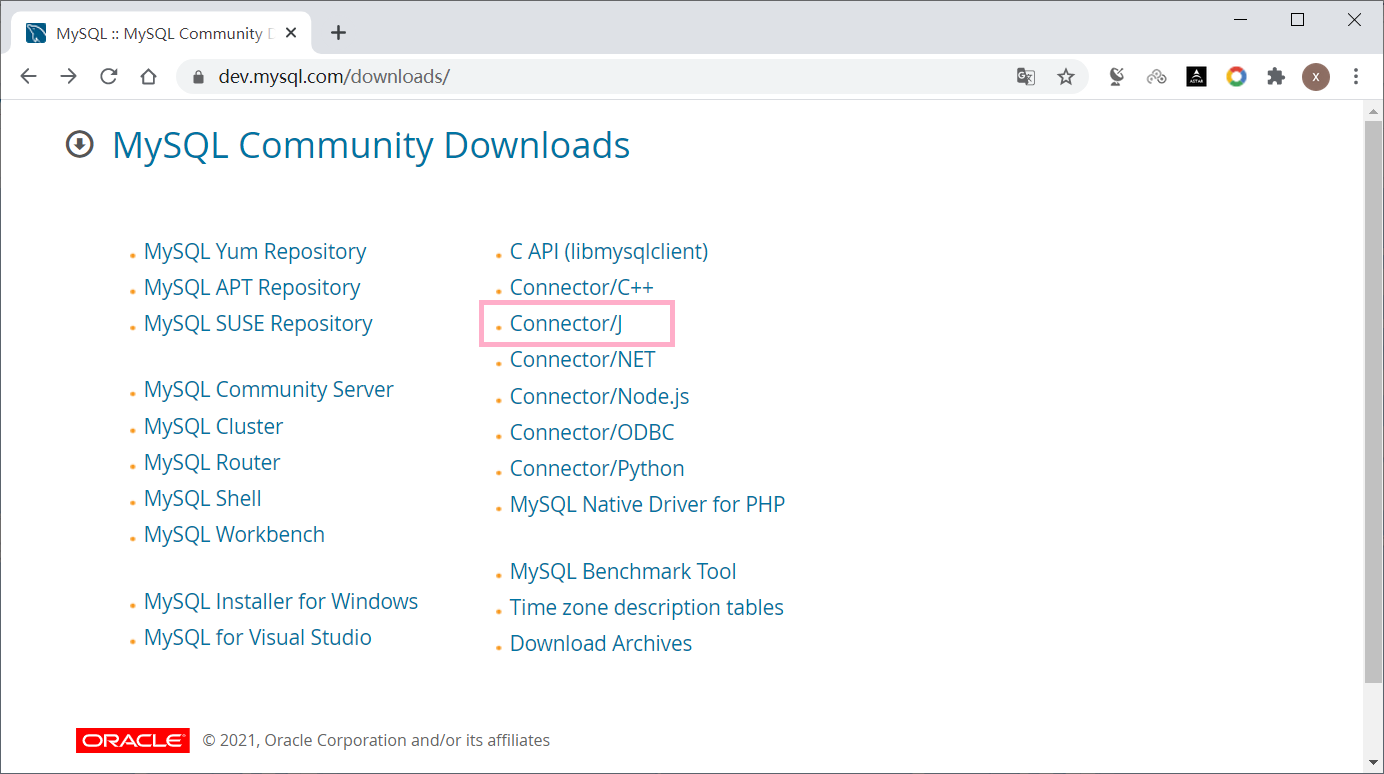
#Ubuntu22.04 安装 mysql-connector
root@logstash:~# wget https://cdn.mysql.com//Downloads/Connector-J/mysql-connector-j_9.1.0-1ubuntu22.04_all.deb
root@logstash:~# dpkg -i mysql-connector-j_9.1.0-1ubuntu22.04_all.deb
root@logstash:~# dpkg -L mysql-connector-j
/.
/usr
/usr/share
/usr/share/doc
/usr/share/doc/mysql-connector-j
/usr/share/doc/mysql-connector-j/CHANGES.gz
/usr/share/doc/mysql-connector-j/INFO_BIN
/usr/share/doc/mysql-connector-j/INFO_SRC
/usr/share/doc/mysql-connector-j/LICENSE.gz
/usr/share/doc/mysql-connector-j/README
/usr/share/doc/mysql-connector-j/changelog.Debian.gz
/usr/share/doc/mysql-connector-j/copyright
/usr/share/java
/usr/share/java/mysql-connector-j-9.1.0.jar
/usr/share/java/mysql-connector-java-9.1.0.jar#复制jar文件到logstash指定的目录下
root@logstash:~# mkdir -p /usr/share/logstash/vendor/jar/jdbc
root@logstash:~# cp /usr/share/java/mysql-connector-j-9.1.0.jar /usr/share/logstash/vendor/jar/jdbc/
root@logstash:~# chown -R logstash.logstash /usr/share/logstash/vendor/jar/
root@logstash:~# ll /usr/share/logstash/vendor/jar/jdbc/ -h
总计 2.5M
drwxr-xr-x 2 logstash logstash 4.0K 11月 23 15:43 ./
drwxr-xr-x 3 logstash logstash 4.0K 11月 23 15:43 ../
-rw-r--r-- 1 logstash logstash 2.5M 11月 23 15:43 mysql-connector-j-9.1.0.jar
6.4.5 更改 Gem 源 (可选)
Logstash 基于 Ruby 语言实现 , 后续需要安装相关插件,需要从 gem 源下载依赖包
ruby 语言使用国外的gem源, 由于网络原因,从国内访问很慢而且不稳定
其官方介绍推荐使用
https://gems.ruby-china.com
root@logstash:~# apt update && apt install -y ruby
root@logstash:~# gem -v
3.3.5#查看默认源
root@logstash:~# gem source -l
*** CURRENT SOURCES ***https://rubygems.org/#修改指定国内的源
root@logstash:~# gem sources --add https://gems.ruby-china.com/ --remove https://rubygems.org/#检查
root@logstash:~# gem source -l
*** CURRENT SOURCES ***https://gems.ruby-china.com/
6.4.6 安装logstash-output-jdbc插件
#查看logstash-plugin帮助
root@logstash:~# /usr/share/logstash/bin/logstash-plugin --help
#查看安装拆插件,默认只有input-jdbc插件,需要安装output-jdbc插件
root@logstash:~# /usr/share/logstash/bin/logstash-plugin list|grep jdbc
logstash-integration-jdbc├── logstash-input-jdbc├── logstash-filter-jdbc_streaming└── logstash-filter-jdbc_static#在线安装output-jdbc插件,可能会等较长时间
root@logstash:~# /usr/share/logstash/bin/logstash-plugin install logstash-output-jdbc#离线安装
#如果无法在线安装,可以先从已经安装的主机导出插件,再导入
#导出插件
root@logstash:~# /usr/share/logstash/bin/logstash-plugin prepare-offline-pack logstash-output-jdbc
#离线导入插件
root@logstash:~# /usr/share/logstash/bin/logstash-plugin install file:///root/logstash-offline-plugins-8.8.2.zip
Using bundled JDK: /usr/share/logstash/jdk
Installing file: /root/logstash-offline-plugins-8.8.2.zip
Resolving dependencies.......................................................
Install successful
6.4.7 配置 Filebeat 配置文件
[root@kibana01 ~]# cat /etc/filebeat/filebeat.yml
# Filebeat Inputs
filebeat.inputs:
- type: logenabled: truepaths:- /var/log/nginx/access_json.logjson.keys_under_root: true       # 将JSON键值提升到根级别json.overwrite_keys: true        # 如果键值存在,允许覆盖tags: ["nginx-access"]        # 给日志打上标签,便于区分- type: logenabled: truepaths:- /var/log/nginx/error_json.logjson.keys_under_root: true       # 将JSON键值提升到根级别tags: ["nginx-error"]         # 给日志打上标签,便于区分- type: logenabled: truepaths:- /var/log/syslogtags: ["syslog"]#output.logstash:#  hosts: ["11.0.1.10:5044"]# Kafka Output Configuration
output.kafka:hosts: ["11.0.1.11:9092", "11.0.1.12:9092", "11.0.1.13:9092"]  # Kafka broker 列表topic: filebeat-log                                          # 指定 Kafka topicpartition.round_robin:reachable_only: true                                          # 仅发送到可用的分区required_acks: 1                                                # 等待主分区的确认compression: gzip                                               # 使用 gzip 压缩消息max_message_bytes: 1000000                                      # 每条消息最大1MB# redis为标准输出
#output.redis:
#  hosts: ["11.0.1.10:6379"]
#  key: "filebeat"
#  password: "123456"
#  db: "0"
#  timeout: 5#output.elasticsearch:#  hosts: ["11.0.1.101:9200", "11.0.1.102:9200", "11.0.1.103:9200"]##  indices:#    - index: "nginx-access-%{[agent.version]}-%{+yyyy.MM.dd}"#      when.contains:#        tags: "nginx-access"  # 匹配单个值,而非数组##    - index: "nginx-error-%{[agent.version]}-%{+yyyy.MM.dd}"#      when.contains:#        tags: "nginx-error"#setup.ilm.enabled: false  # 禁用 Elasticsearch 的索引生命周期管理(ILM)#setup.template.name: "nginx104"  # 模板名称,用于处理 NGINX 日志的字段映射#setup.template.pattern: "nginx104-*"  # 模板匹配模式,应用于所有以 "nginx-" 开头的索引##setup.template.settings:  # 定义 Elasticsearch 模板的配置选项#  index.number_of_shards: 3  # 设置每个索引的主分片数量为 3#  index.number_of_replicas: 1  # 设置每个分片的副本数量为 1
6.4.8 配置 Logstash 将日志写入数据库
root@logstash:/etc/logstash/conf.d# vim nginx_redis_to_jdbc_es.conf
root@logstash:/etc/logstash/conf.d# cat nginx_redis_to_jdbc_es.conf
input {redis {host => "11.0.1.10"port => "6379"password => "123456"db => "0"key => "filebeat"data_type => "list"}
}filter {if "nginx-access" in [tags] {geoip {source => "clientip"target => "geoip"add_field => ["[geoip][coordinates]","%{[geoip][geo][location][lon]}"]add_field => ["[geoip][coordinates]","%{[geoip][geo][location][lat]}"]}mutate {convert => [ "[geoip][coordinates]", "float"]       }}mutate {convert => ["upstreamtime","float"]}
}
output {if "syslog" in [tags] {elasticsearch {hosts => ["11.0.1.101:9200","11.0.1.102:9200","11.0.1.103:9200"]index => "syslog-%{+YYYY.MM.dd}"}}if "nginx-access" in [tags] {elasticsearch {hosts => ["11.0.1.101:9200","11.0.1.102:9200","11.0.1.103:9200"]index => "nginxaccess-%{+YYYY.MM.dd}"template_overwrite => true}stdout {codec => "rubydebug"}
#添加数据库api插件配置信息jdbc {connection_string => "jdbc:mysql://11.0.1.10/elk?user=elk&password=123456&useUnicode=true&characterEncoding=UTF8"statement => ["INSERT INTO elklog (clientip, responsetime, uri, status) VALUES(?, ?, ?, ?)", "clientip", "responsetime", "uri", "status"]}}if "nginx-error" in [tags] {elasticsearch {hosts => ["11.0.1.101:9200","11.0.1.102:9200","11.0.1.103:9200"]index => "nginxerrorlog-%{+YYYY.MM.dd}"template_overwrite => true}}
6.4.9 检查 Logstash 配置并重启服务
root@logstash:~# /usr/share/logstash/bin/logstash -f /etc/logstash/conf.d/nginx_redis_to_jdbc_es.conf -r
6.4.10 访问 Nginx 产生日志
#模拟访问日志
[root@kibana01 ~]# cat /var/log/nginx/access_json.log-20230221 >> /var/log/nginx/access_json.log
6.4.11 验证数据库是否写入数据
root@logstash:~# mysql -uelk -p -h11.0.1.10 -e 'select * from elk.elklog;'
Enter password:
+------------+--------------+--------------------------------------------------------------------------------+--------+---------------------+
| clientip   | responsetime | uri                                                                            | status | time                |
+------------+--------------+--------------------------------------------------------------------------------+--------+---------------------+
| 11.0.1.99  |        0.041 | /wp-admin/admin-ajax.php                                                       | 200    | 2024-11-23 16:24:27 |
| 11.0.1.99  |        0.041 | /wp-admin/admin-ajax.php                                                       | 200    | 2024-11-23 16:24:27 |
| 11.0.1.99  |        0.071 | /wp-admin/admin-ajax.php                                                       | 200    | 2024-11-23 16:24:27 |
| 11.0.1.99  |       15.106 | /wp-admin/update.php                                                           | 200    | 2024-11-23 16:24:27 |
| 11.0.1.99  |        0.000 | /wp-content/plugins/w3-total-cache/pub/css/feature-counter.css                 | 304    | 2024-11-23 16:24:27 |
| 11.0.1.99  |        0.000 | /wp-includes/js/dist/a11y.min.js                                               | 304    | 2024-11-23 16:24:27 |
| 11.0.1.99  |        0.000 | /wp-content/themes/blogus/css/customizer-controls.css                          | 304    | 2024-11-23 16:24:27 |
| 11.0.1.99  |        0.000 | /wp-admin/js/svg-painter.js                                                    | 304    | 2024-11-23 16:24:27 |
| 11.0.1.99  |        0.000 | /wp-includes/js/underscore.min.js                                              | 304    | 2024-11-23 16:24:27 |
| 11.0.1.99  |        0.000 | /wp-includes/js/media-views.min.js                                             | 304    | 2024-11-23 16:24:27 |
| 11.0.1.99  |        0.000 | /wp-content/themes/blogus/inc/ansar/customizer-admin/js/blogus-admin-script.js | 304    | 2024-11-23 16:24:27 |
| 11.0.1.99  |        0.000 | /wp-content/plugins/w3-total-cache/pub/fonts/w3tc.woff                         | 304    | 2024-11-23 16:24:27 |
| 11.0.1.99  |        0.000 | /wp-includes/css/admin-bar.min.css                                             | 304    | 2024-11-23 16:24:27 |
| 11.0.1.99  |        0.000 | /wp-content/themes/blogus/style.css                                            | 304    | 2024-11-23 16:24:27 |
| 11.0.1.99  |        0.000 | /wp-content/themes/blogus/css/colors/default.css                               | 304    | 2024-11-23 16:24:27 |
| 11.0.1.99  |        0.000 | /wp-content/themes/blogus/css/colors/dark.css                                  | 304    | 2024-11-23 16:24:27 |
| 11.0.1.99  |        0.000 | /wp-content/themes/blogus/css/jquery.smartmenus.bootstrap.css                  | 304    | 2024-11-23 16:24:27 |
| 11.0.1.99  |        0.000 | /wp-content/themes/blogus/inc/ansar/customize/css/customizer.css               | 304    | 2024-11-23 16:24:27 |
| 11.0.1.99  |        0.000 | /wp-content/themes/blogus/js/bootstrap.js                                      | 304    | 2024-11-23 16:24:27 |
| 11.0.1.99  |        0.000 | /wp-content/themes/blogus/js/main.js                                           | 304    | 2024-11-23 16:24:27 |
| 11.0.1.99  |        0.000 | /wp-content/themes/blogus/js/jquery.smartmenus.js                              | 304    | 2024-11-23 16:24:27 |
| 11.0.1.99  |        0.000 | /wp-content/themes/blogus/js/jquery.cookie.min.js                              | 304    | 2024-11-23 16:24:27 |
| 11.0.1.99  |        0.000 | /wp-content/themes/blogus/js/dark.js                                           | 304    | 2024-11-23 16:24:27 |
| 11.0.1.99  |        0.000 | /wp-content/themes/blogus/webfonts/fa-solid-900.woff2                          | 304    | 2024-11-23 16:24:27 |
| 11.0.1.99  |        0.080 | /index.php                                                                     | 200    | 2024-11-23 16:24:27 |
| 11.0.1.105 |        0.001 | /wp-cron.php                                                                   | 200    | 2024-11-23 16:24:27 |
| 11.0.1.99  |        0.000 | /wp-admin/images/about-release-badge.svg                                       | 304    | 2024-11-23 16:24:27 |
| 11.0.1.99  |        0.059 | /index.php                                                                     | 200    | 2024-11-23 16:24:27 |
| 11.0.1.99  |        0.096 | /wp-admin/nav-menus.php                                                        | 200    | 2024-11-23 16:24:27 |
| 11.0.1.99  |        0.000 | /wp-admin/js/nav-menu.min.js                                                   | 304    | 2024-11-23 16:24:27 |
| 11.0.1.99  |        0.000 | /wp-admin/js/accordion.min.js                                                  | 304    | 2024-11-23 16:24:27 |
| 11.0.1.105 |        0.000 | /wp-cron.php                                                                   | 200    | 2024-11-23 16:24:27 |
| 11.0.1.105 |        0.000 | /wp-cron.php                                                                   | 200    | 2024-11-23 16:24:27 |
| 11.0.1.105 |        0.001 | /wp-cron.php                                                                   | 200    | 2024-11-23 16:24:27 |
| 11.0.1.99  |        0.000 | /wp-admin/js/updates.min.js                                                    | 304    | 2024-11-23 16:24:27 |
| 11.0.1.99  |        1.925 | /wp-admin/admin.php                                                            | 200    | 2024-11-23 16:24:27 |
| 11.0.1.99  |        0.000 | /wp-content/plugins/w3-total-cache/Generic_Page_Dashboard_View.css             | 304    | 2024-11-23 16:24:27 |
| 11.0.1.99  |        0.000 | /wp-content/plugins/w3-total-cache/pub/css/bootstrap-buttons.css               | 304    | 2024-11-23 16:24:27 |
| 11.0.1.99  |        0.000 | /wp-content/plugins/w3-total-cache/Cdn_BunnyCdn_Widget_View.css                | 304    | 2024-11-23 16:24:27 |
| 11.0.1.99  |        0.000 | /wp-content/plugins/w3-total-cache/pub/js/metadata.js                          | 304    | 2024-11-23 16:24:27 |
| 11.0.1.99  |        0.000 | /wp-content/plugins/w3-total-cache/Generic_WidgetSpreadTheWord.js              | 304    | 2024-11-23 16:24:27 |
| 11.0.1.99  |        0.000 | /wp-content/plugins/w3-total-cache/pub/js/lightbox.js                          | 304    | 2024-11-23 16:24:27 |
| 11.0.1.99  |        0.000 | /wp-content/plugins/w3-total-cache/pub/img/imh.png                             | 304    | 2024-11-23 16:24:27 |
| 11.0.1.99  |        0.000 | /wp-content/plugins/w3-total-cache/pub/img/convesio.png                        | 304    | 2024-11-23 16:24:27 |
| 11.0.1.99  |        0.000 | /wp-content/plugins/w3-total-cache/PageSpeed_Widget_View.css                   | 304    | 2024-11-23 16:24:27 |
| 11.0.1.99  |        0.000 | /wp-content/plugins/w3-total-cache/Generic_WidgetStats.js                      | 304    | 2024-11-23 16:24:27 |......
7 常见面试题
-
ES 用了几台机器?
配置包括2台Logstash、3台Kafka、3台Elasticsearch (ES) 和1台Kibana。这意味着你的整个日志分析系统共部署在9台机器上。 -
ES 用的什么磁盘?
-
Logstash 和 Filebeat的区别?
-
ELK 有那些优化?
-
日志分析管理平台用了ES、 logstash、filebeat,你负责部署还是全都是你做的?
-
logstash 与 filebeat的工作流程,数据是怎么样进行传递的?
-
ES里面进行了怎样的索引?
-
监控什么样的日志?
-
日志分析平台的架构是怎样的?问的是方案! filebeat + logstash + elastic search + kibana ?
-
描述ELK架构?
-
logstash 用到哪些插件?
-
简述ELK的部署架构和工作原理?
ES用了几台机器?根据你提供的信息,ES使用了3台机器。一般来说,ELK架构中ES节点的数量取决于集群的大小与性能要求,3台机器应该是一个基础的配置。ES用的什么磁盘?ES通常使用SSD硬盘,因为SSD相比HDD能提供更快的读写速度,尤其对于日志类应用,查询和数据插入的性能要求较高,SSD能显著提高ES的性能。Logstash 和 Filebeat的区别?- Logstash 是一个强大的数据处理管道工具,主要负责收集、处理、过滤和转发日志数据。它支持多种输入源、过滤器和输出目标,可以对日志进行复杂的转换、聚合等操作。
- Filebeat 是一个轻量级的日志采集器,通常用于边缘节点,直接从文件系统读取日志并发送到Logstash或者Elasticsearch。它不具备像Logstash那样复杂的处理和过滤能力,主要用来高效、实时地收集日志。简言之,Logstash 是一个“数据处理器”,而 Filebeat 是一个“数据采集器”。ELK有哪些优化?ELK的优化可以从多个方面考虑:
1. 硬件优化:使用SSD存储,增加ES节点的数量和资源。
2. 索引优化:合理设置索引分片数量、压缩存储、使用合适的分词器。
3. 查询优化:调整查询语句,避免全表扫描,合理使用缓存。
4. 数据收集优化:使用Filebeat代替Logstash采集日志,可以减少资源消耗,提升性能。
5. 内存管理:合理配置JVM内存(如ES的heap内存)以防止OOM。
6. 负载均衡:增加ES集群节点,优化集群负载均衡。
7. 监控与报警:使用Kibana和其他监控工具对集群进行实时监控,发现瓶颈及时优化。日志分析管理平台用了ES、Logstash、Filebeat,你负责部署还是全都是你做的?根据你的描述,可能需要具体确认一下你在这个项目中的职责范围。如果你负责部署,也许会涉及到集群搭建、配置、性能调优等;如果是全盘负责,除了部署,你可能还需要进行维护和故障排查。Logstash与Filebeat的工作流程,数据是怎么样进行传递的?- Filebeat 会首先在本地节点监控日志文件,当有新的日志写入时,它会将日志数据分批次发送到 Logstash。
- Logstash 收到数据后,可能会对数据进行一系列处理,比如过滤、解析、格式化、转换等操作,然后将处理后的数据发送到 Elasticsearch 进行存储。
- Elasticsearch 存储日志数据并为其建立索引,之后你可以通过 Kibana 进行查询和可视化展示。ES里面进行了怎样的索引?在ES中,数据通常会被组织成索引,每个索引都包含多个文档。文档内部的数据通过字段(field)存储。ES的索引设计可以通过如下方式优化:
1. 分片(Shards):数据会被分割成多个分片(Shard),分片的数量和分布影响到查询性能和数据存储能力。
2. 副本(Replicas):为了保证数据的可靠性,ES允许每个分片有一个或多个副本。
3. Mapping:通过Mapping定义字段的类型、分词规则、是否需要索引等。
4. Template:可以使用模板在创建索引时自动应用预定义的Mapping。监控什么样的日志?监控的日志种类可能有:
1. 应用日志:记录应用程序的运行状态、错误、警告等信息。
2. 系统日志:操作系统层级的日志,例如内核日志、系统服务日志等。
3. 网络日志:监控网络流量、连接、延迟等信息。
4. 安全日志:记录登录、权限变更、审计信息等。
5. 性能日志:如CPU、内存使用率、磁盘IO等硬件资源监控。日志分析平台的架构是怎样的?问的是方案!Filebeat + Logstash + Elasticsearch + Kibana?一种常见的日志分析平台架构方案:
1. Filebeat:部署在每个日志来源的服务器上,收集日志数据并发送到Logstash或者Elasticsearch。
2. Logstash:作为数据处理管道,负责接收Filebeat或其他来源的数据,进行过滤、解析、转换等处理后,发送到Elasticsearch。
3. Elasticsearch:存储和索引日志数据,提供快速查询与分析能力。
4. Kibana:作为前端可视化工具,提供数据可视化、仪表板和日志查询界面。描述ELK架构?ELK架构(Elasticsearch, Logstash, Kibana)通常包含如下组件:
- Logstash:收集并处理日志数据,可以进行过滤、转换等操作。
- Elasticsearch:提供存储、索引和搜索功能,是日志数据的核心存储引擎。
- Kibana:用于可视化日志数据,提供交互式查询、仪表盘和图表展示。整体架构是: 数据流向 Filebeat → Logstash → Elasticsearch,最后通过 Kibana 可视化呈现。Logstash用到哪些插件?Logstash的插件分为输入插件(Input)、过滤插件(Filter)、输出插件(Output)等:
- Input:如 `beats`, `file`, `http`, `syslog` 等。
- Filter:如 `grok`, `mutate`, `date`, `json` 等,用于处理和转换数据。
- Output:如 `elasticsearch`, `file`, `stdout`, `kafka` 等。简述ELK的部署架构和工作原理?ELK的部署架构可以按以下步骤来理解:
1. 数据收集:Filebeat从各个节点收集日志数据,并发送到Logstash。
2. 数据处理:Logstash接收数据,进行过滤和处理后发送到Elasticsearch。
3. 数据存储和索引:Elasticsearch存储数据并进行索引,以便后续高效查询。
4. 数据可视化:Kibana通过图形界面展示Elasticsearch中的数据,支持实时查询和生成可视化报表。这四个组件协同工作,形成了一个完整的日志管理、存储、搜索和分析平台。
知识扩充
1 Tomcat 的版本与 Java 版本的对应关系
Tomcat 的版本与 Java 版本的对应关系通常是由 Tomcat 支持的 Java 规范版本和 Java 虚拟机(JVM)的兼容性决定的。
常见的 Tomcat 版本与 Java 版本的对应关系:
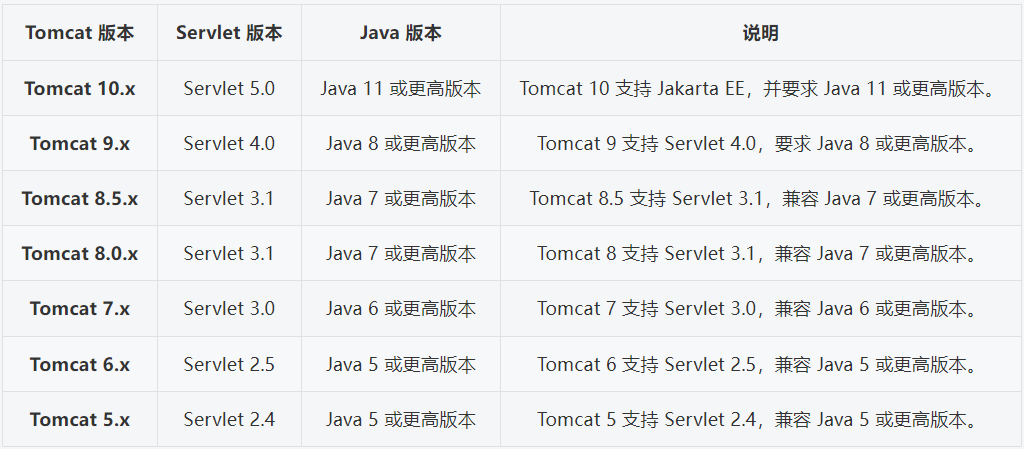
2 脚本艺术字显示
#安装工具
root@Ubuntu2004:~# apt install -y figlet
root@Ubuntu2004:~# figlet -h
figlet: invalid option -- 'h'
Usage: figlet [ -cklnoprstvxDELNRSWX ] [ -d fontdirectory ][ -f fontfile ] [ -m smushmode ] [ -w outputwidth ][ -C controlfile ] [ -I infocode ] [ message ]
root@Ubuntu2004:~# dpkg -L figlet
/.
/etc
/etc/emacs
/etc/emacs/site-start.d
/etc/emacs/site-start.d/50figlet.el
/usr
/usr/bin
/usr/bin/chkfont
/usr/bin/figlet-figlet
/usr/bin/figlist
/usr/bin/showfigfonts......#查看样式集
root@Ubuntu2004:~# showfigfonts
banner :#####    ##   #    # #    # ###### #####
#    #  #  #  ##   # ##   # #      #    #
#####  #    # # #  # # #  # #####  #    #
#    # ###### #  # # #  # # #      #####
#    # #    # #   ## #   ## #      #   #
#####  #    # #    # #    # ###### #    # big :_     _
| |   (_)
| |__  _  __ _
| '_ \| |/ _` |
| |_) | | (_| |
|_.__/|_|\__, |__/ ||___/ block :_|        _|                      _|
_|_|_|    _|    _|_|      _|_|_|  _|  _|
_|    _|  _|  _|    _|  _|        _|_|
_|    _|  _|  _|    _|  _|        _|  _|
_|_|_|    _|    _|_|      _|_|_|  _|    _|  bubble :_   _   _   _   _   _  / \ / \ / \ / \ / \ / \
( b | u | b | b | l | e )\_/ \_/ \_/ \_/ \_/ \_/ digital :
+-+-+-+-+-+-+-+
|d|i|g|i|t|a|l|
+-+-+-+-+-+-+-+ivrit :_   _            _ | |_(_)_ ____   _(_)| __| | '__\ \ / / || |_| | |   \ V /| |\__|_|_|    \_/ |_|lean :_/                               _/    _/_/      _/_/_/  _/_/_/    _/  _/_/_/_/  _/    _/  _/    _/   _/  _/        _/    _/  _/    _/
_/    _/_/_/    _/_/_/  _/    _/     mini :._ _ o._ o
| | ||| || mnemonic :
mnemonicscript :o          ,   __   ,_        _ _|_
/ \_/    /  |  |  |/ \_|  \/ \___/   |_/|_/|__/ |_//|       \|       shadow :|               |                __| __ \   _` |  _` |  _ \\ \  \   /
\__ \ | | | (   | (   | (   |\ \  \ /
____/_| |_|\__,_|\__,_|\___/  \_/\_/   slant :__            __ _____/ /___ _____  / /_/ ___/ / __ `/ __ \/ __/(__  ) / /_/ / / / / /_
/____/_/\__,_/_/ /_/\__/  small :_ _ ____ __  __ _| | |
(_-< '  \/ _` | | |
/__/_|_|_\__,_|_|_|smscript :,           ,   _   ,_  o    _|_
/ \_/|/|/|  / \_/   /  | | |/\_|  \/  | | |_/ \/ \__/   |/|/|_/ |_/(|      smshadow :|              |
(_-<  ` \ (_-<   \   _` |  _` |  _ \\ \  \ /
___/_|_|_|___/_| _|\__,_|\__,_|\___/ \_/\_/  smslant :__          __ ___ __ _  ___ / /__ ____  / /_(_-</  ' \(_-</ / _ `/ _ \/ __/
/___/_/_/_/___/_/\_,_/_//_/\__/ standard :_                  _               _ ___| |_ __ _ _ __   __| | __ _ _ __ __| |
/ __| __/ _` | '_ \ / _` |/ _` | '__/ _` |
\__ \ || (_| | | | | (_| | (_| | | | (_| |
|___/\__\__,_|_| |_|\__,_|\__,_|_|  \__,_|term :
term#测试
root@Ubuntu2004:~# figlet -f lean dinginx_/  _/                      _/                      _/_/_/      _/_/_/      _/_/_/      _/_/_/    _/    _/   _/    _/  _/  _/    _/  _/    _/  _/  _/    _/    _/_/
_/    _/  _/  _/    _/  _/    _/  _/  _/    _/  _/    _/     _/_/_/  _/  _/    _/    _/_/_/  _/  _/    _/  _/    _/      _/                               _/_/