ECharts 3D立体柱状图组件开发全解析:Bar3D_2.vue 深度剖析
本文将深入分析一个功能强大的 Vue 3 + ECharts 3D柱状图组件,展示如何构建支持多系列数据、高度可定制的3D数据可视化解决方案。
实现效果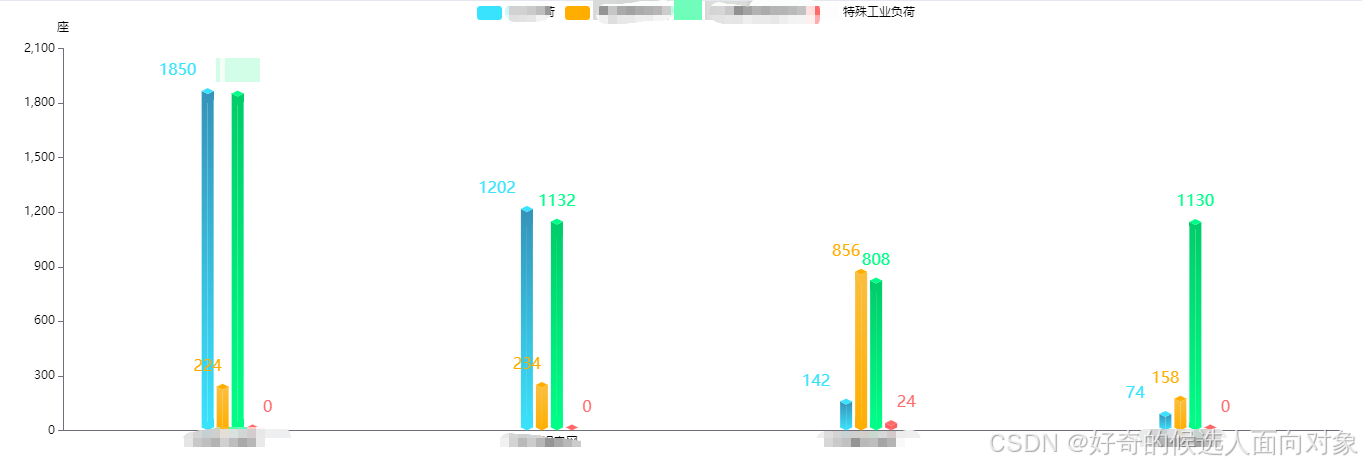
组件特色功能
Bar3D_2.vue 是一个专业的3D立体柱状图组件,相比基础版本具有以下增强特性:
-
多系列数据支持:可同时展示多个数据系列
-
真正的3D立体效果:通过自定义图形实现立方体渲染
-
灵活的配置系统:支持颜色组、单位、尺寸等全面定制
-
响应式布局:智能适应不同屏幕尺寸
-
交互式图例:支持系列显示/隐藏控制
核心架构解析
1. 组件参数设计
const props = defineProps({// 图表高度height: {type: String,default: '200px'},// 图表配置数据chartData: {type: Object,default: () => ({xData: [],        // X轴数据legendArr: [],    // 图例数组datas: []         // 数据数组(支持多系列)})},// 颜色配置 - 支持多组颜色colorArr: {type: Array,default: () => [['#3ae3fd', '#3593b9', '#47d3fa'],  // 蓝色系['#ffae00', '#fabf3f', '#d59200']   // 橙色系]}
});
2. 3D立方体形状定义
组件通过自定义图形实现真正的3D效果:
// 定义3D立方体形状参数
const offsetX = 6;  // X轴偏移量
const offsetY = 3;  // Y轴偏移量
const barWidth = 15; // 柱状图宽度// 左侧面定义
const CubeLeft = echarts.graphic.extendShape({shape: { x: 0, y: 0 },buildPath: function (ctx, shape) {const xAxisPoint = shape.xAxisPoint;const c0 = [shape.x, shape.y];const c1 = [shape.x - offsetX, shape.y - offsetY];const c2 = [xAxisPoint[0] - offsetX, xAxisPoint[1] - offsetY];const c3 = [xAxisPoint[0], xAxisPoint[1]];ctx.moveTo(c0[0], c0[1]).lineTo(c1[0], c1[1]).lineTo(c2[0], c2[1]).lineTo(c3[0], c3[1]).closePath();}
});
3. 多系列数据处理
组件支持动态生成多个数据系列:
// 构建系列数据
let series = [];
props.chartData.datas.forEach((item, index) => {// 计算颜色索引,确保循环使用所有颜色组const colorIndex = index % props.colorArr.length;const currentColors = props.colorArr[colorIndex];// 为每个数据系列创建两个子系列:// 1. 3D立方体自定义系列// 2. 透明柱状图(用于标签显示)
});
4. 智能布局算法
// 多系列柱状图位置计算
x: (index - props.chartData.datas.length / 2) * barWidth + 15// 这个公式确保:
// - 单系列:居中显示
// - 双系列:对称分布
// - 多系列:均匀排列
技术实现细节
1. 3D效果分层渲染
组件通过三个自定义形状组合成立方体:
children: [{type: 'CubeLeft',   // 左侧面style: {fill: new echarts.graphic.LinearGradient(0, 0, 0, 1, [{ offset: 0, color: currentColors[1] },{ offset: 1, color: currentColors[0] }])}},{type: 'CubeRight',  // 右侧面// ... 渐变配置},{type: 'CubeTop',    // 顶面// ... 渐变配置}
]
2. 自定义提示框格式化
formatter: function (params) {let str = props.chartData.xData[params[0].dataIndex] + '</br>';params.forEach((item) => {if (item.seriesType === 'custom') {const color = props.colorArr[props.chartData.legendArr.indexOf(item.seriesName) % props.colorArr.length][0];str += `<div style='display:flex;justify-content:space-between;align-items:center'><div style='margin-right:20px;'><span style="display:inline-block;width:10px;height:10px;border-radius:5px;background-color:${color}"></span> ${item.seriesName}</div>