ELK3——kibana
ELK3——kibana
一、kibana介绍
Kibana是一个开源的可视化平台,可以为ElasticSearch集群的管理提供友好的Web界面,帮助汇总,分析和搜索重要的日志数据。
二、kibana部署
1、在kibana服务器(这里是es1)上安装kibana
[root@es1 ~]# rz -E
rz waiting to receive.
[root@es1 ~]# ls
anaconda-ks.cfg  Downloads                kibana-6.5.2-x86_64.rpm  Public
Desktop          elasticsearch-6.5.2.rpm  Music                    Templates
Documents        initial-setup-ks.cfg     Pictures                 Videos
[root@es1 ~]# rpm -ivh kibana-6.5.2-x86_64.rpm
warning: kibana-6.5.2-x86_64.rpm: Header V4 RSA/SHA512 Signature, key ID d88e42b4: NOKEY
Preparing...                          ################################# [100%]
Updating / installing...1:kibana-6.5.2-1                   ################################# [100%]
2、修改配置文件
[root@es1 ~]# cd /etc/kibana/
[root@es1 kibana]# ls
kibana.yml
[root@es1 kibana]# vim kibana.yml
[root@es1 kibana]# cat /etc/kibana/kibana.yml | grep -v '#' | grep -v '^$'
server.port: 5601                                                //端口
server.host: "0.0.0.0"                                           //监听所有,允许所有人能访问
elasticsearch.url: "http://192.168.100.20:9200"                  //ES集群的路径
logging.dest: /var/log/kibana.log                        //这里加了kibana日志,方便排错与调试//日志要自己建立,并修改owner和group属性
[root@es1 kibana]# cd
[root@es1 ~]# touch /var/log/kibana.log
[root@es1 ~]# chown kibana.kibana /var/log/kibana.log
3、启动kibana服务
[root@es1 ~]# systemctl restart kibana.service
[root@es1 ~]# systemctl enable kibana.service
Created symlink from /etc/systemd/system/multi-user.target.wants/kibana.service to /etc/systemd/system/kibana.service.
[root@es1 ~]# lsof -i:5601
COMMAND   PID   USER   FD   TYPE DEVICE SIZE/OFF NODE NAME
node    10125 kibana   11u  IPv4  60599      0t0  TCP *:esmagent (LISTEN)
4、浏览器访问 http://kibana服务器IP:5601
5、汉化
[root@es1 ~]# rz -E
rz waiting to receive.
[root@es1 ~]# ls
anaconda-ks.cfg  elasticsearch-6.5.2.rpm       Music      Videos
Desktop          initial-setup-ks.cfg          Pictures
Documents        kibana-6.5.2-x86_64.rpm       Public
Downloads        Kibana_Hanization-master.zip  Templates
[root@es1 ~]# unzip Kibana_Hanization-master.zip -d /usr/local
Archive:  Kibana_Hanization-master.zip
88b5f8cef28a720f27a5cb327c906554fbdff7edcreating: /usr/local/Kibana_Hanization-master/inflating: /usr/local/Kibana_Hanization-master/README.md  creating: /usr/local/Kibana_Hanization-master/config/............
[root@es1 ~]# cd /usr/local
[root@es1 local]# ls
bin  games    Kibana_Hanization-master  lib64    sbin   src
etc  include  lib                       libexec  share
[root@es1 local]# cd Kibana_Hanization-master/
[root@es1 Kibana_Hanization-master]# ls
config  image  main.py  README.md  requirements.txt
[root@es1 Kibana_Hanization-master]# python main.py /usr/share/kibana/
文件[/usr/share/kibana/node_modules/x-pack/plugins/monitoring/ui_exports.js]已翻译。
文件[/usr/share/kibana/node_modules/x-pack/plugins/monitoring/public/register_feature.js]已翻译。
......
......
恭喜,Kibana汉化完成!
//再次启动服务
[root@es1 Kibana_Hanization-master]# systemctl restart kibana.service
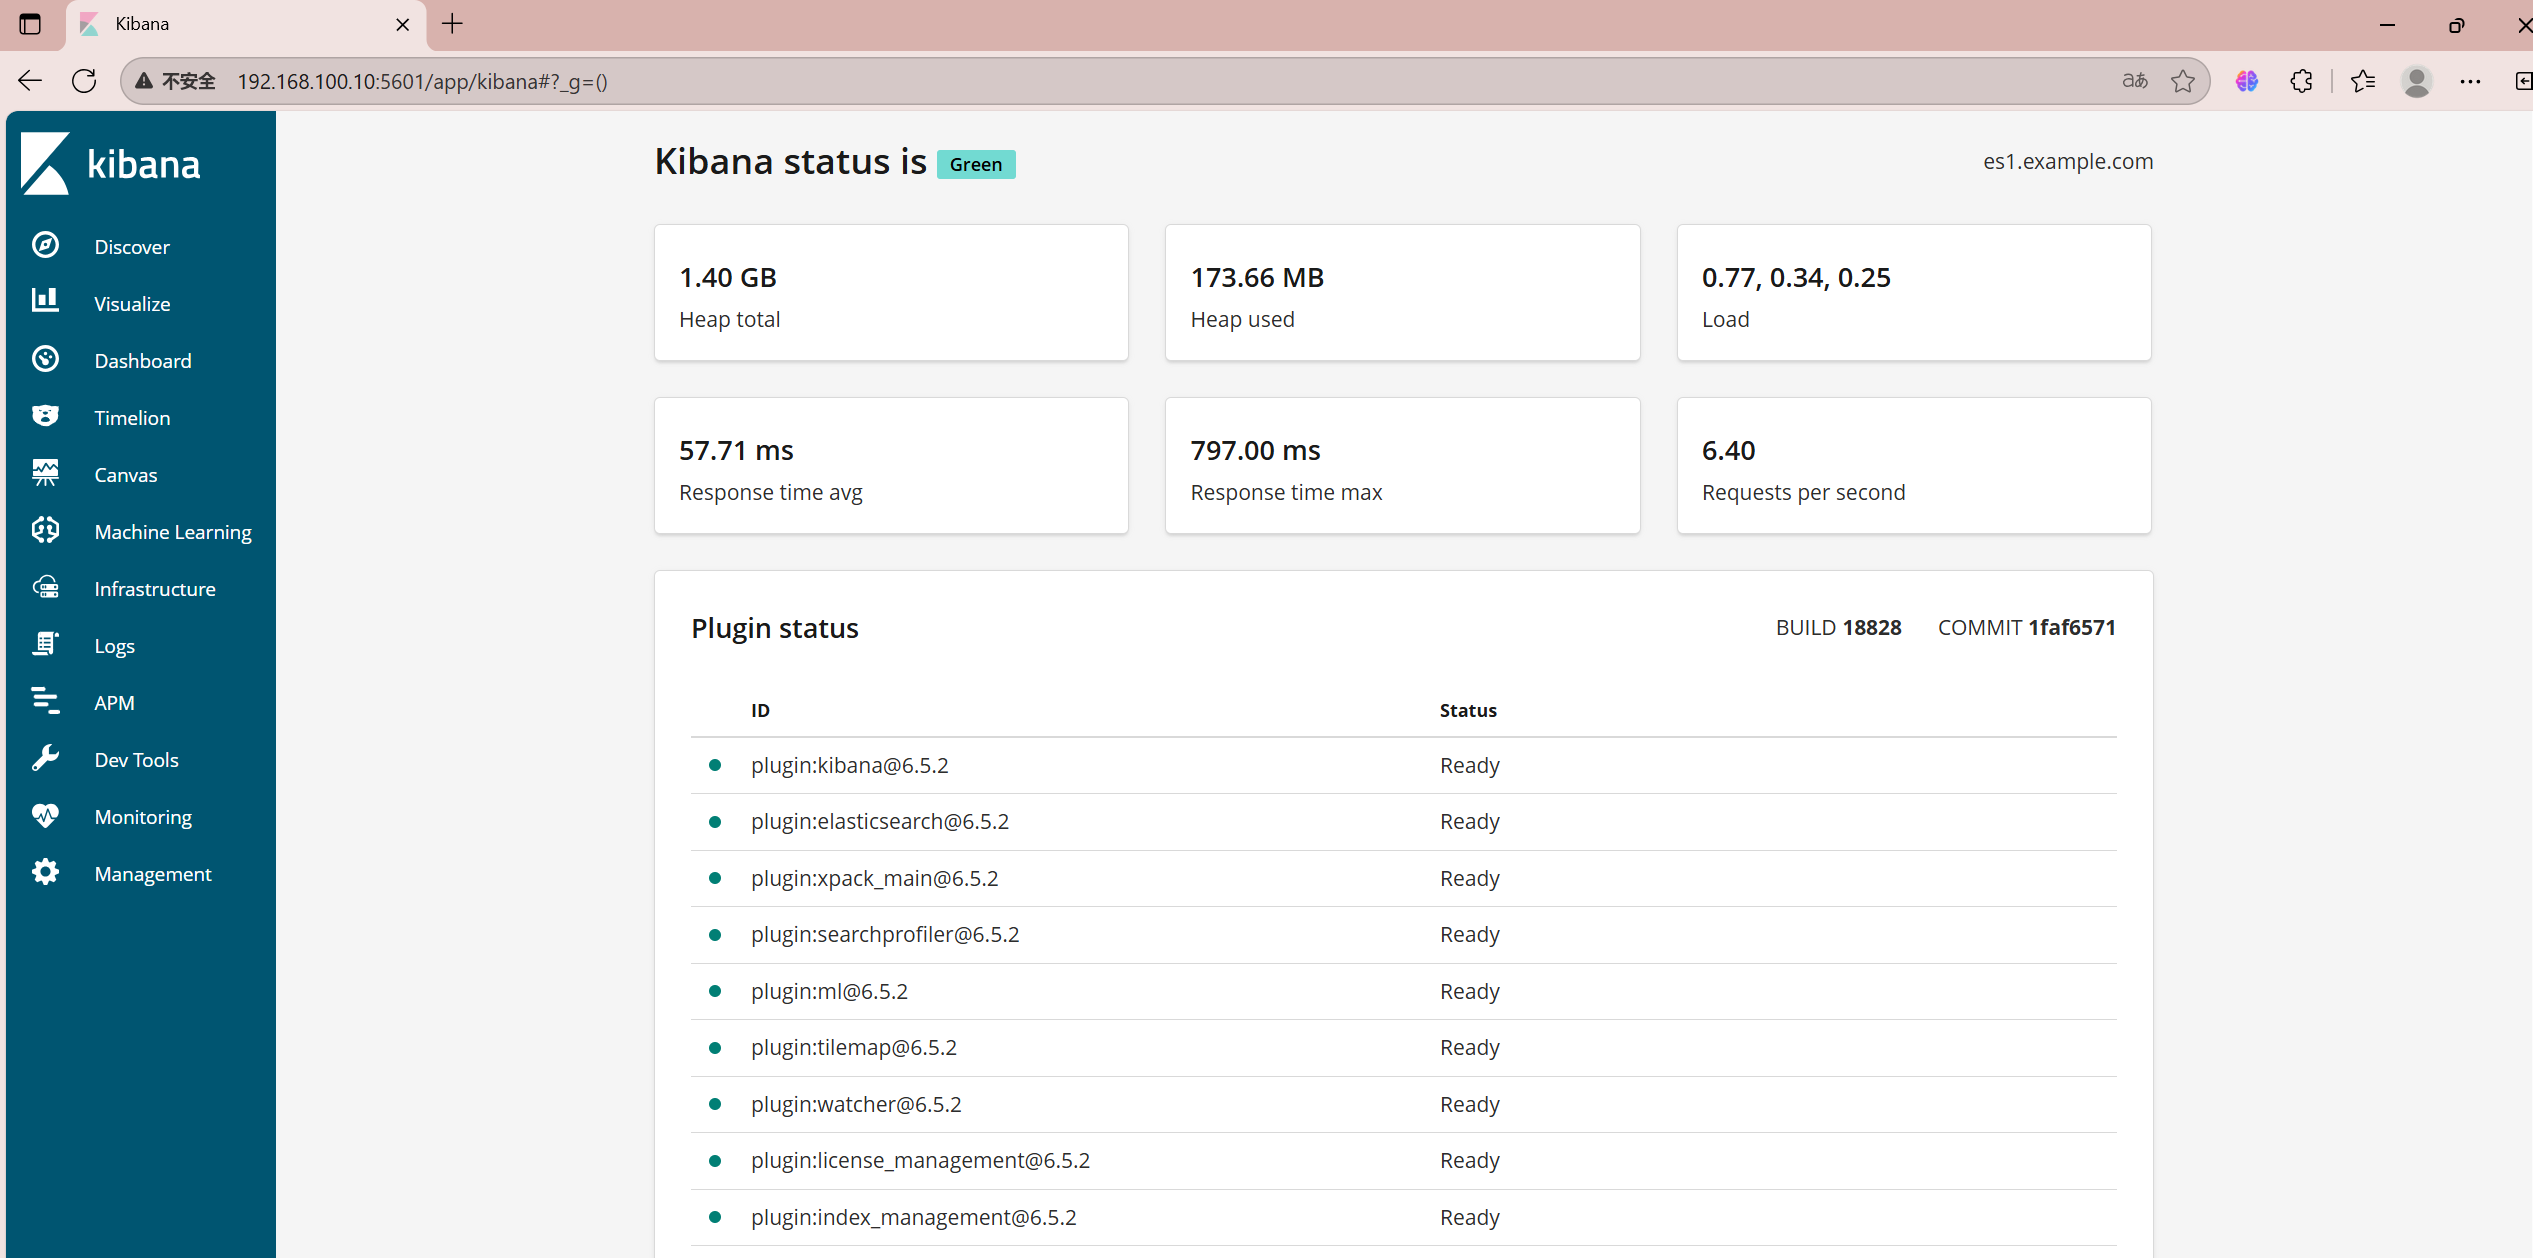
再次通过浏览器访问 http://kibana服务器IP:5601
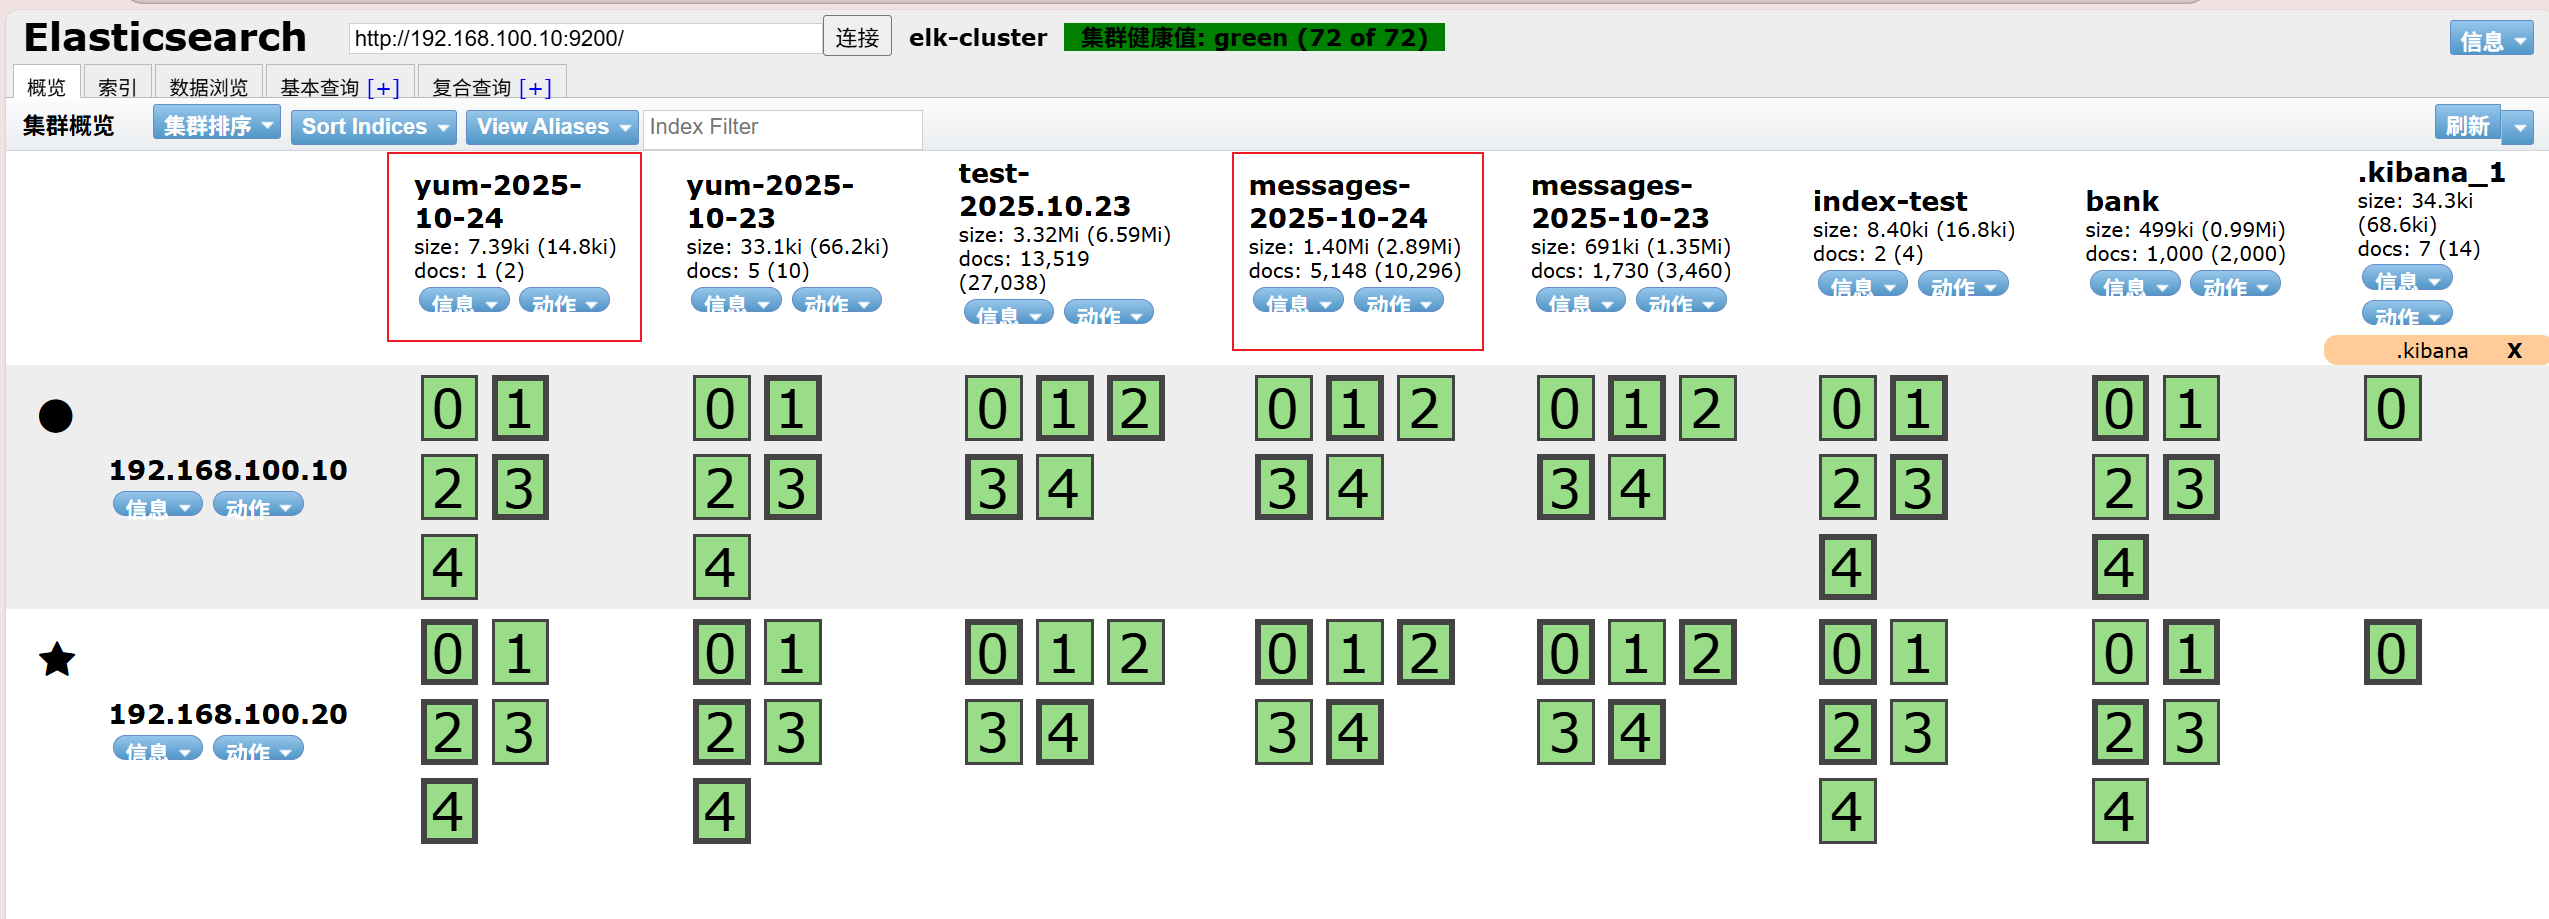
通过kibana查看集群信息
点击系统监控,可以查看集群状态
通过kibana查看logstash收集的日志索引
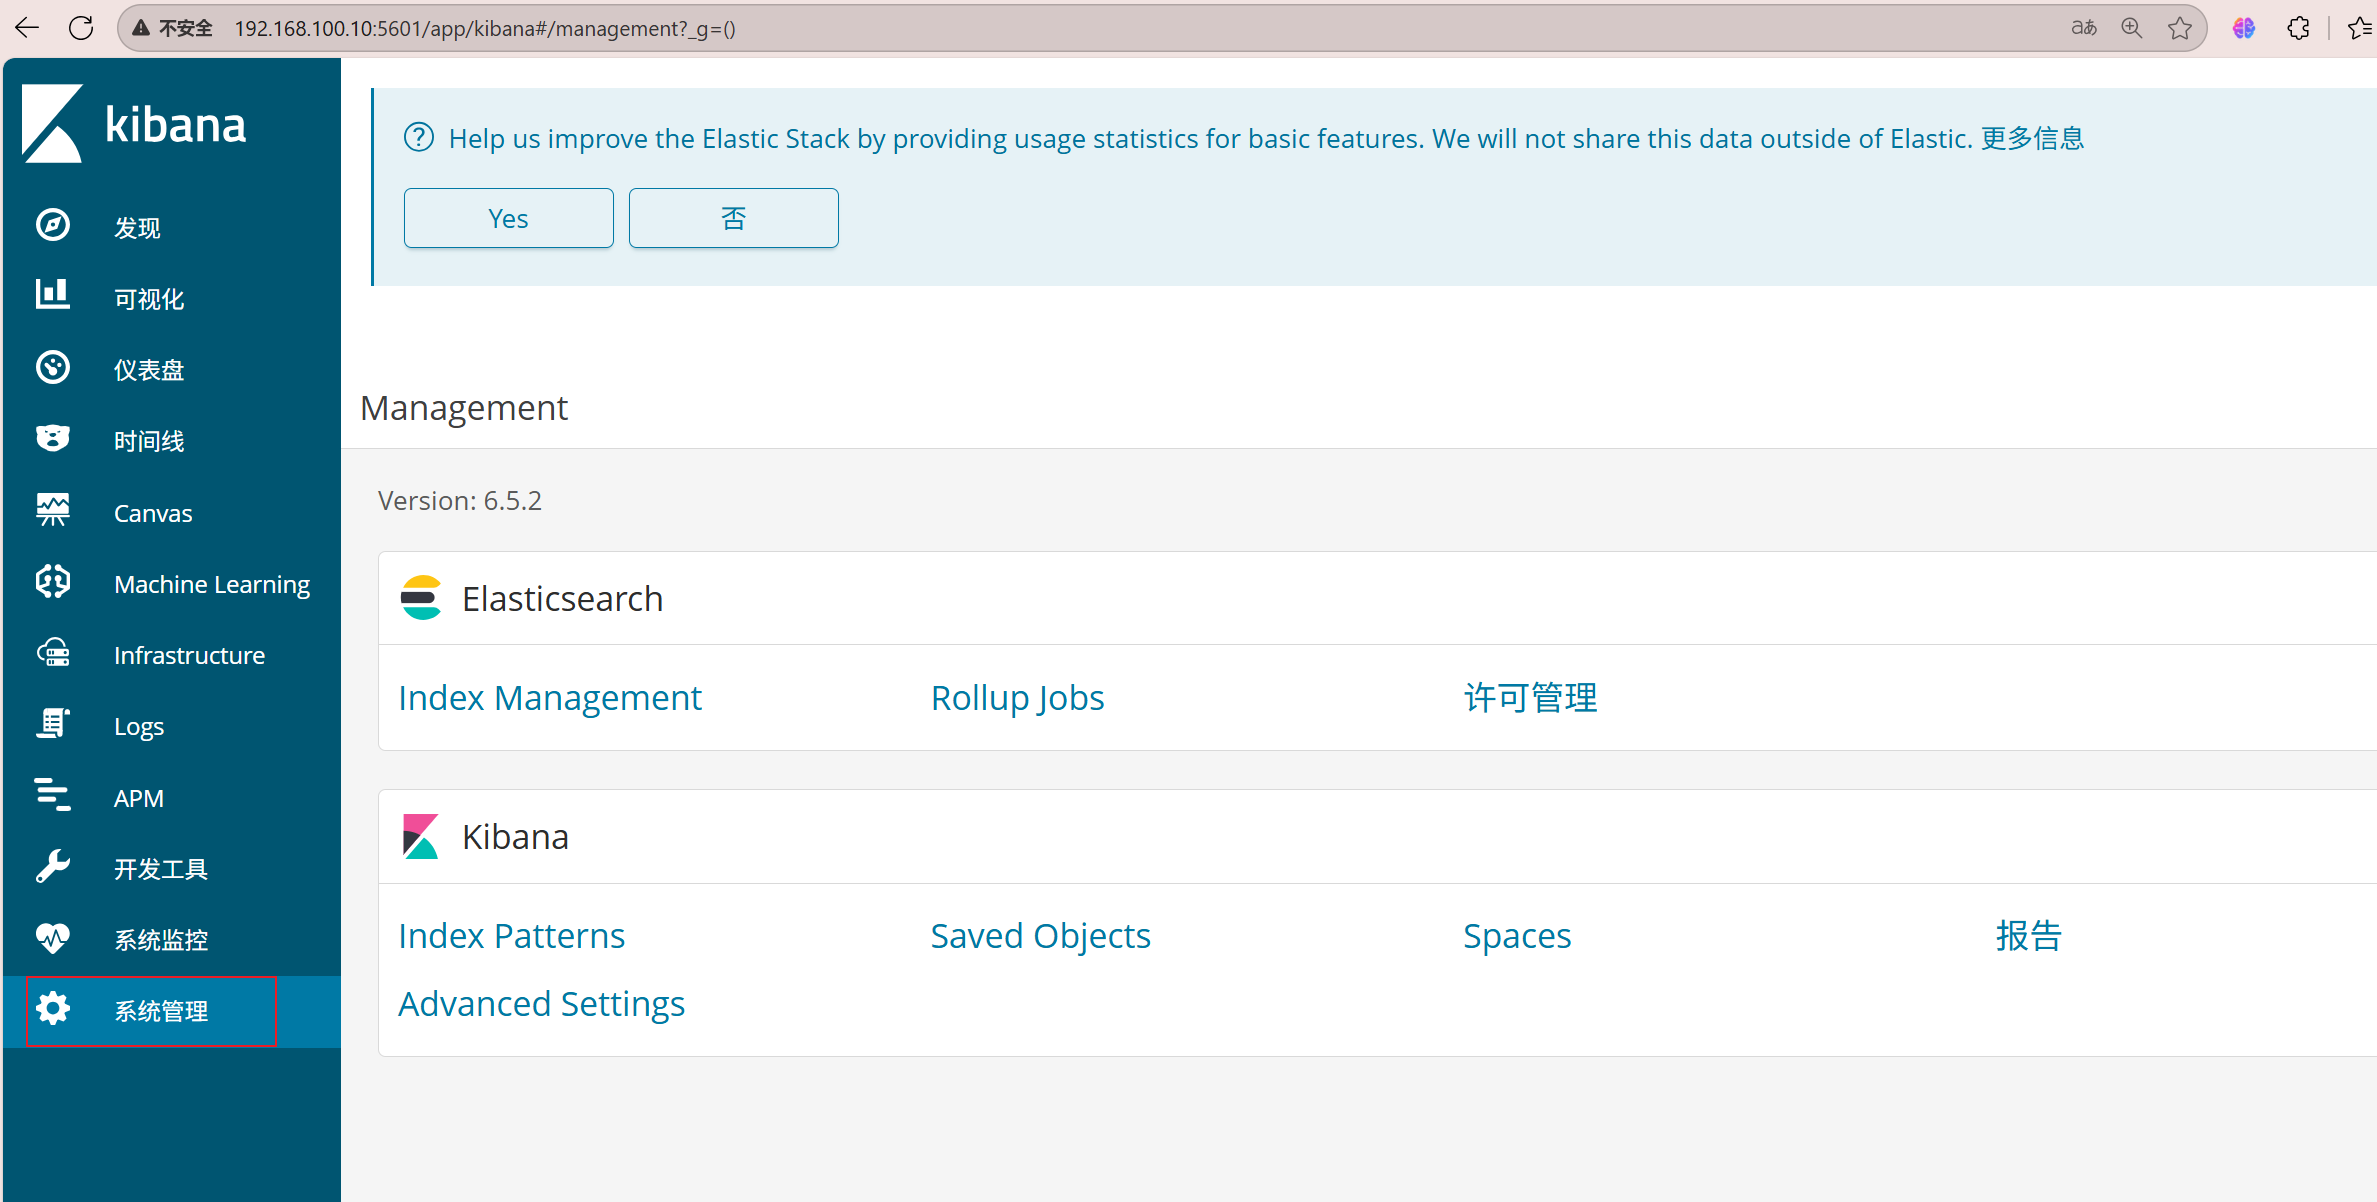
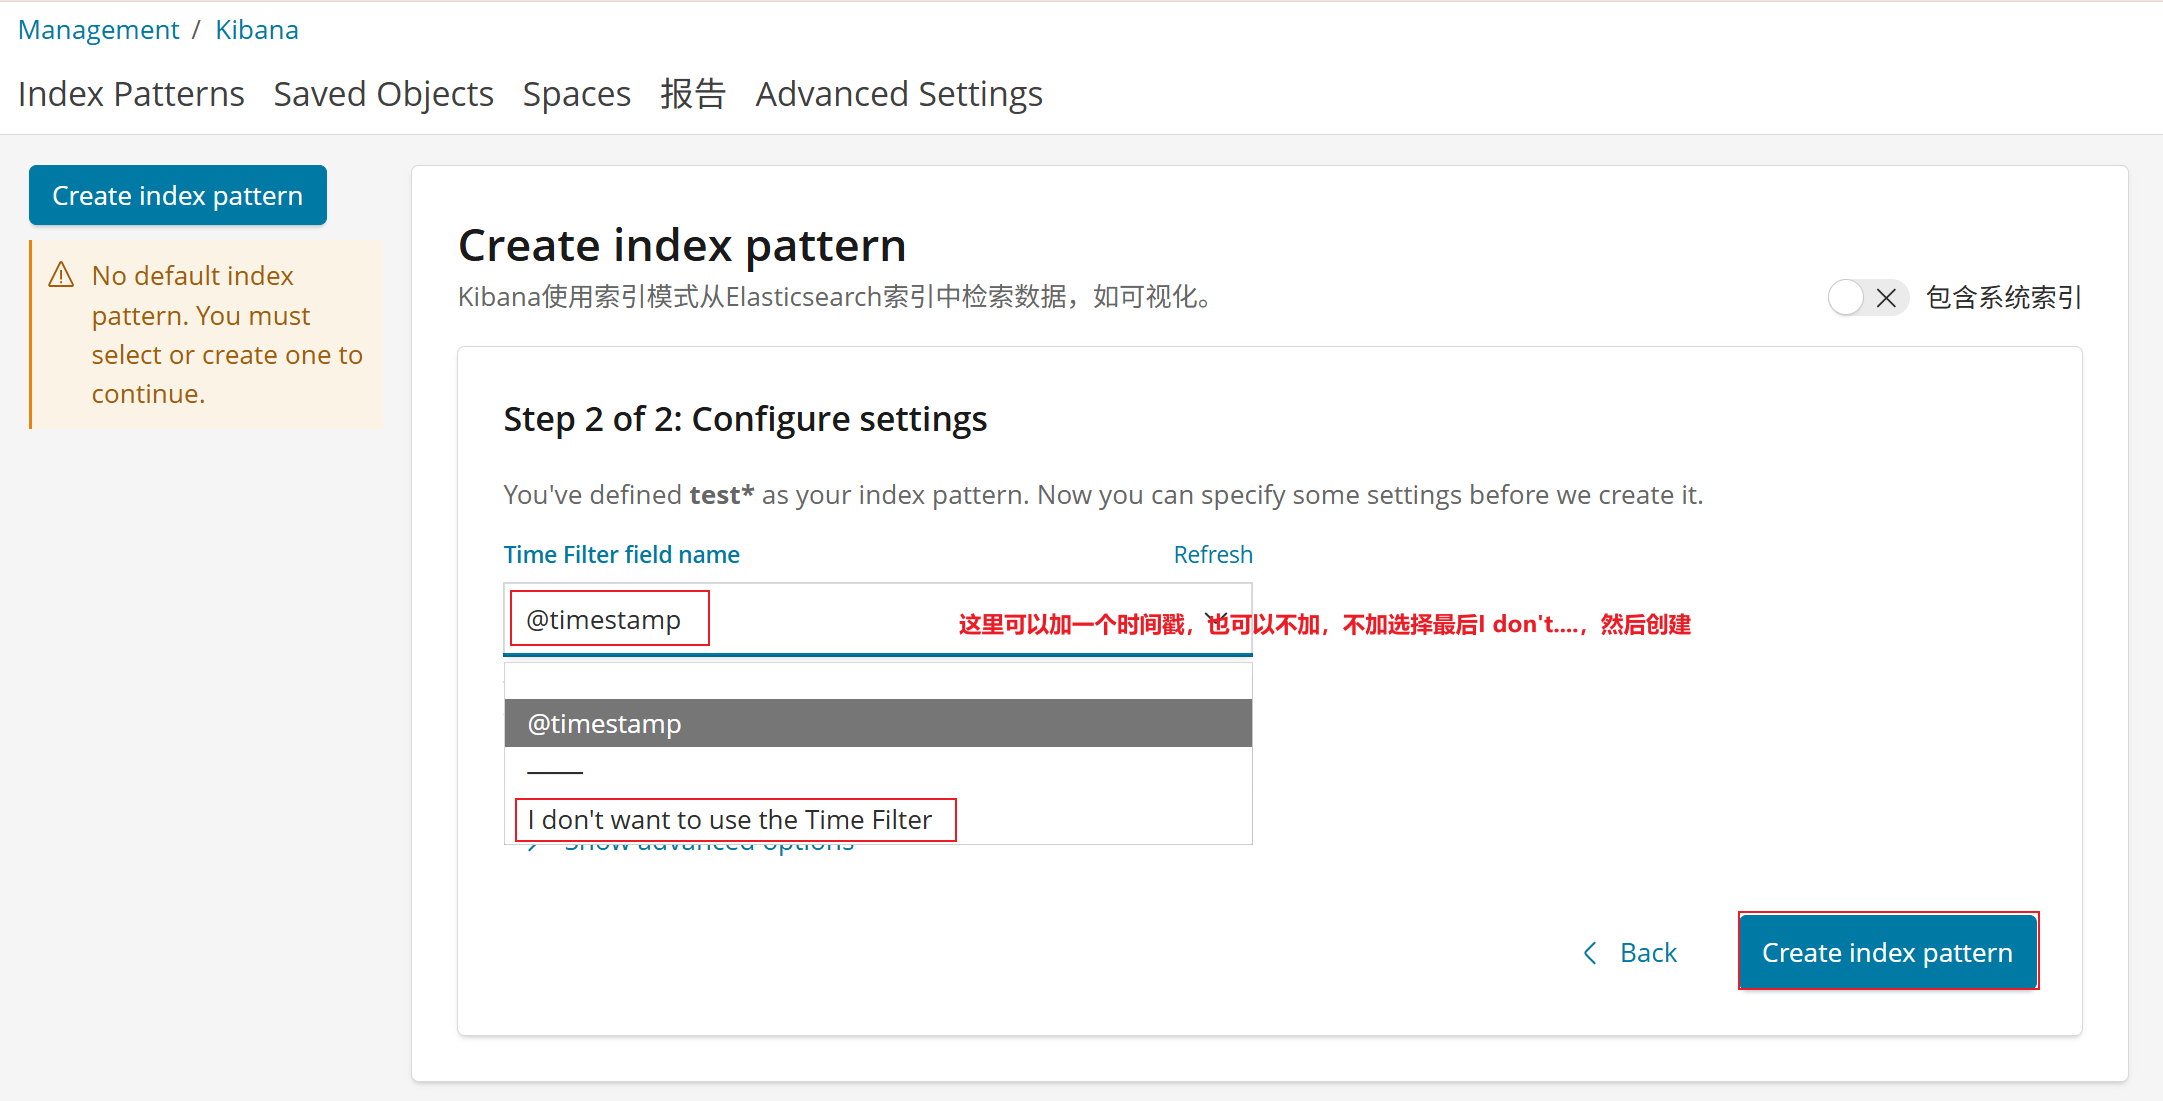
系统管理——index Patterns
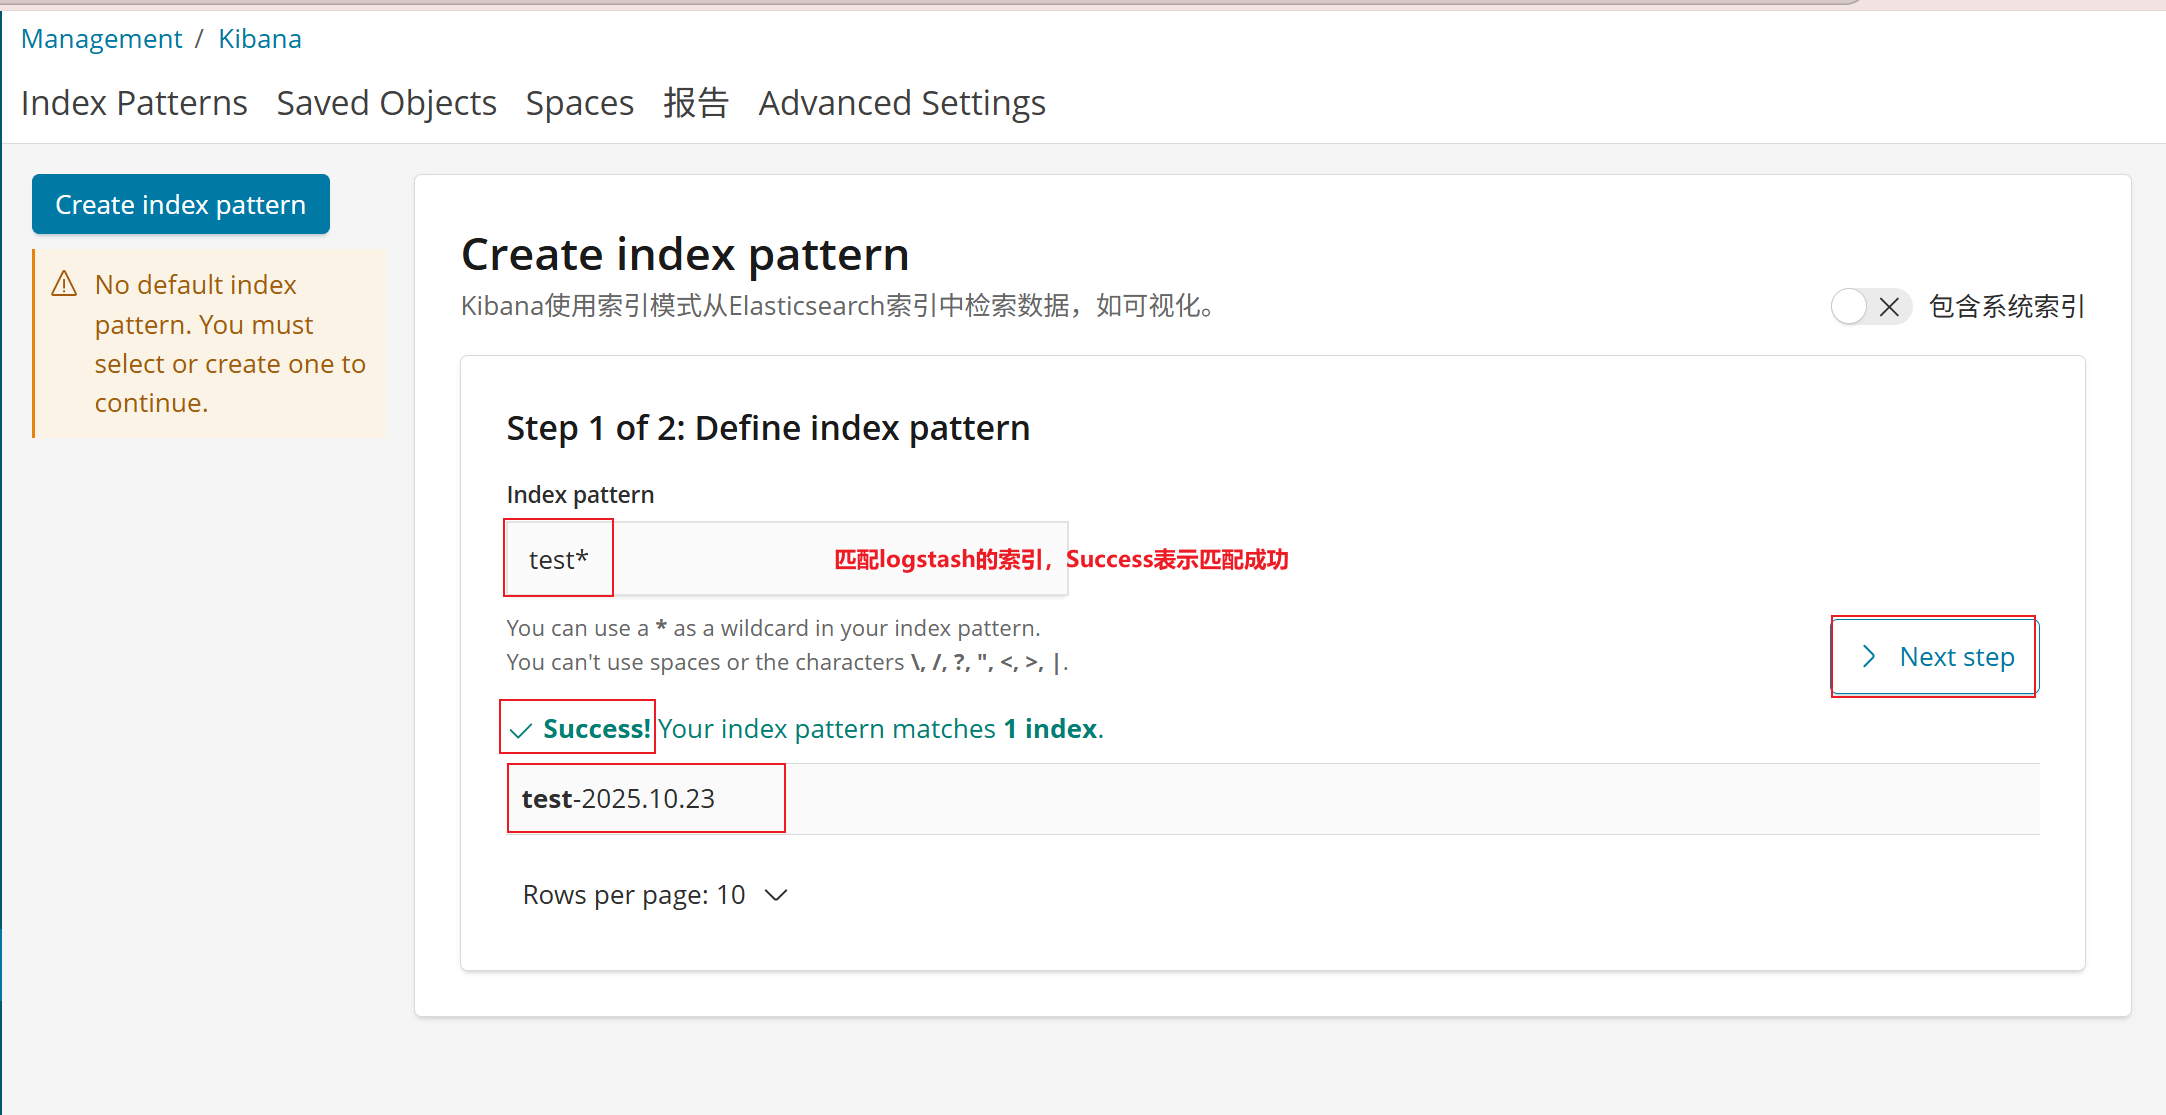
为了方便查看数据,没有加时间戳
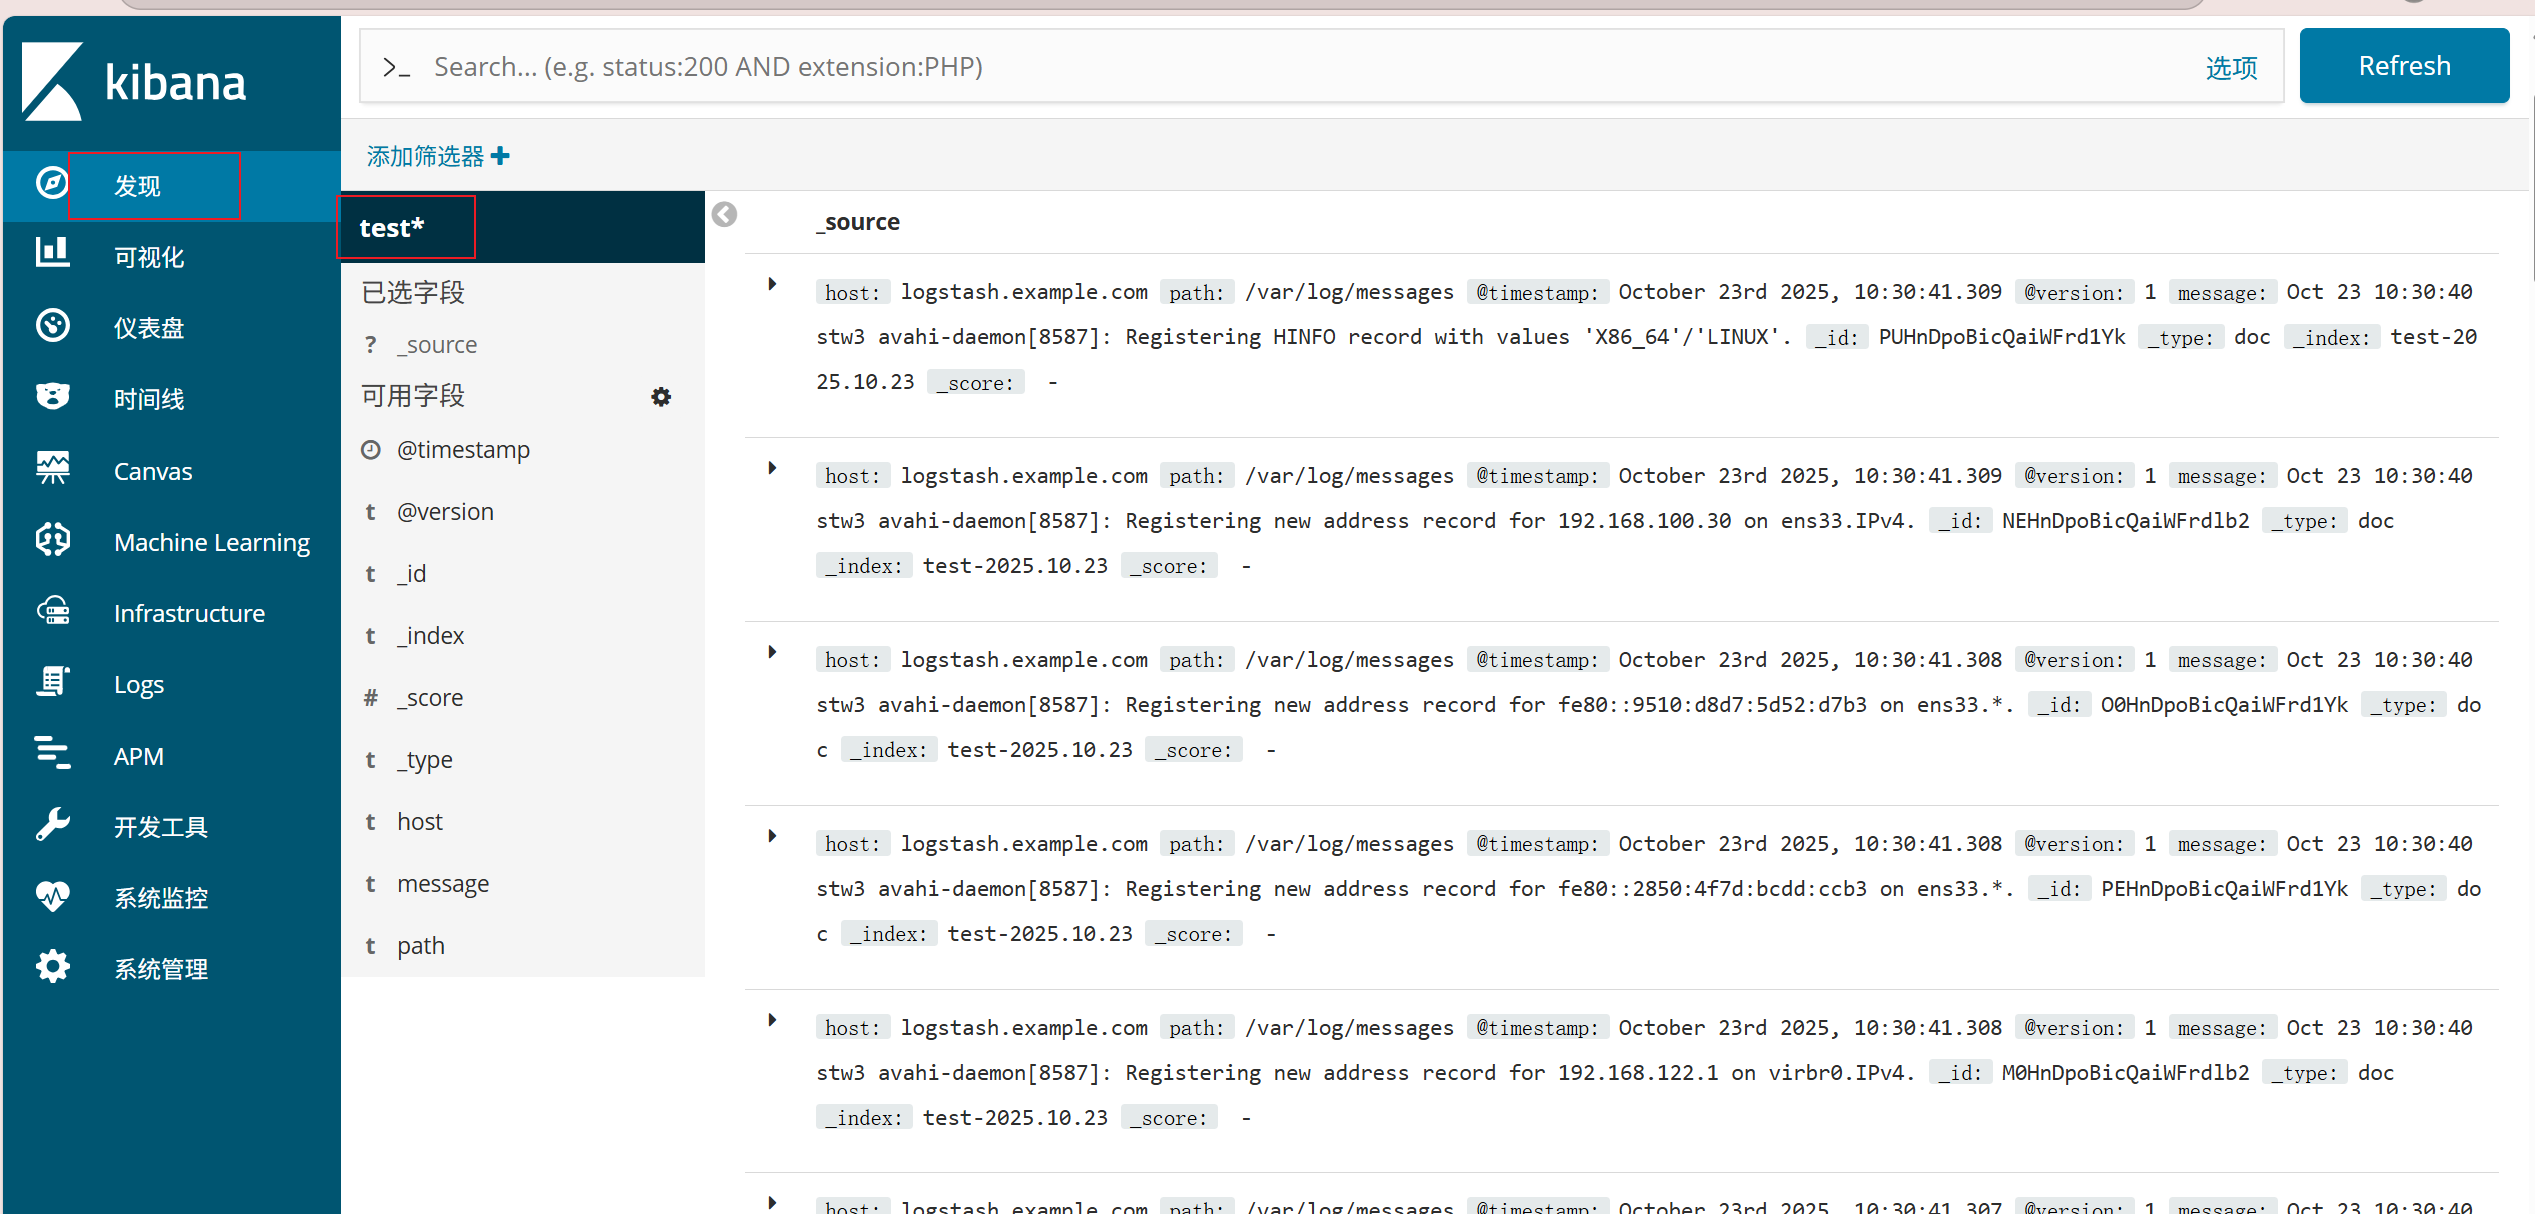
最后点发现查看
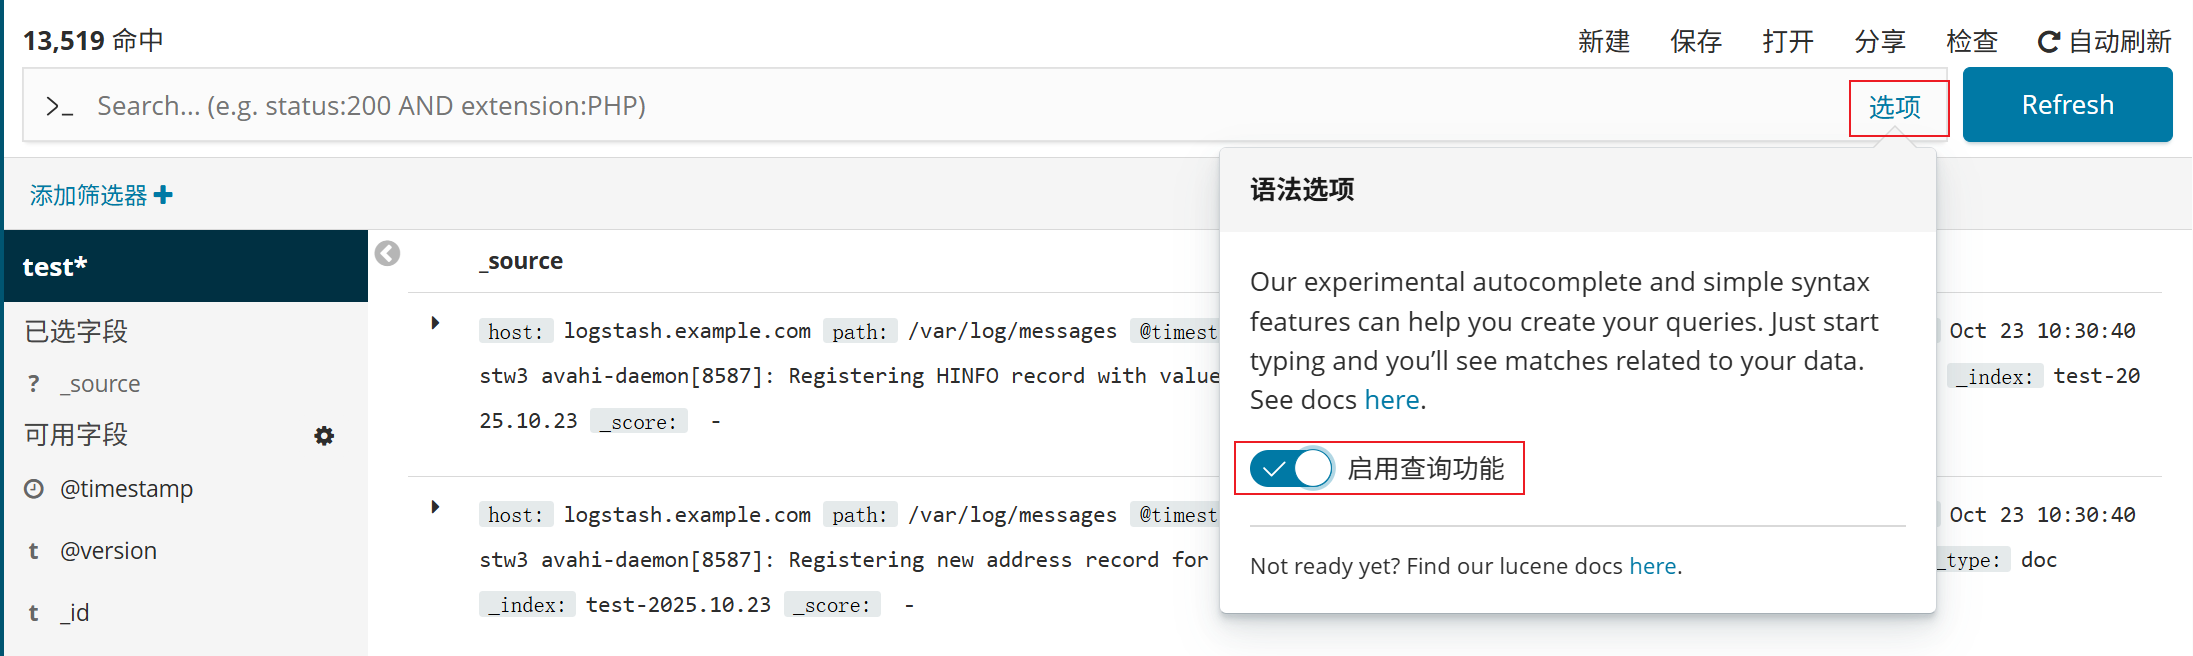
也可以搜索关键字查看需要的信息
先启用查询功能
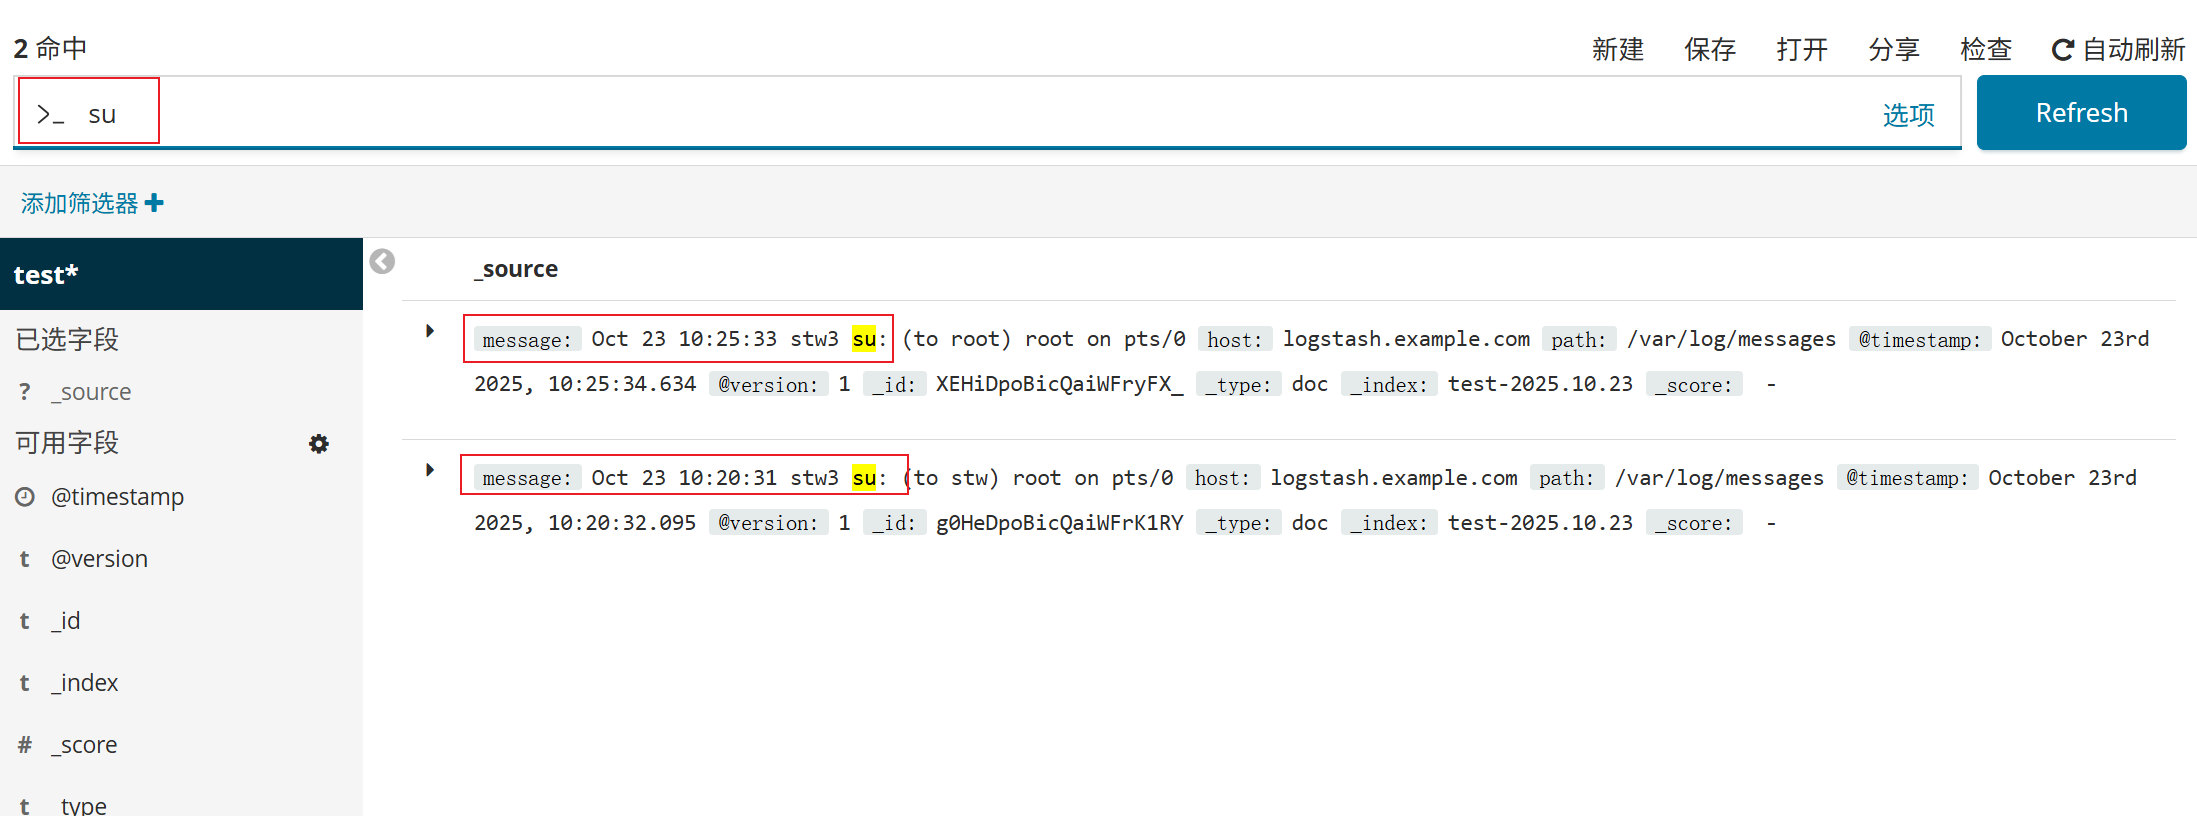
查看su命令的相关日志
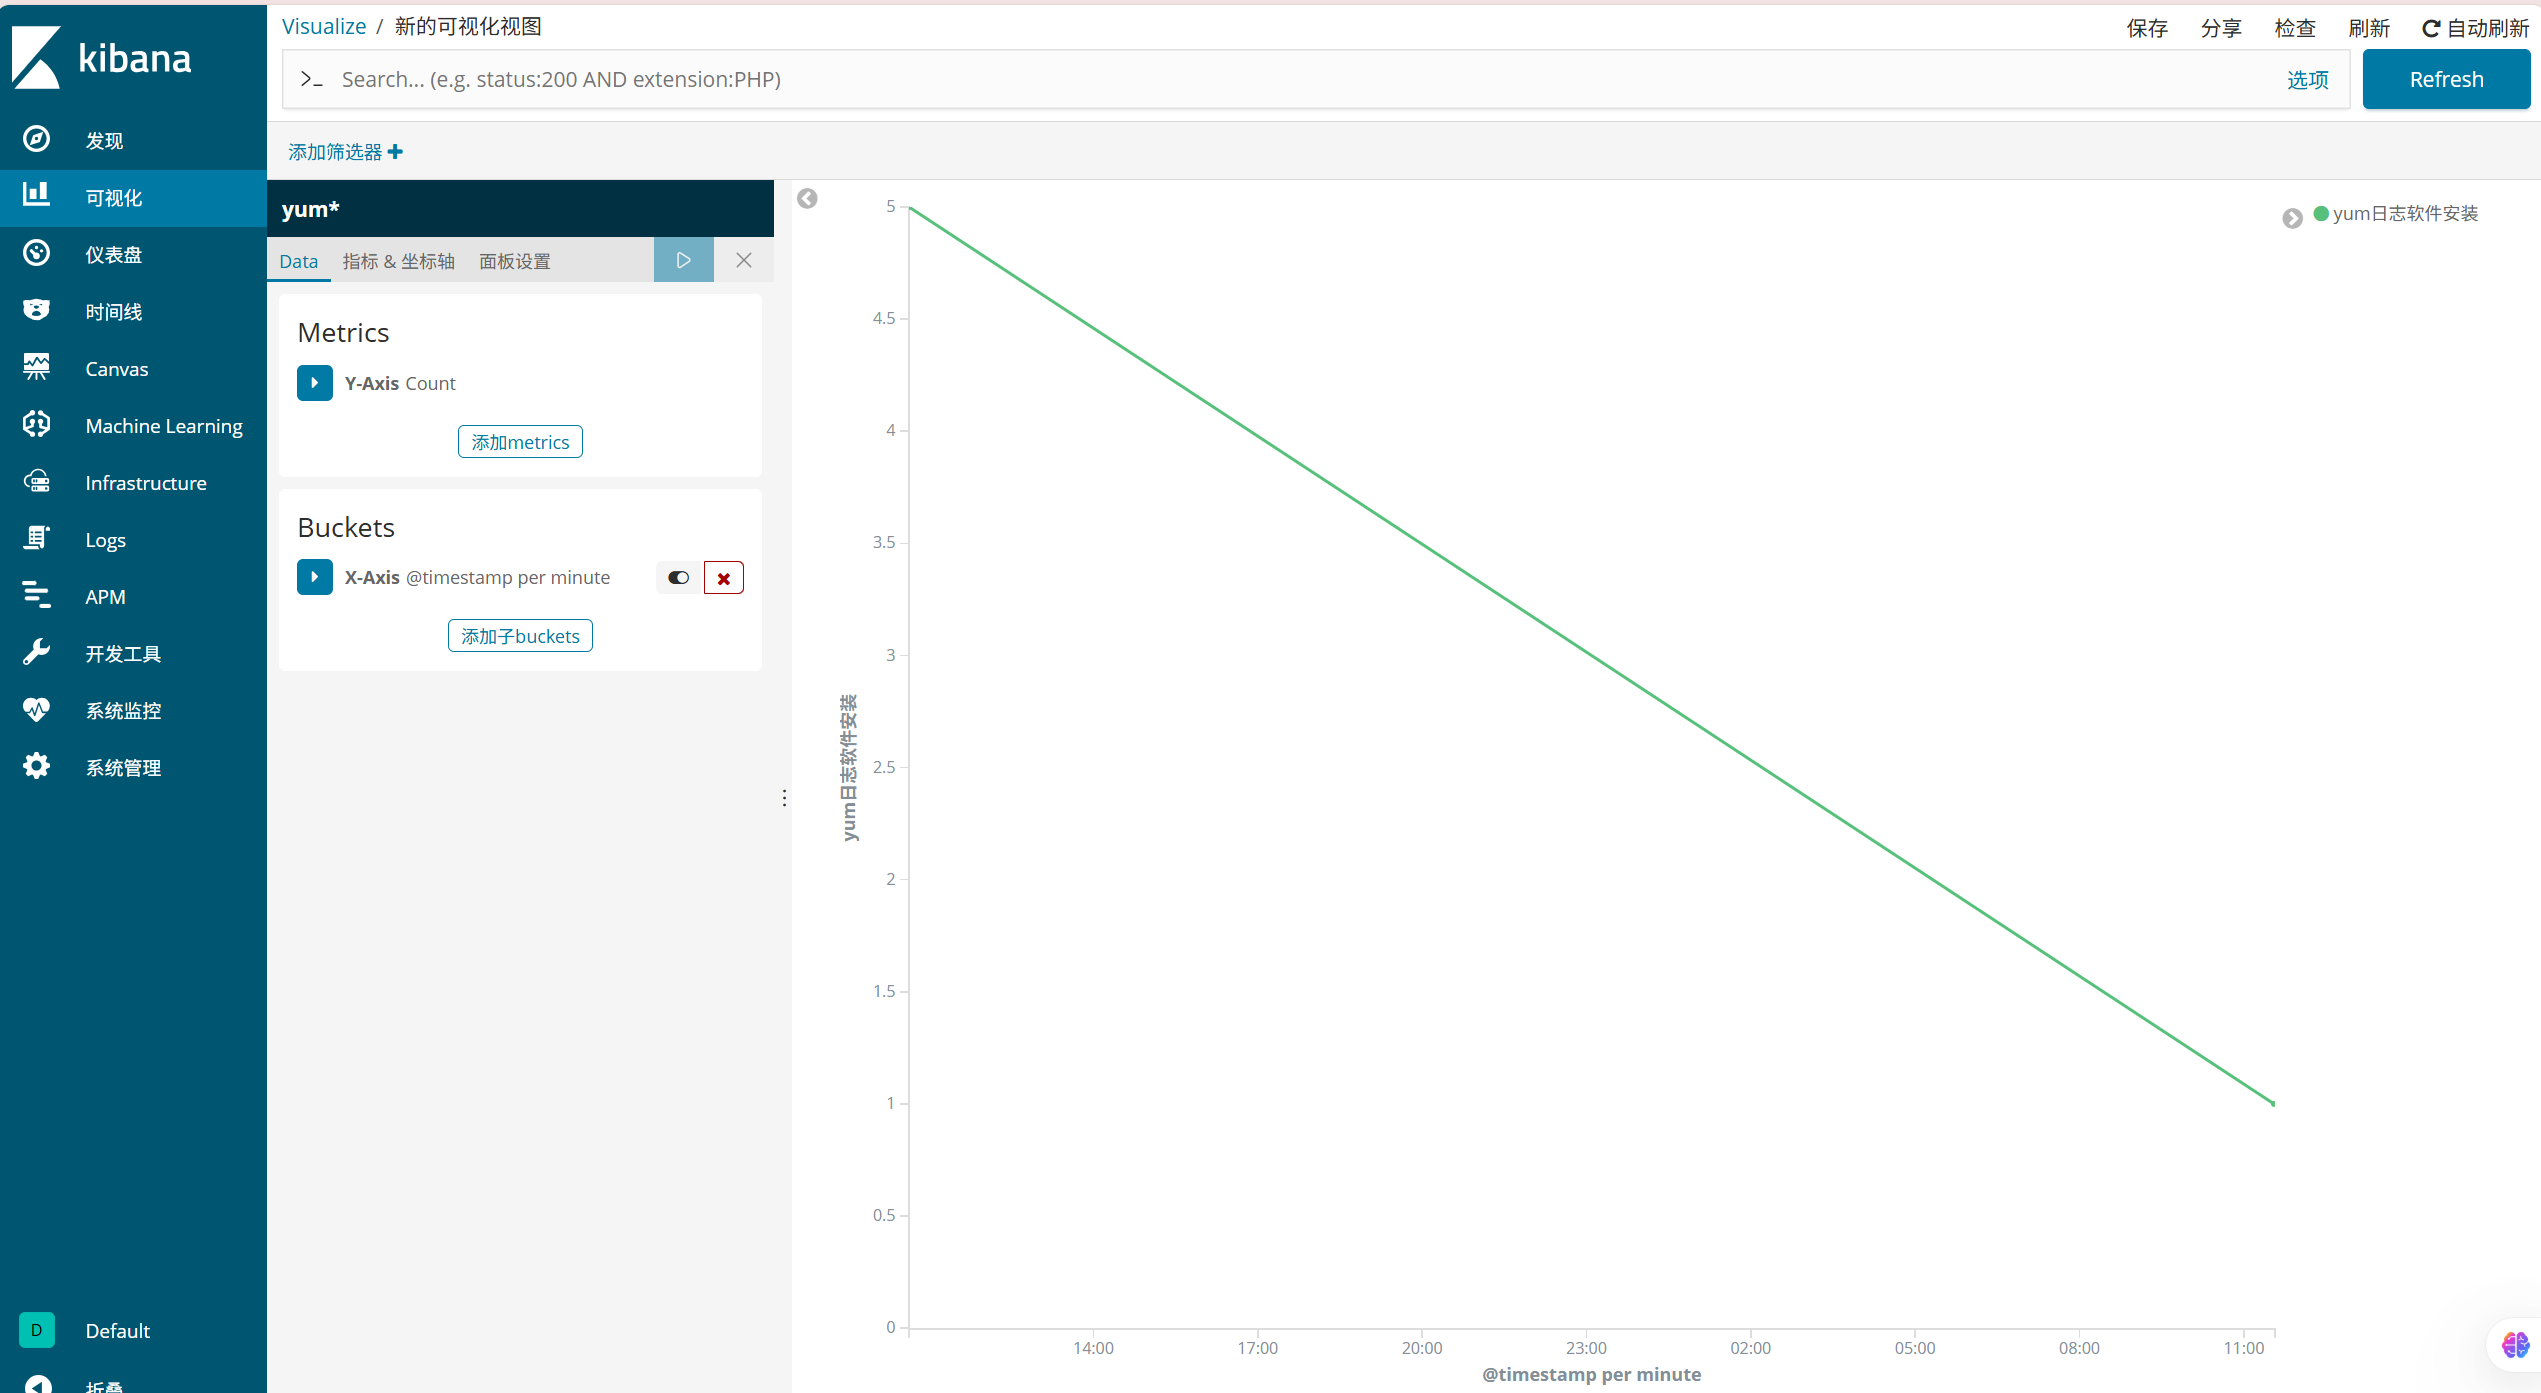
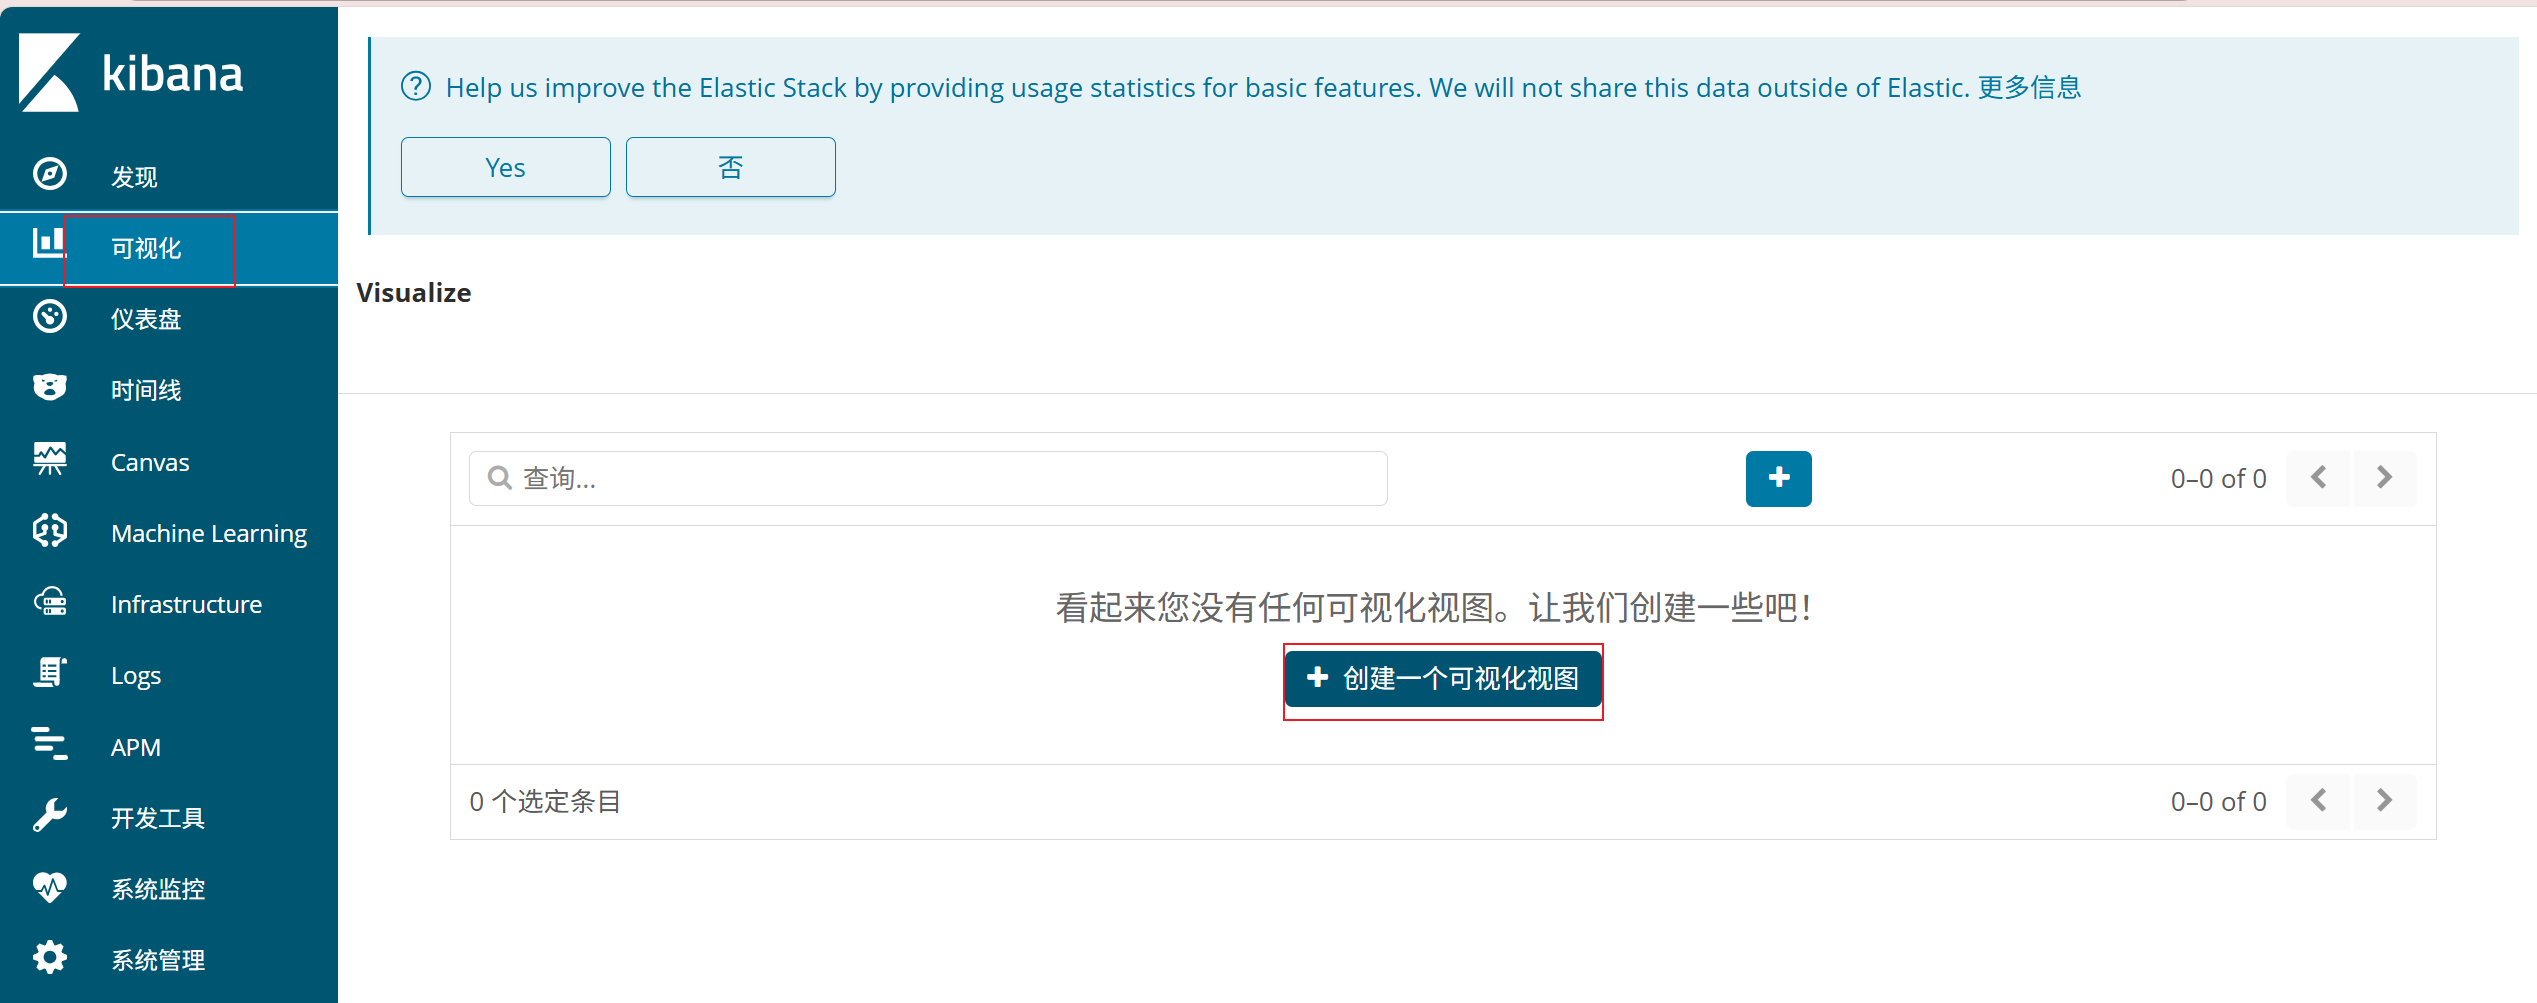
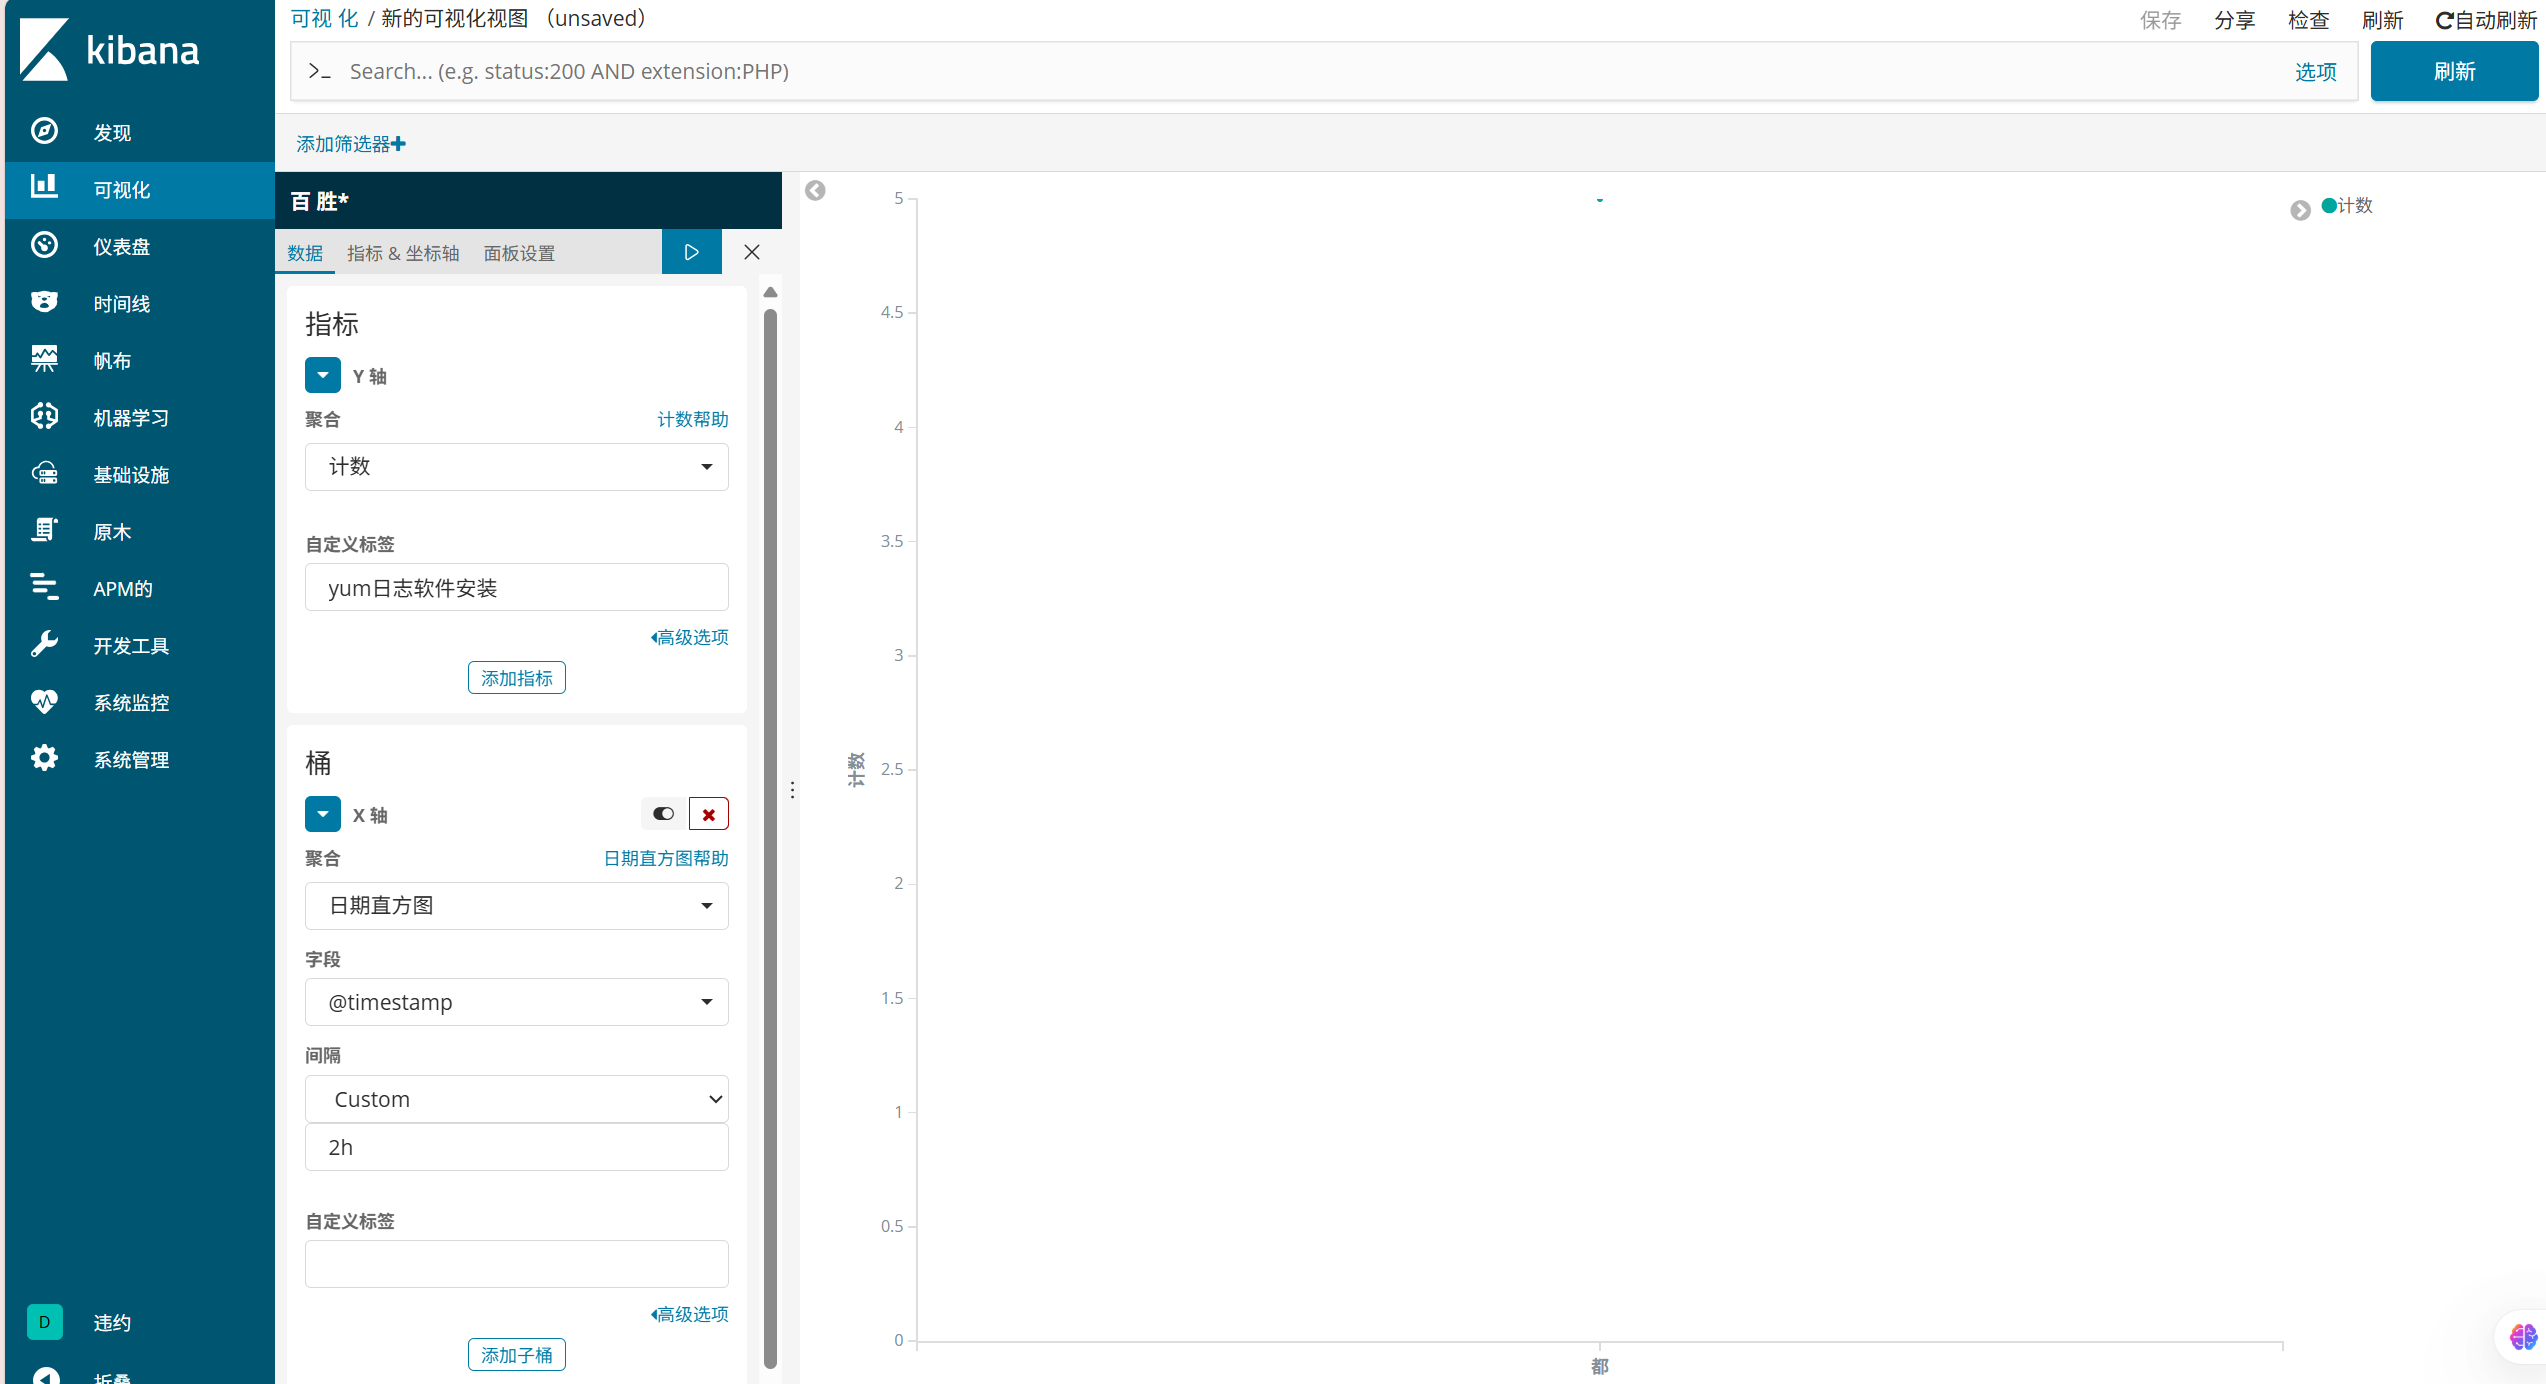
通过kibana做可视化图形
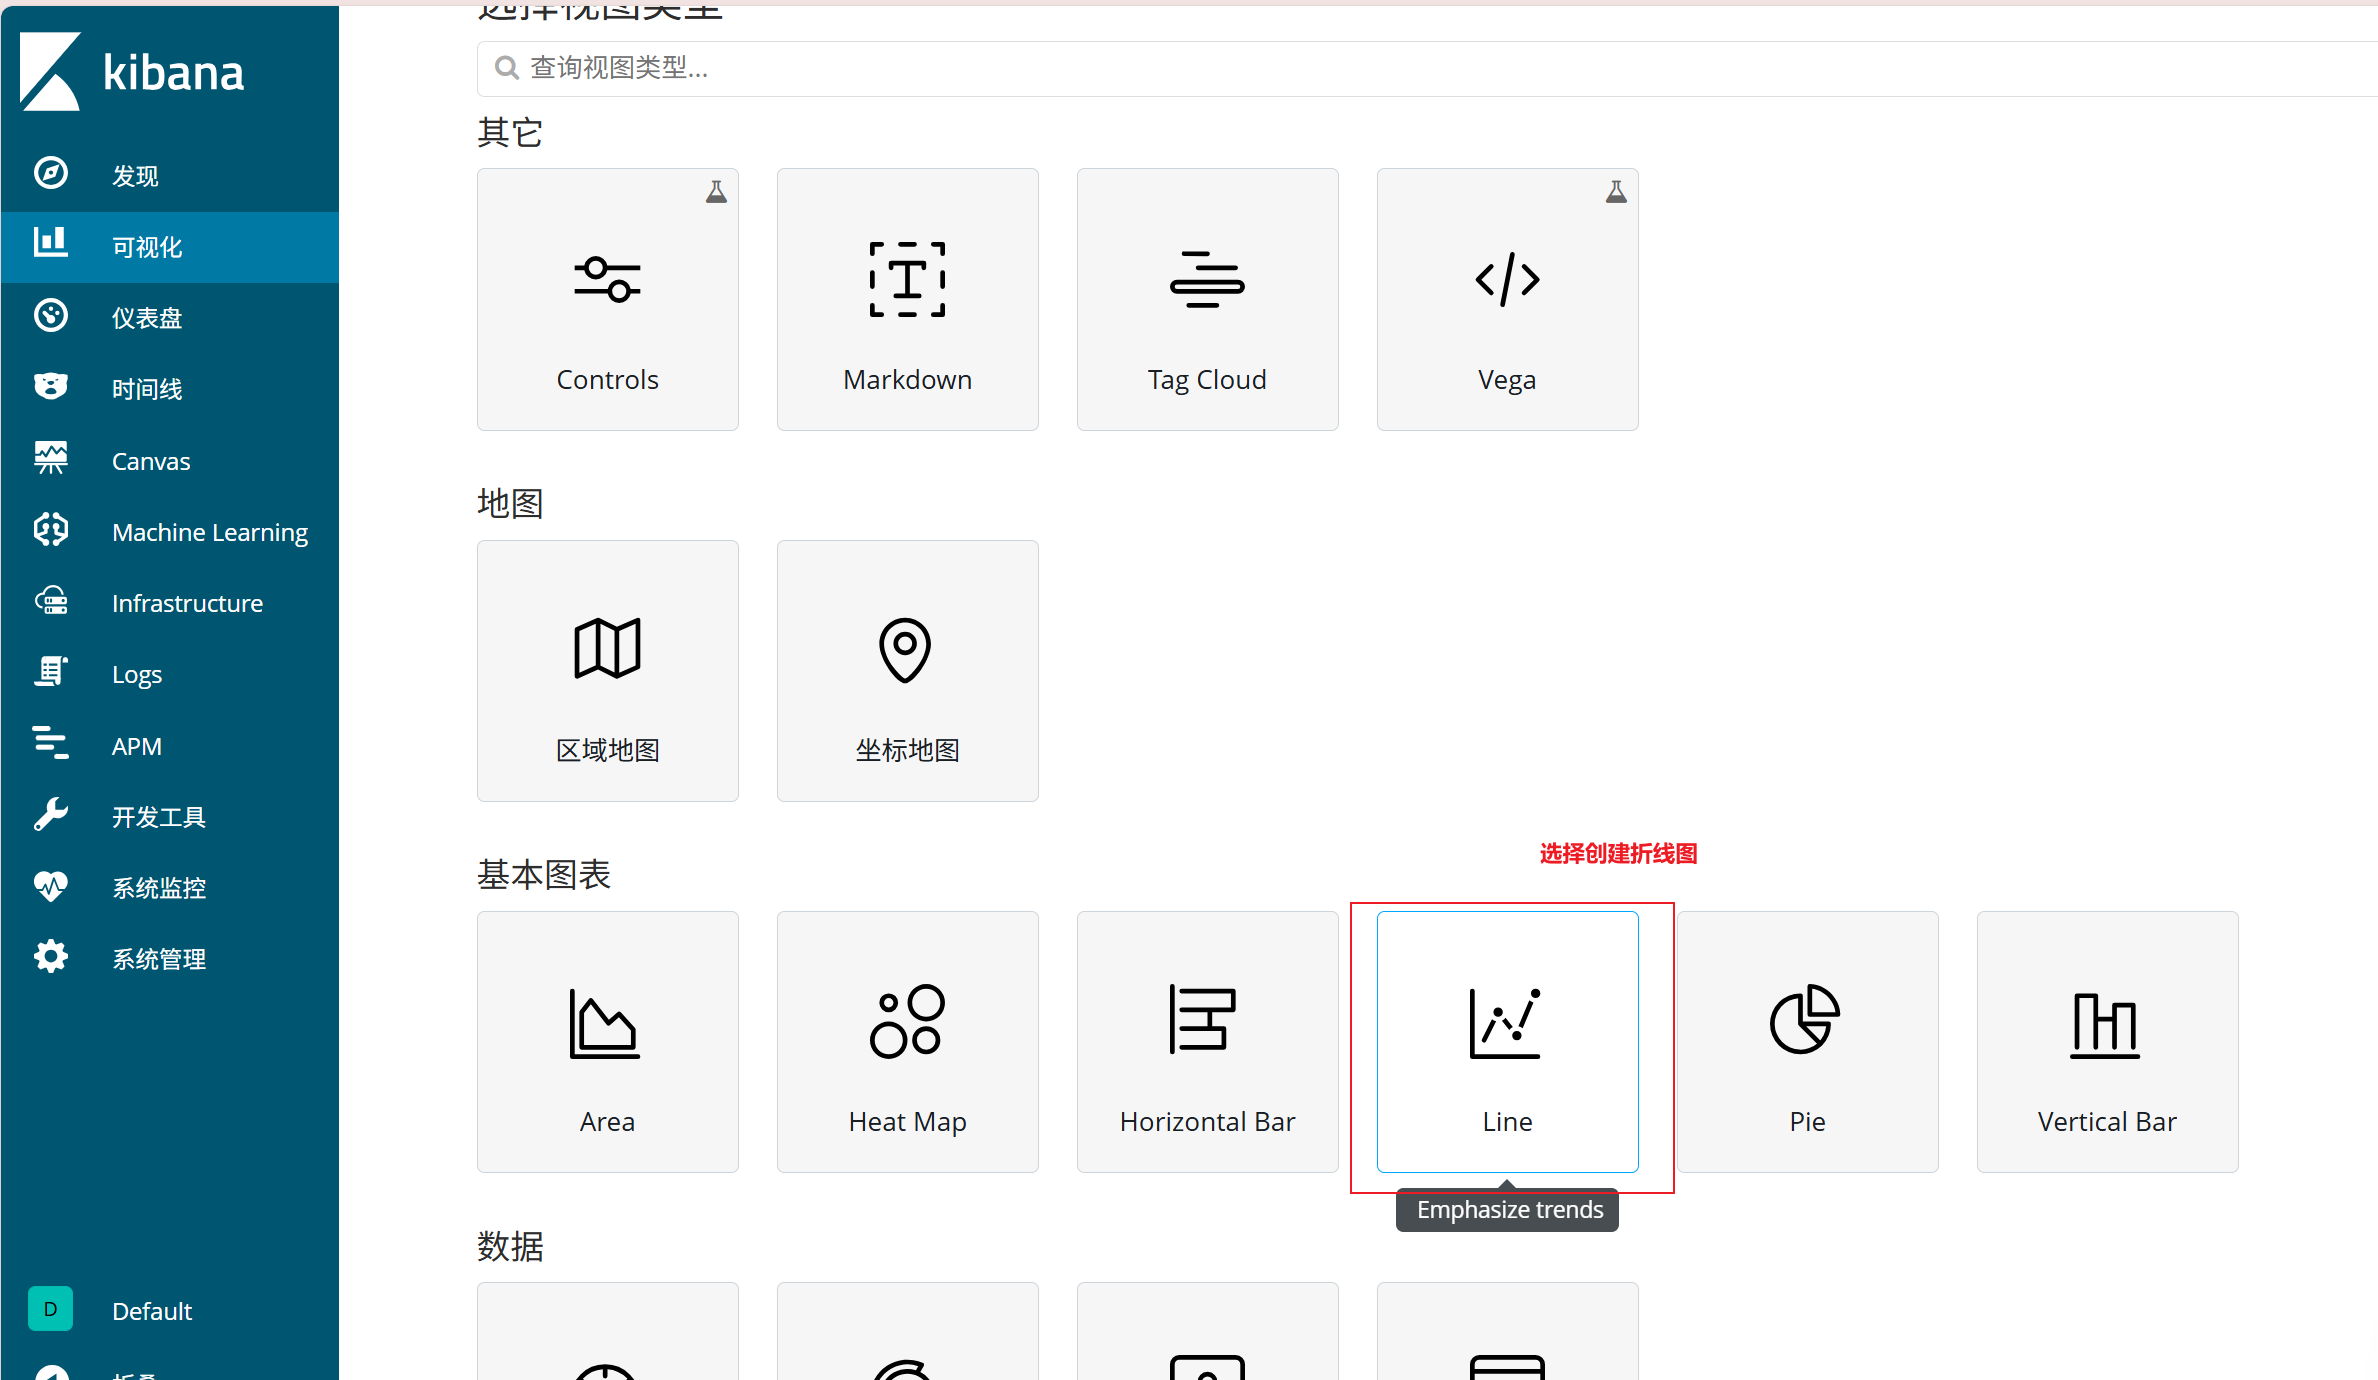
选择对应索引,这里我新建了yum索引
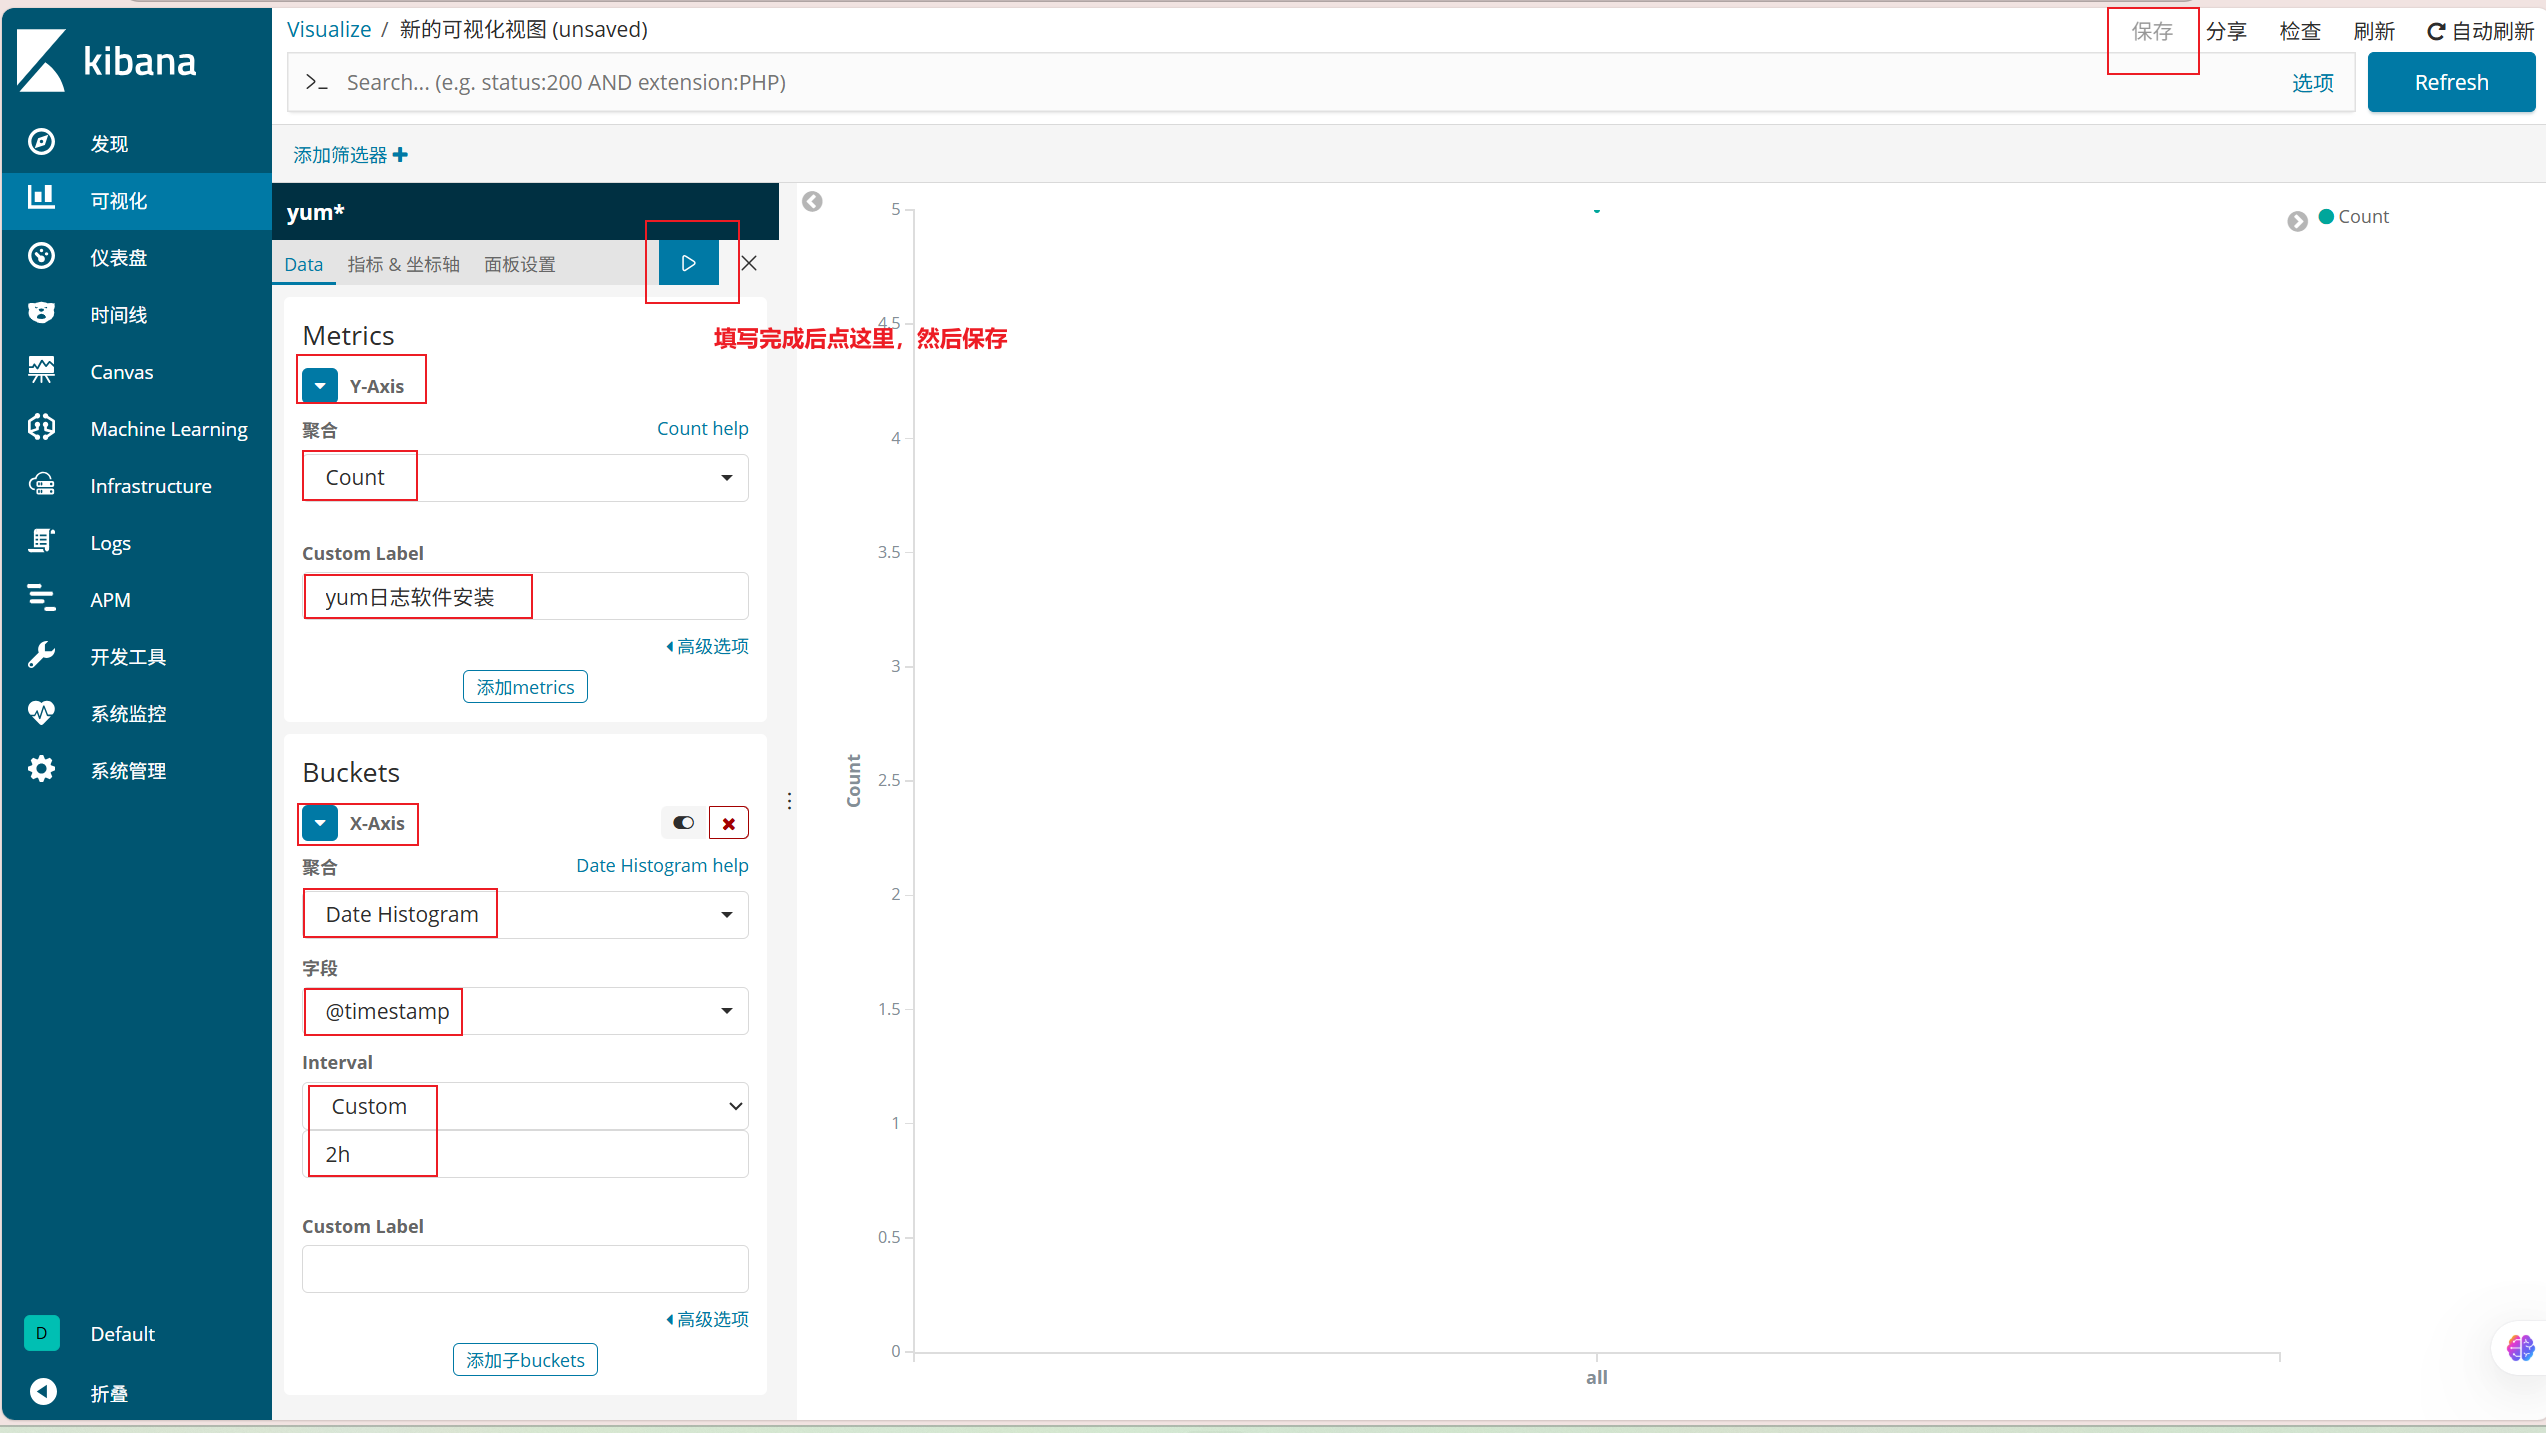
对应中文为
启动logstash中的脚本以及elasticsearch的进程
es2:
[root@es2 ~]# ls
accounts.json    Downloads                Music                           Templates
anaconda-ks.cfg  elasticsearch-6.5.2.rpm  node-v10.24.1-linux-x64.tar.xz  Videos
Desktop          elasticsearch-head       Pictures
Documents        initial-setup-ks.cfg     Public
[root@es2 ~]# cd elasticsearch-head/
[root@es2 elasticsearch-head]# ls
crx                                 index.html         plugin-descriptor.properties
Dockerfile                          LICENCE            proxy
Dockerfile-alpine                   node_modules       README.textile
elasticsearch-head.sublime-project  nohup.out          _site
Gruntfile.js                        package.json       src
grunt_fileSets.js                   package-lock.json  test
[root@es2 elasticsearch-head]# nohup npm run start &
[1] 10641
[root@es2 elasticsearch-head]# nohup: ignoring input and appending output to ‘nohup.out’
logstash:
[root@logstash ~]# jobs -l
[root@logstash ~]# cat /etc/logstash/conf.d/test.conf
input {file {path => "/var/log/messages"start_position => "beginning"type => "messages"}file {path => "/var/log/yum.log"start_position => "beginning"type => "yum"}
}filter {}output {if [type] == "messages" {elasticsearch {hosts => ["192.168.100.10:9200","192.168.100.20:9200"]index => "messages-%{+YYYY-MM-dd}"}}if [type] == "yum" {elasticsearch {hosts => ["192.168.100.10:9200","192.168.100.20:9200"]index => "yum-%{+YYYY-MM-dd}"}}}
[root@logstash ~]# cd /usr/share/logstash/bin
[root@logstash bin]# ./logstash --path.settings /etc/logstash/ -r -f /etc/logstash/conf.d/test.conf &
[1] 10346
[root@logstash bin]# jobs -l
[1]+ 10346 Running                 ./logstash --path.settings /etc/logstash/ -r -f /etc/logstash/conf.d/test.conf &
......
......
[2025-10-24T11:18:40,717][INFO ][logstash.agent           ] Successfully started Logstash API endpoint {:port=>9600}
下载一个服务
[root@logstash ~]# mount /dev/cdrom /mnt
mount: /dev/sr0 is write-protected, mounting read-only
[root@logstash ~]# yum -y install vsftpd
[root@logstash ~]# cat /var/log/yum.log
Oct 23 10:38:29 Installed: apr-1.4.8-3.el7_4.1.x86_64
Oct 23 10:38:29 Installed: apr-util-1.5.2-6.el7.x86_64
Oct 23 10:38:29 Installed: httpd-tools-2.4.6-88.el7.centos.x86_64
Oct 23 10:38:29 Installed: mailcap-2.1.41-2.el7.noarch
Oct 23 10:38:30 Installed: httpd-2.4.6-88.el7.centos.x86_64
Oct 24 11:33:24 Installed: vsftpd-3.0.2-25.el7.x86_64
查看