Prometheus监控部署——pushgateway自动推送
一、pushgateway简介
1.pushgateway的概念
- pushgateway 是采用被动推送的方式,而不是类似于 prometheus server 主动连接 exporter 获取监控数据。
- pushgateway 可以单独运行在一个节点,然后需要自定义监控脚本把需要监控的主动推送给 pushgateway的 API 接口, 然后 pushgateway 再等待 prometheus server 抓取数据
2.pushgateway的特点
- pushgateway 本身没有任何抓取监控数据的功能
- 目前 pushgateway 只是被动的等待数据从客户端推送过来。
二、pushgateway安装
1.服务端安装pushgateway
[root@localhost ~]# tar -xf pushgateway-1.11.1.linux-amd64.tar.gz
[root@localhost ~]# cp -r pushgateway-1.11.1.linux-amd64 /usr/local/pushgateway
2.创建启动配置文件
[root@localhost ~]# cat>/usr/local/pushgateway/pushgateway.service<<EOF
[Unit]
Description=pushgateway
After=network.target[Service]
Type=simple
User=root
WorkingDirectory=/usr/local/pushgateway
ExecStart=/usr/local/pushgateway/pushgateway --persistence.file="/usr/local/pushgateway/data/pg.db" --persistence.interval=5mRestart=on-failure
LimitNOFILE=65536[Install]
WantedBy=multi-user.target
EOF
[root@localhost ~]# mkdir /usr/local/pushgateway/data
[root@localhost ~]# ln -s /usr/local/pushgateway/pushgateway.service /lib/systemd/system
[root@localhost ~]# systemctl enable --now pushgateway.service
Created symlink /etc/systemd/system/pushgateway.service → /usr/local/pushgateway/pushgateway.service.
Created symlink /etc/systemd/system/multi-user.target.wants/pushgateway.service → /usr/local/pushgateway/pushgateway.service.
[root@localhost ~]# netstat -anpt | grep pushgateway
tcp6       0      0 :::9091                 :::*                    LISTEN      2485/pushgateway
三、客户端推送数据
1.推送单条数据
语法:
- 要 Push 数据到 PushGateway 中, 可以通过其提供的 API 标准接口来添加
- 默认 URL 地址为:http://<ip>:9091/metrics/job/<JOBNAME>{/<LABEL_NAME>/<LABEL_VALUE>},
- 其中<JOBNAME>是必填项, 为 job 标签值, 后边可以跟任意数量的标签对
- 一般我们会添加一个 instance/<INSTANCE_NAME>实例名称标签, 来方便区分各个指标。
客户端(66.67)推送:
[root@localhost ~]# echo "mytest_metric 2025" | curl --data-binary @- http://192.168.66.66:9091/metrics/job/mytest_job# mytest_metric  命令行创建的job名称,实际同prometheus中的job一样
# push_time_seconds  自动生成,记录指标数据的失败上传时间
# push_failure_time_seconds 自动生成,记录指标数据的成功上传时间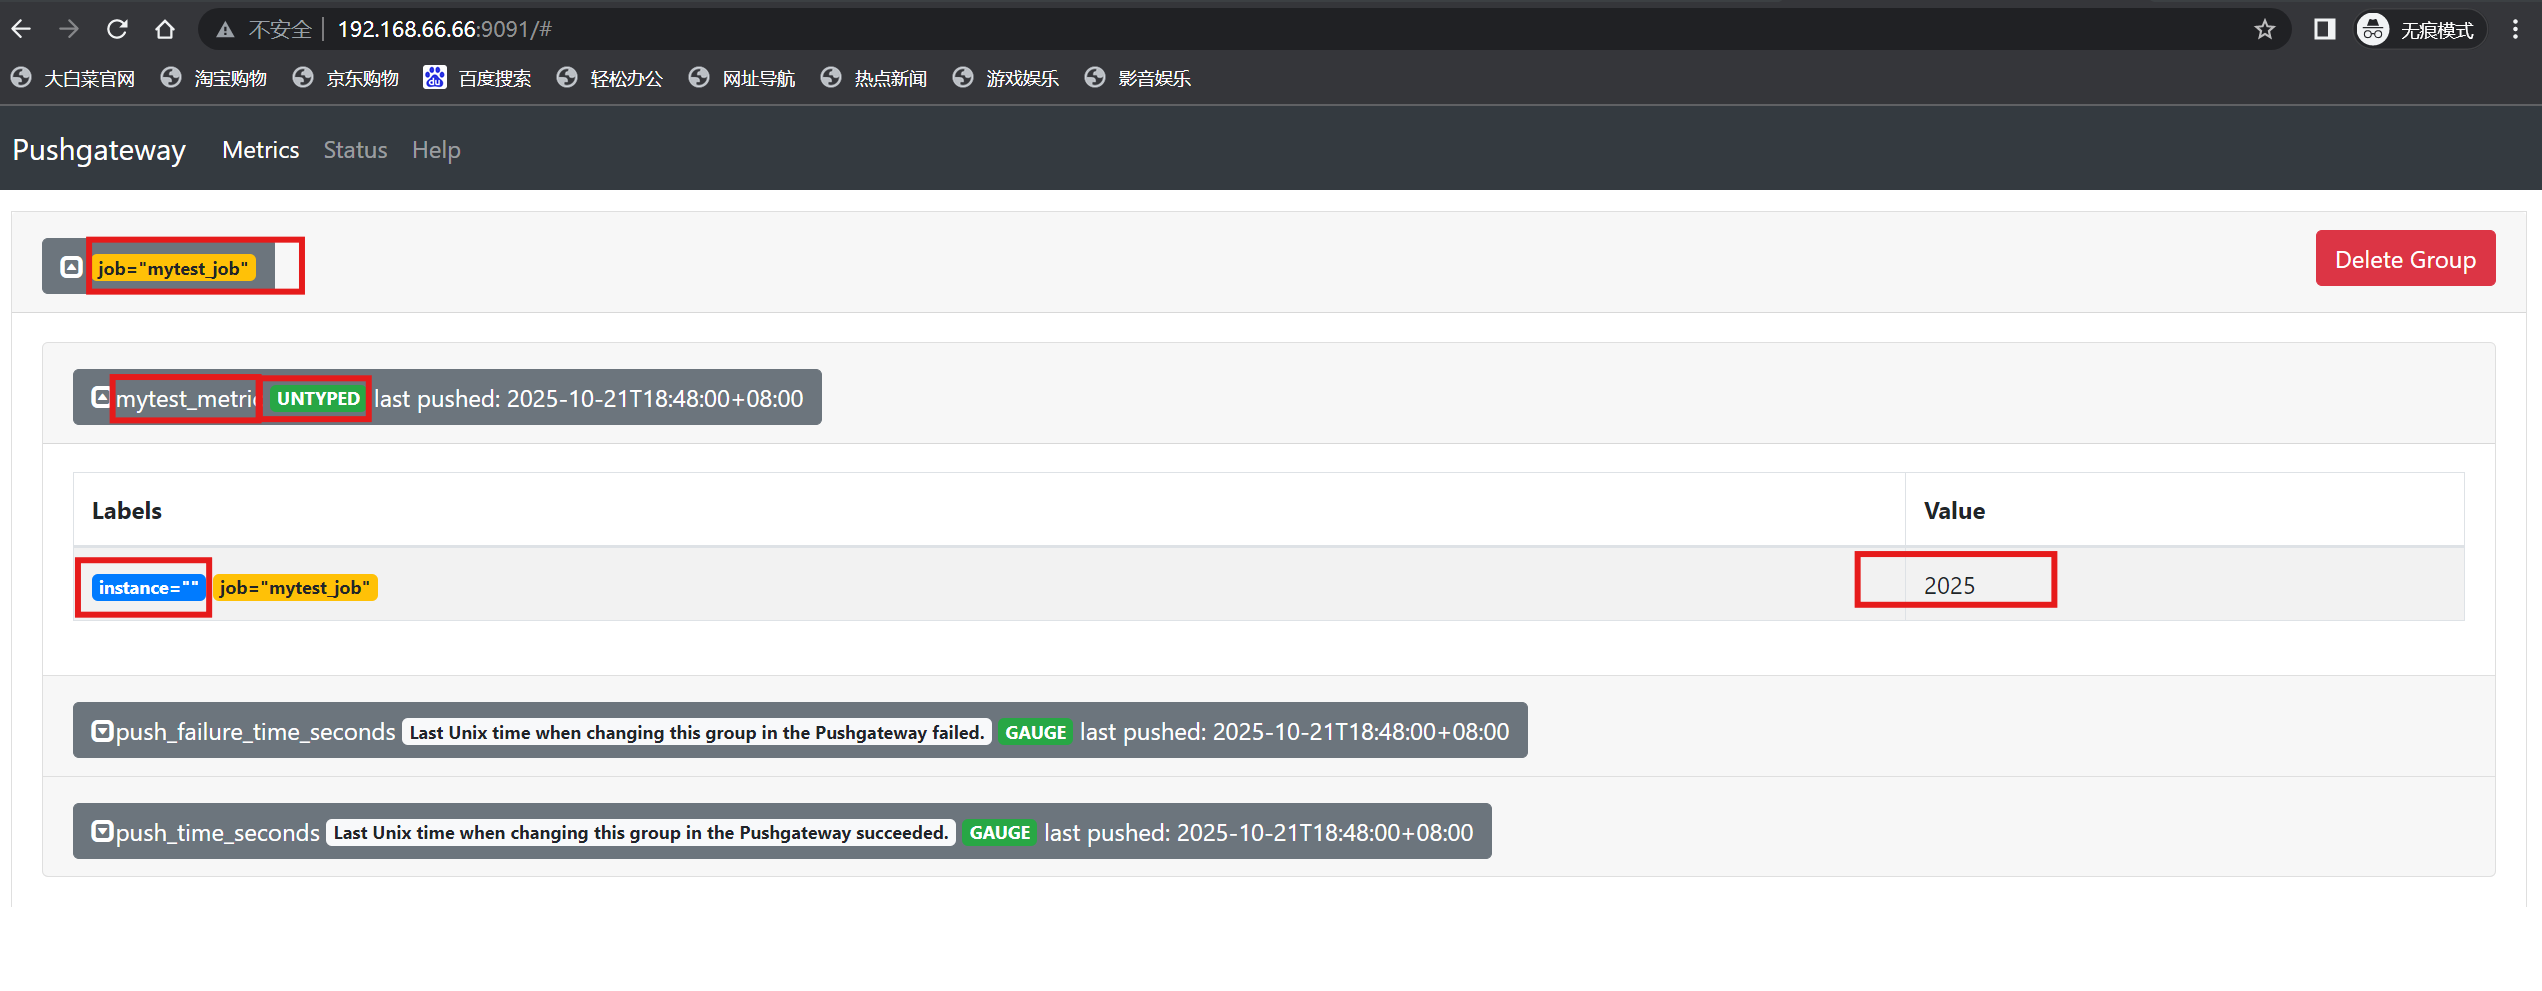
注:当前没有发送方interface和数据类型untype
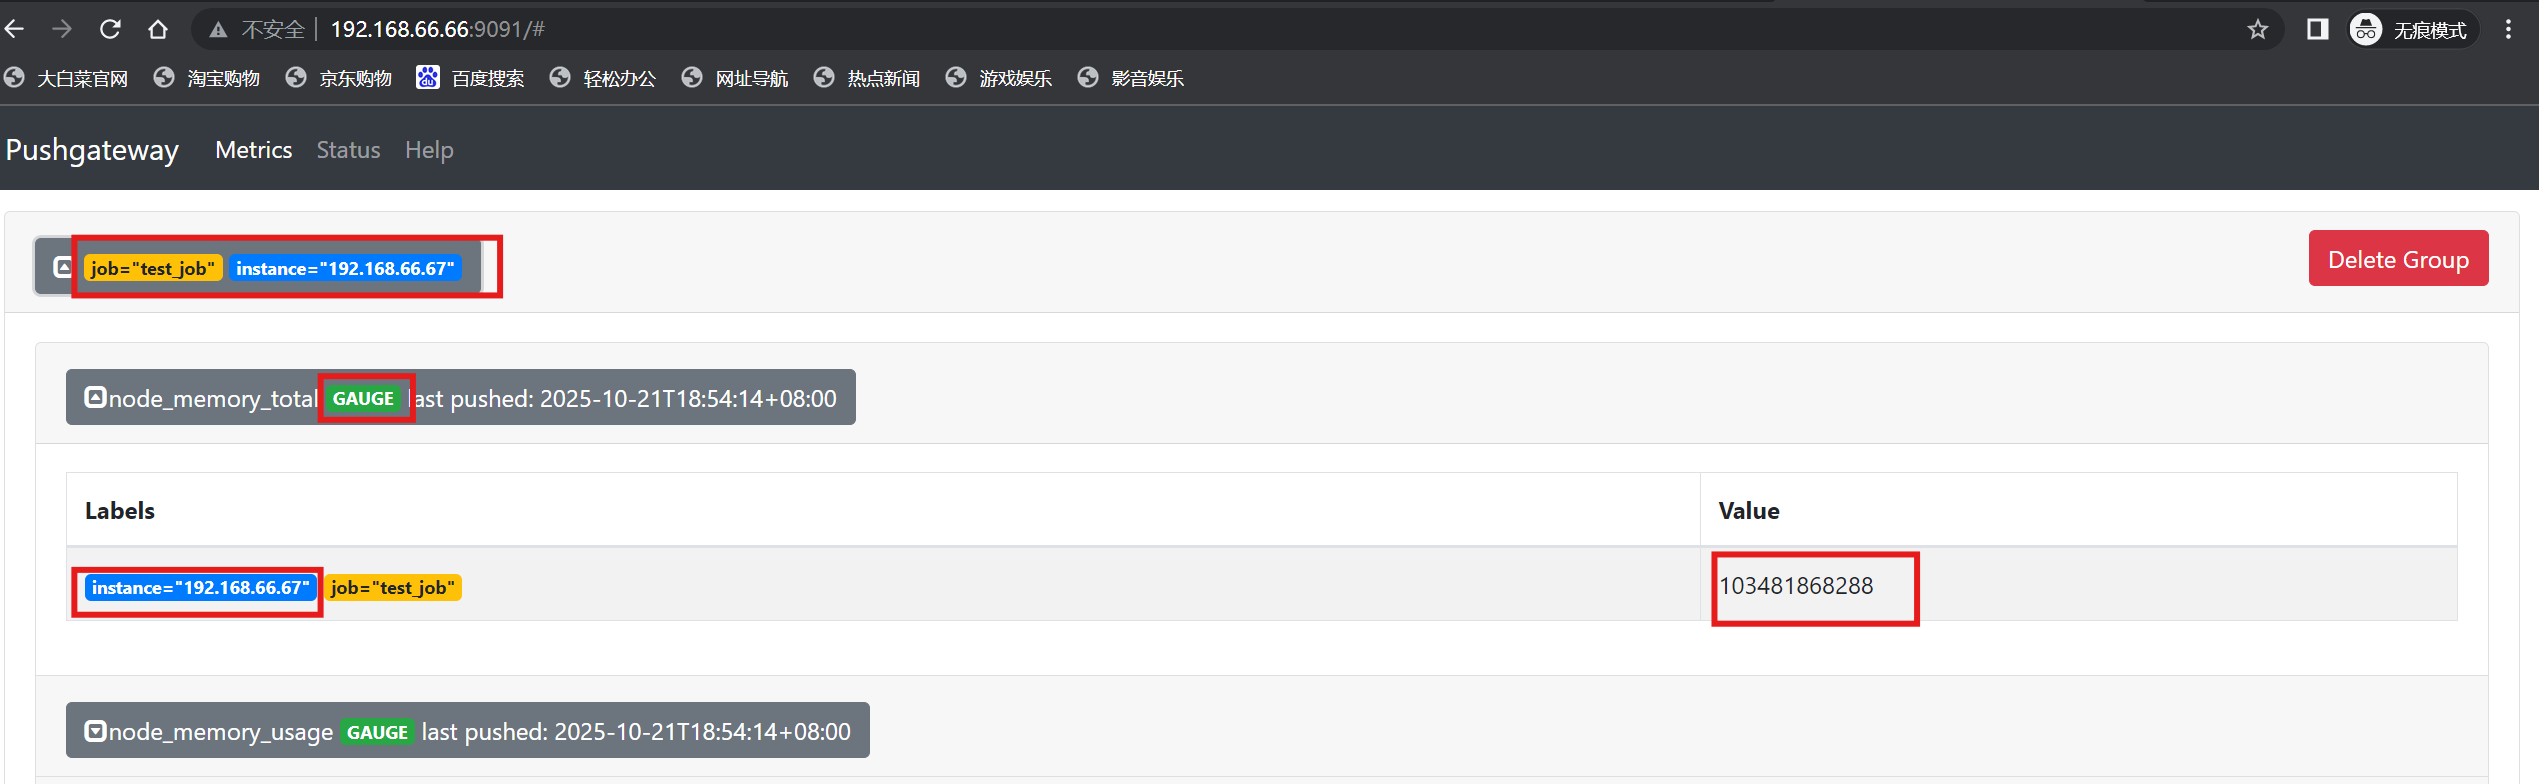
2.推送多条数据
[root@localhost ~]# cat <<EOF | curl --data-binary @- http://192.168.66.66:9091/metrics/job/test_job/instance/192.168.66.67
# TYPE node_memory_usage gauge
node_memory_usage 4311744512
# TYPE node_memory_total gauge
node_memory_total 103481868288
EOF
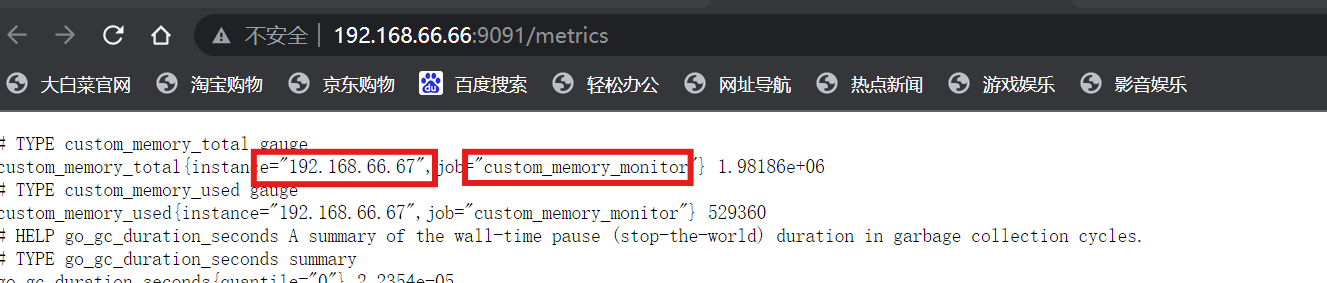
3.简易推送数据脚本
[root@localhost ~]# vi mem_monitor.sh
# cat mem_monitor.sh
#!/bin/bash
total_memory=$(free |awk '/Mem/{print $2}')
used_memory=$(free |awk '/Mem/{print $3}')job_name="custom_memory_monitor"
instance_name=`ifconfig ens160 | grep -w inet | awk '{print $2}'`
pushgateway_server="http://192.168.66.66:9091/metrics"#可以写多个标签,格式为  key/value,如果新增一个zone标签,可以写成为 /instance/${instance_name}/zone/ShangHai ,后面可以一直加
cat <<EOF | curl --data-binary @- ${pushgateway_server}/job/${job_name}/instance/${instance_name}
#TYPE custom_memory_total gauge
custom_memory_total $total_memory
#TYPE custom_memory_used gauge
custom_memory_used $used_memory
EOF
[root@localhost ~]# bash mem_monitor.sh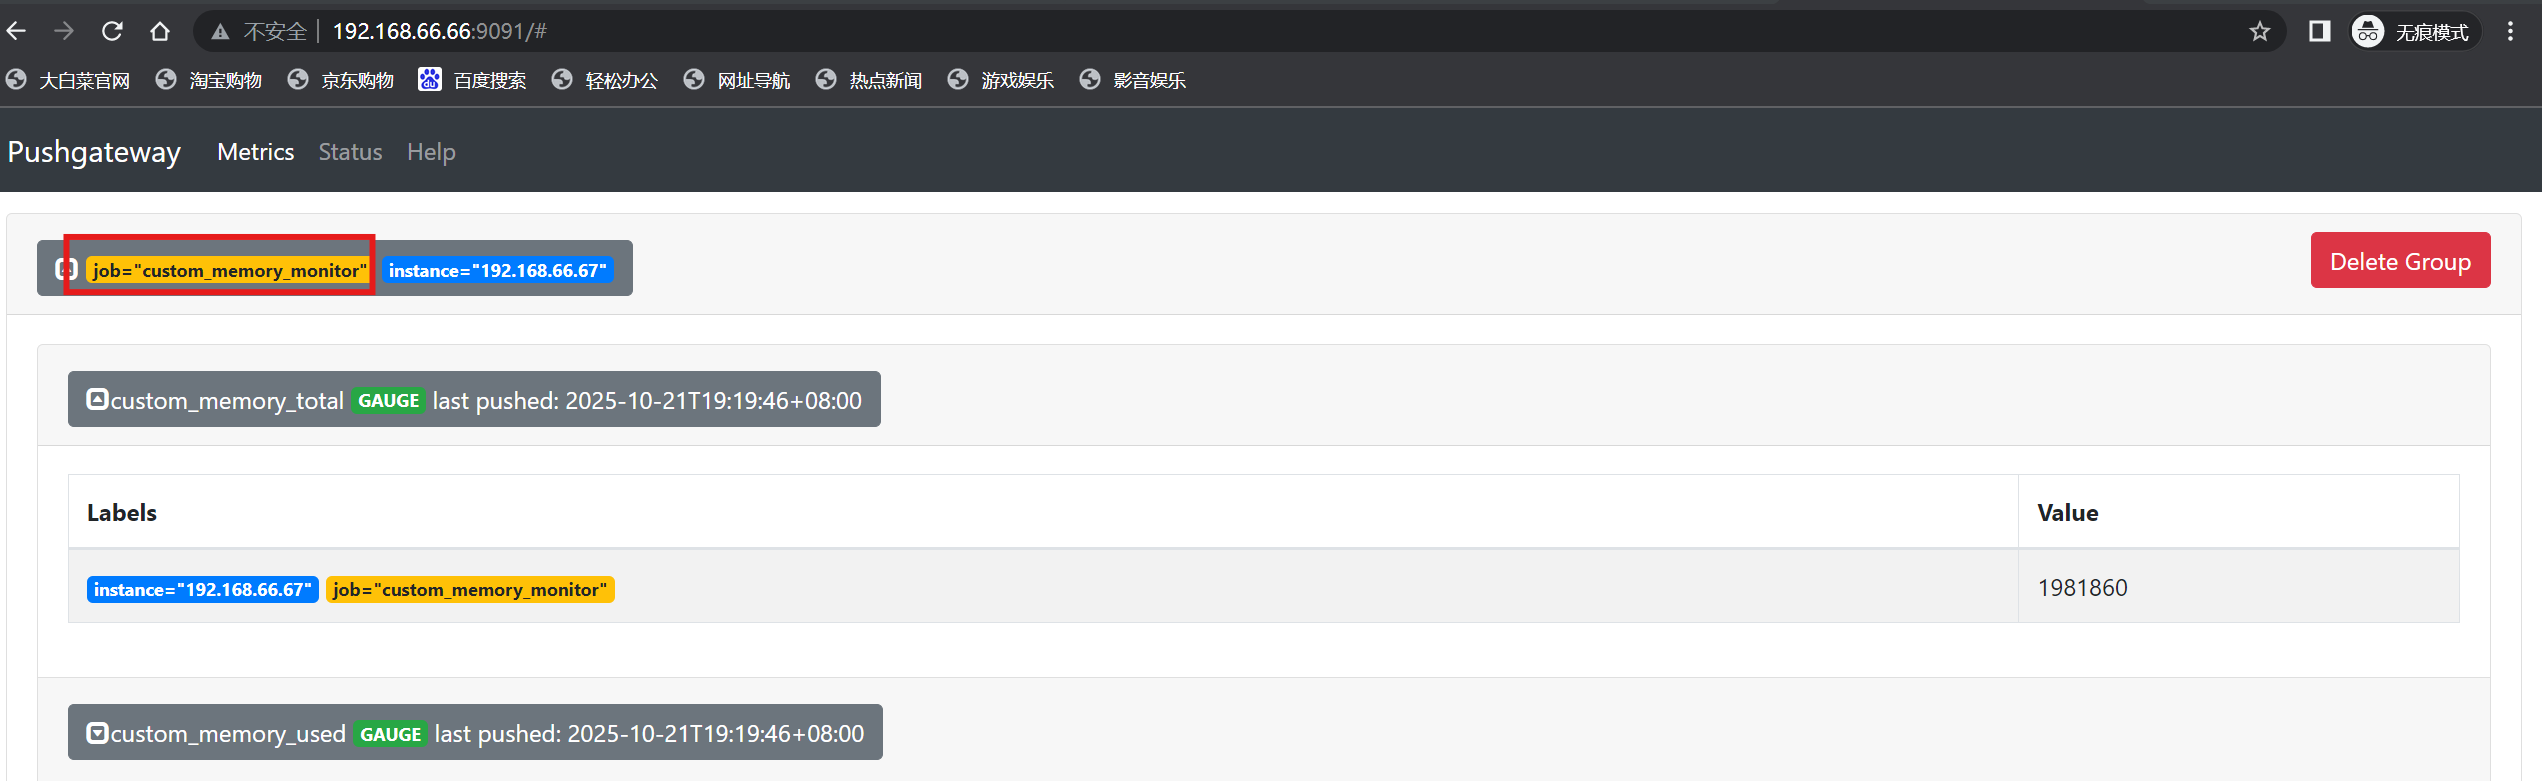
4.删除数据
服务端删除:
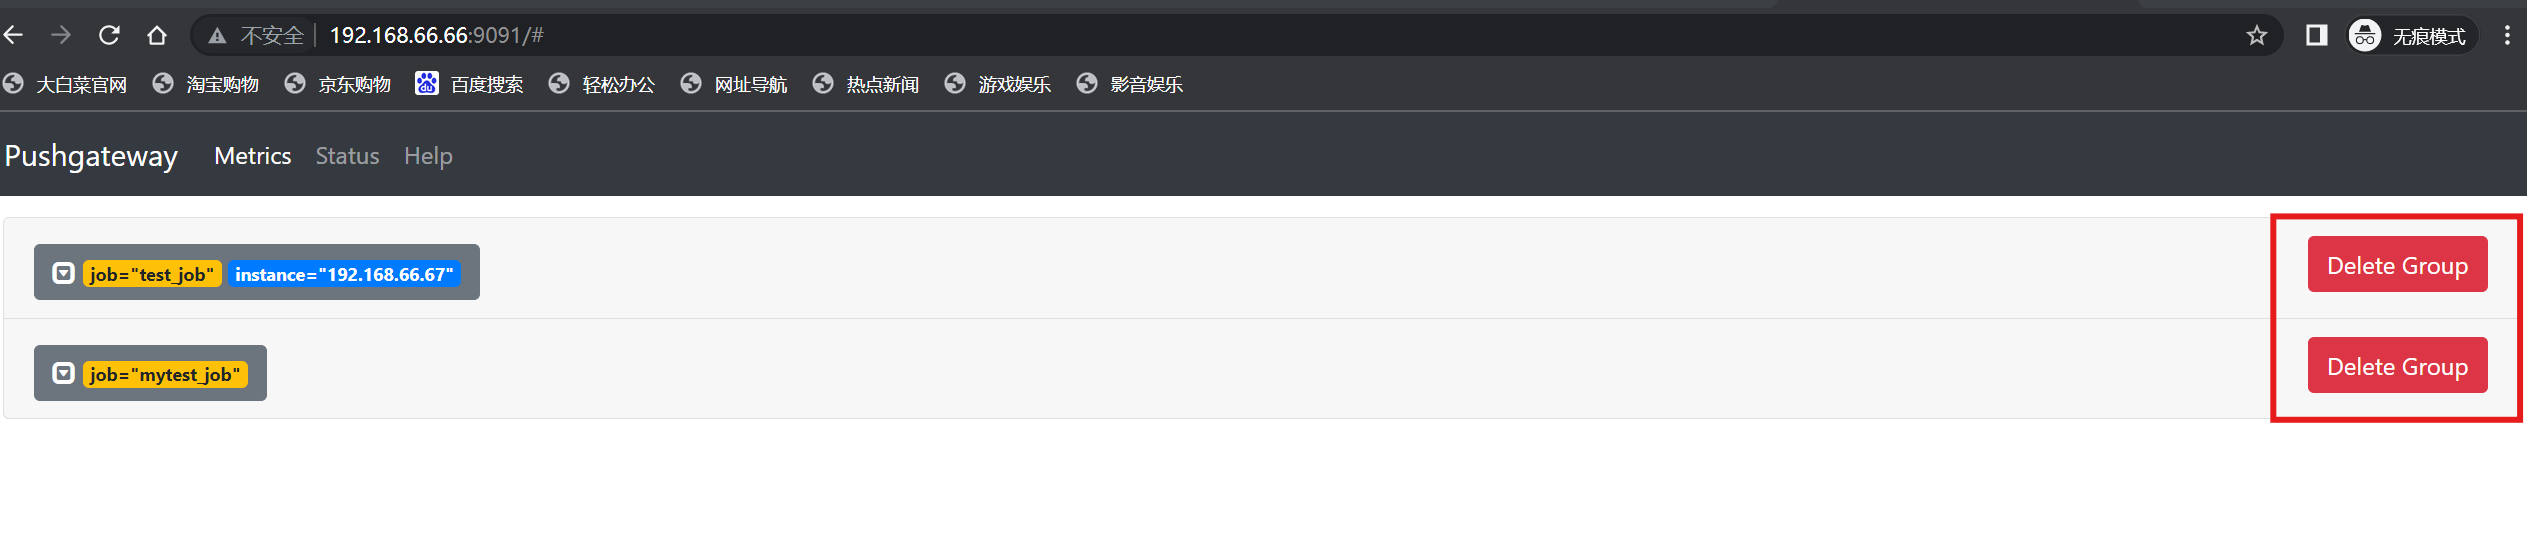
客户端删除:
# 根据job及标签删除对应的数据
[root@localhost ~]# curl -X DELETE http://192.168.66.66:9091/metrics/job/test_job/instance/192.168.66.67
四、Prometheus抓取数据
1.修改主配置文件
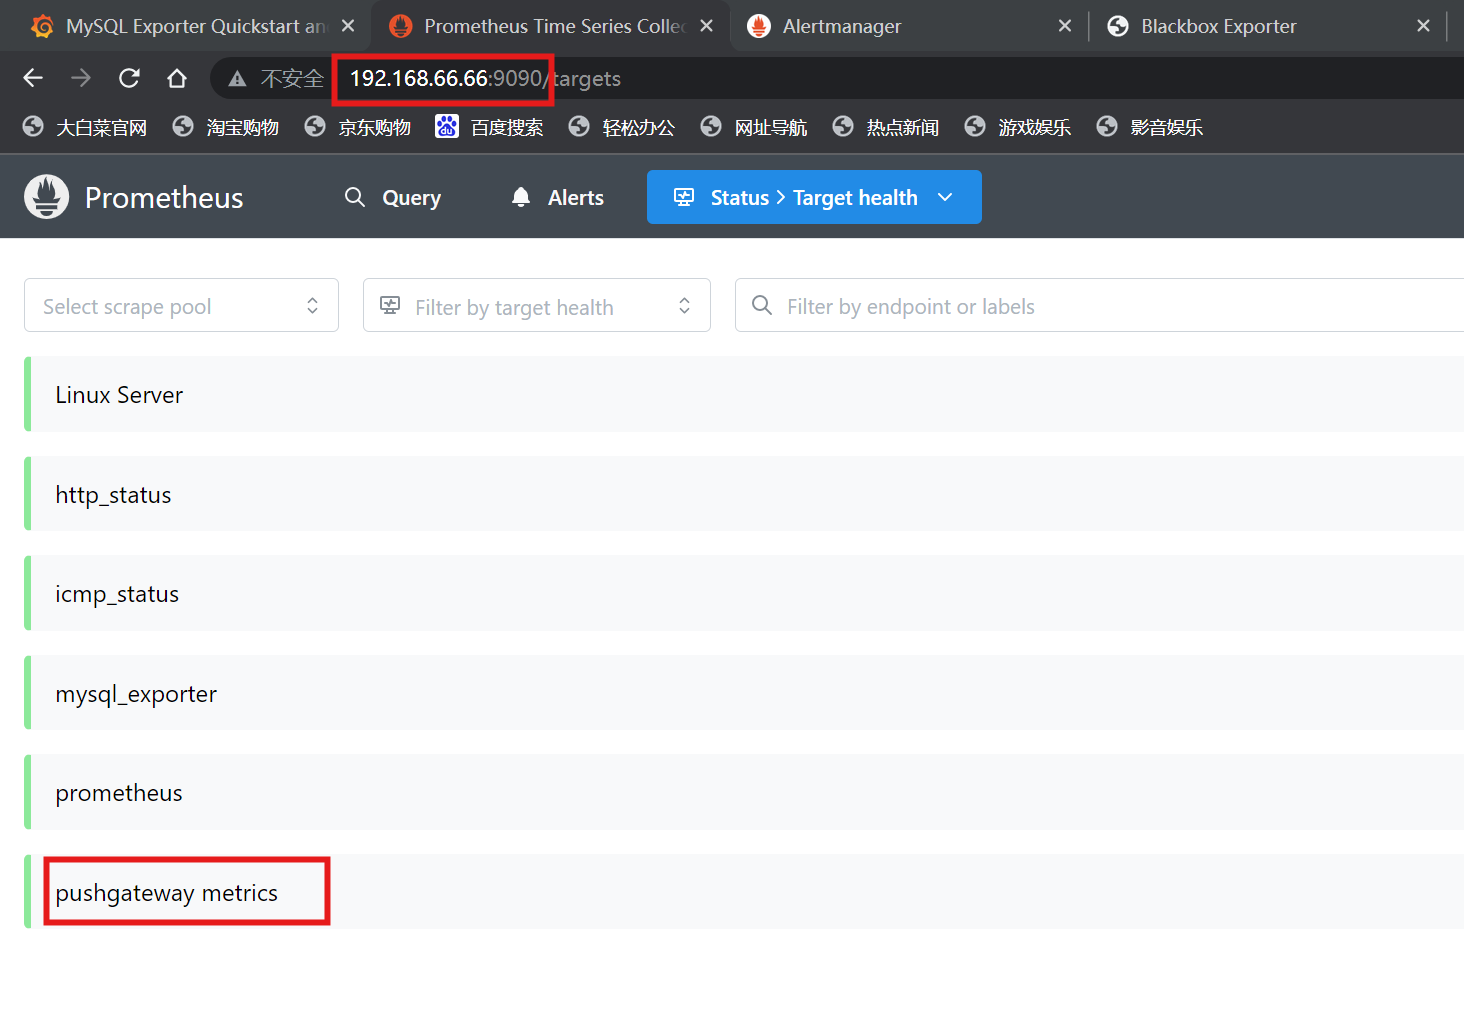
[root@localhost ~]# vi /usr/local/prometheus/prometheus.yml - job_name: "pushgateway metrics"static_configs:- targets: ["192.168.66.66:9091"]honor_labels: true
[root@localhost ~]# systemctl restart prometheus.service
2.查看prometheus监控页面
五、自动发现
1.自动发现分类
- 静态配置
- 基于文件的自动发现
- 基于DNS的自动发现
- 基于consul自动发现
- 基于kubernetes的自动发现
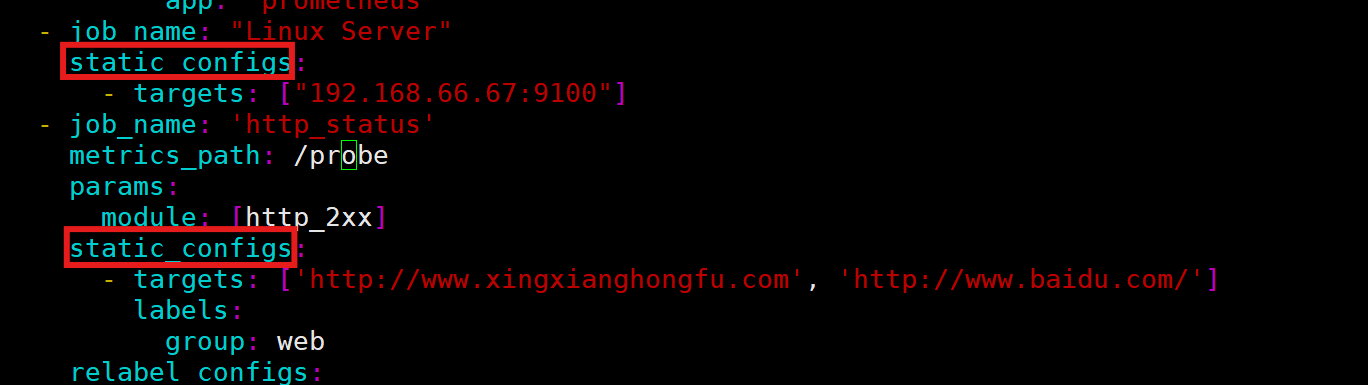
2.静态配置
3.基于文件的自动发现
- 目标:减轻主服务器的配置压力
(1)修改主配置文件
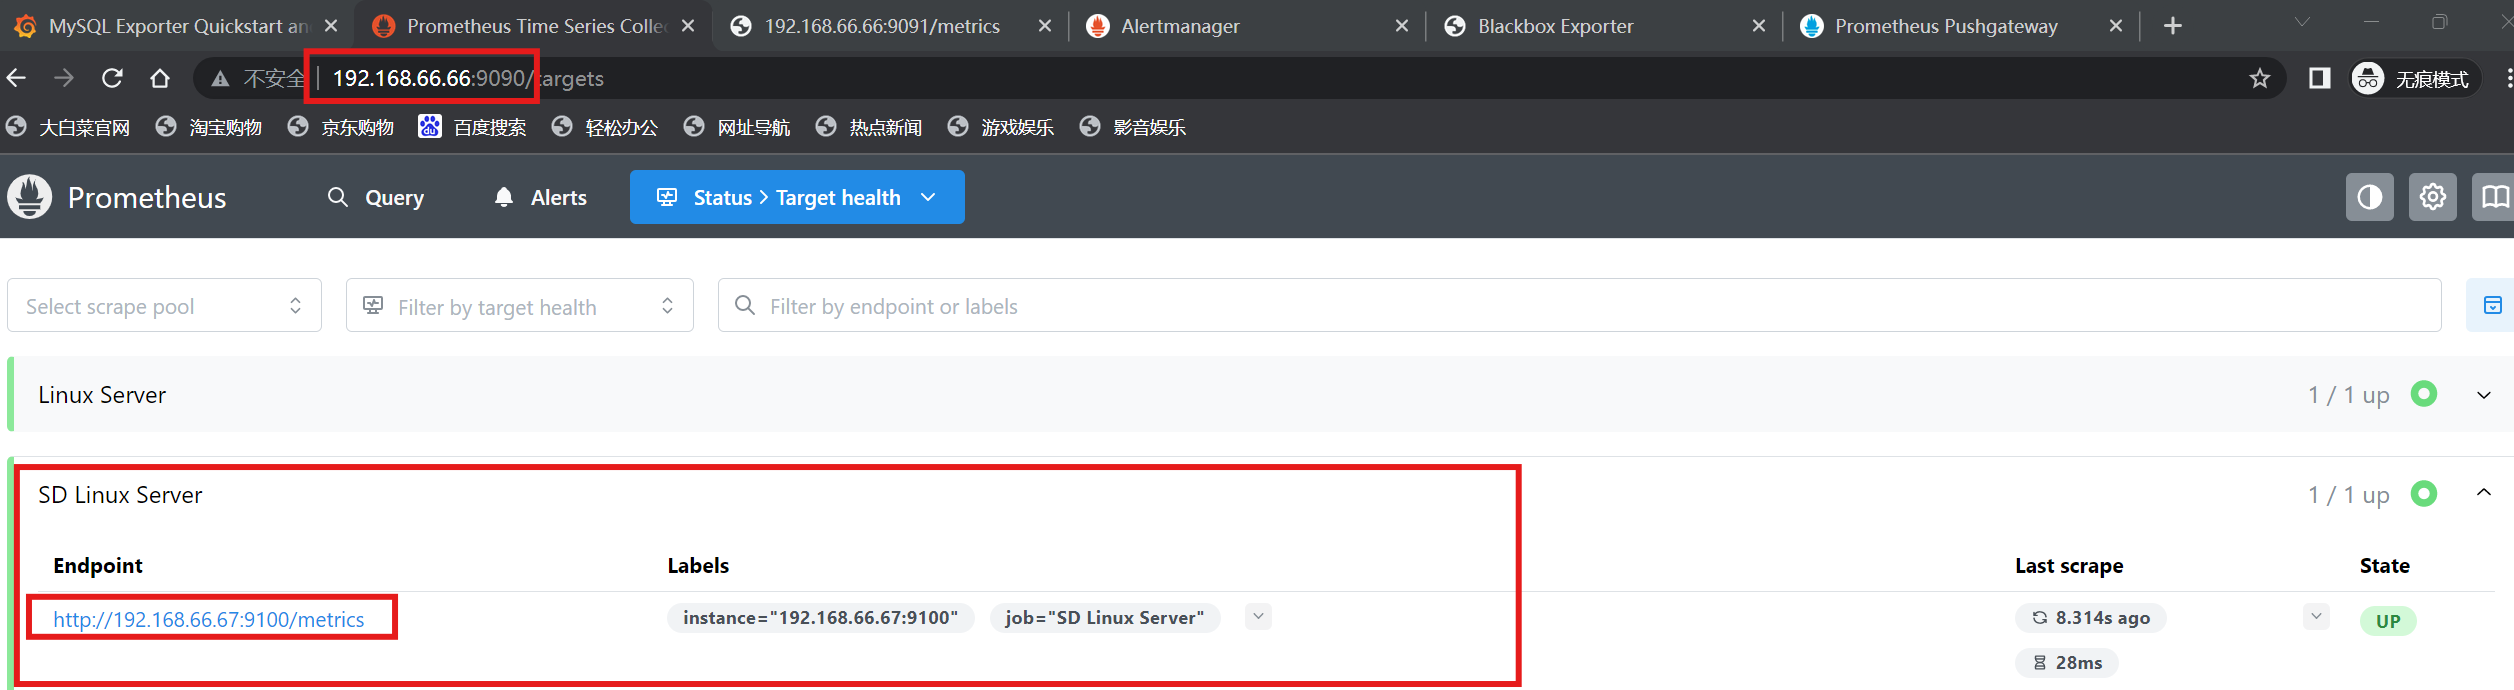
[root@localhost ~]# vi /usr/local/prometheus/prometheus.yml- job_name: "SD Linux Server"file_sd_configs:- files:- "/usr/local/prometheus/67.yml"(2)修改子配置文件
[root@localhost ~]# vi /usr/local/prometheus/67.yml- targets: ["192.168.66.67:9100"]
[root@localhost ~]# systemctl restart prometheus.service
(3)查看prometheus监控页面
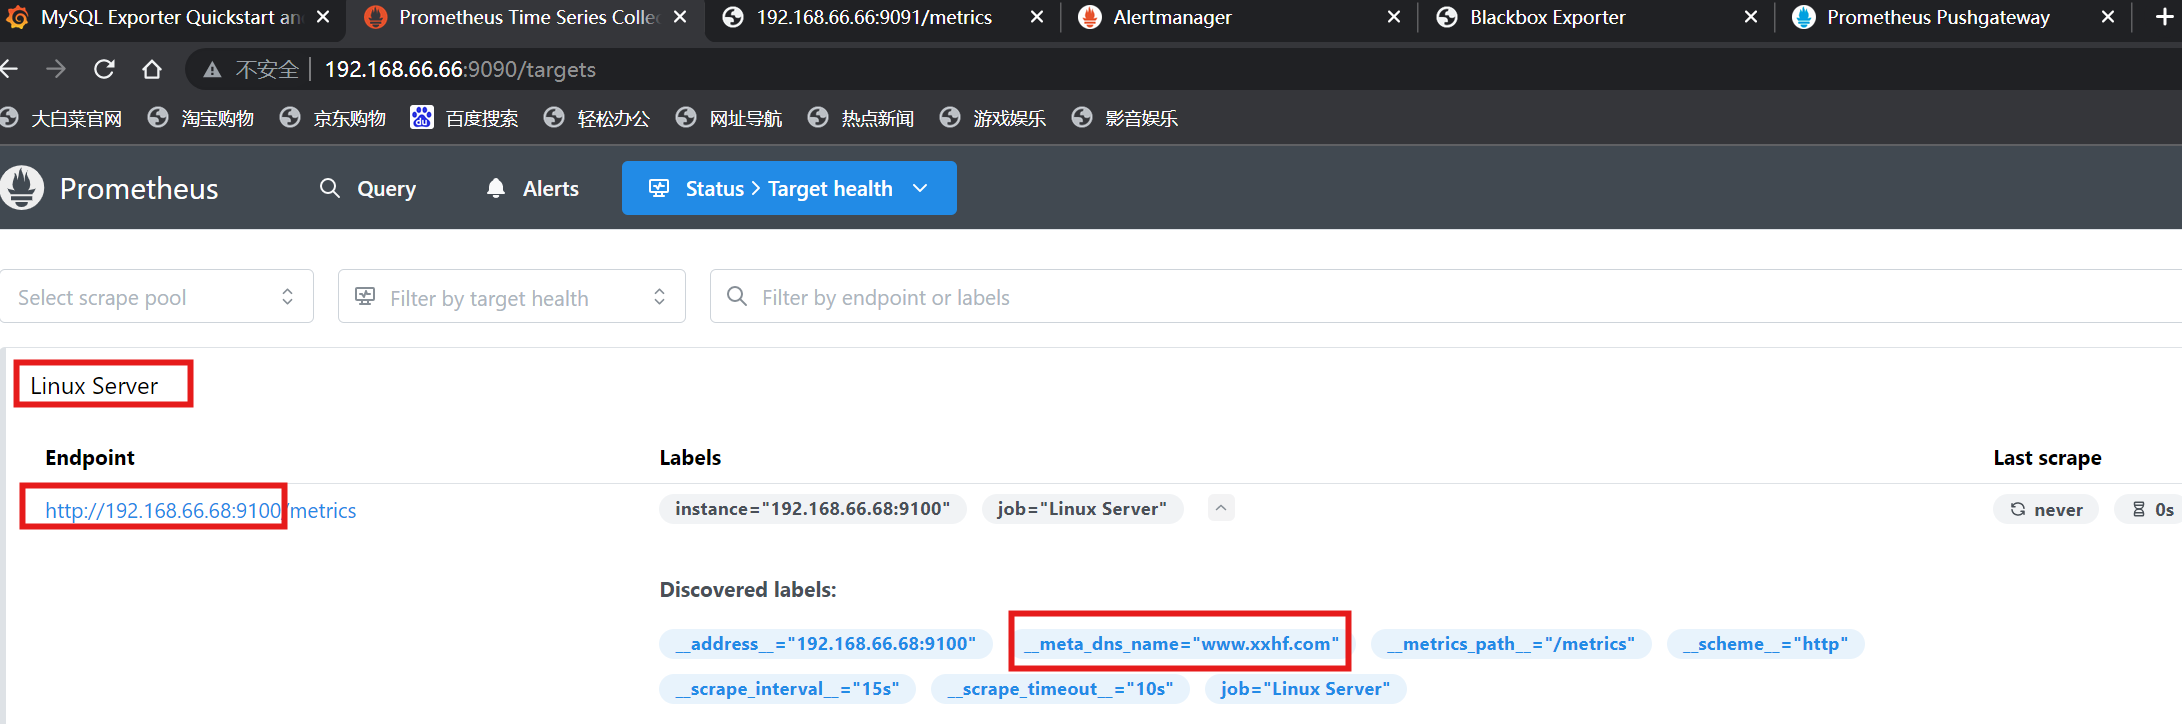
4.基于DNS的自动发现
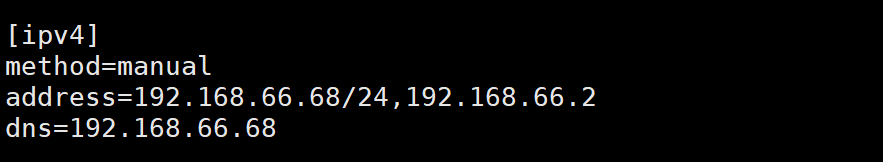
(1)搭建dns服务(66.68)
[root@localhost ~]# dnf -y install bind
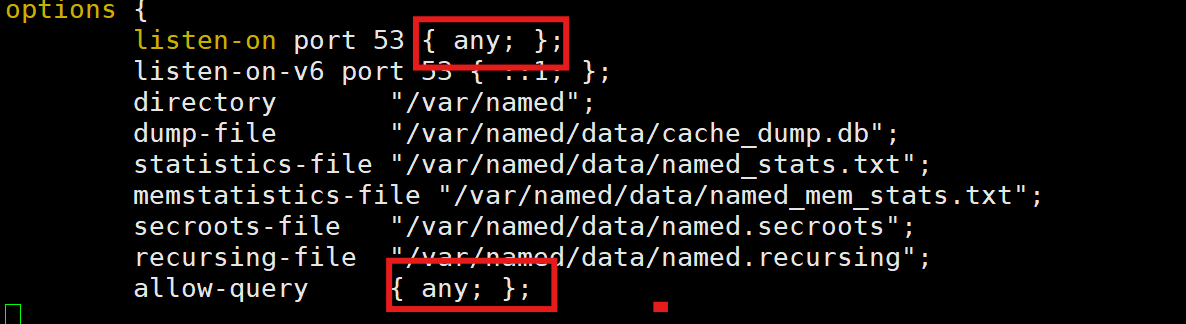

[root@localhost ~]# systemctl enable --now named

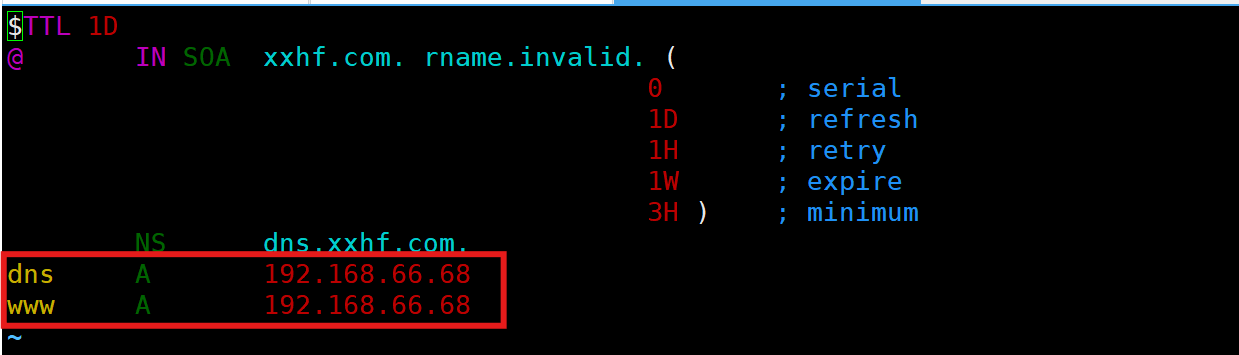
(2)修改prometheus服务域名和配置文件

[root@localhost ~]# vi /usr/local/prometheus/prometheus.yml- job_name: "Linux Server"dns_sd_configs:- names: ["www.xxhf.com"]type: Aport: 9100
[root@localhost ~]# systemctl restart prometheus.service
(3)查看prometheus监控页面
5.基于consul的自动发现
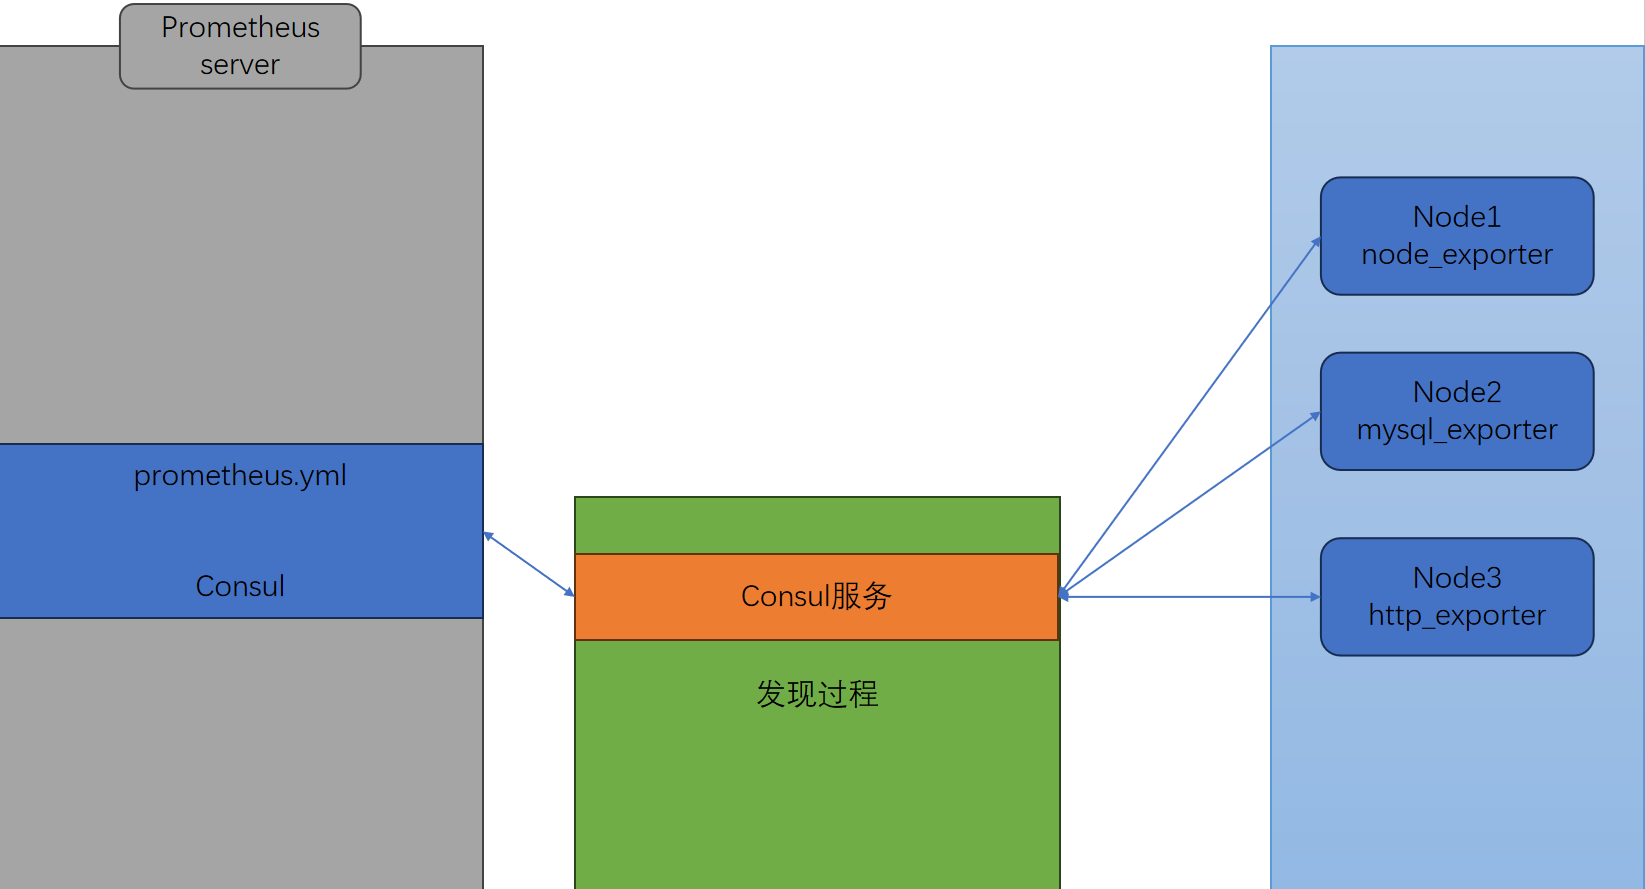
注:prometheus-server(66)——consul(67)——prometheus-client(68)
(1)安装consul组件
- 组件下载:https://releases.hashicorp.com/consul/
[root@localhost ~]# ls
anaconda-ks.cfg  consul_1.22.0-rc2_linux_amd64.zip  mysqld_exporter-0.18.0.linux-amd64         node_exporter-1.9.1.linux-amd64
cat.sh           mem_monitor.sh                     mysqld_exporter-0.18.0.linux-amd64.tar.gz  node_exporter-1.9.1.linux-amd64.tar.gz
[root@localhost ~]# unzip consul_1.22.0-rc2_linux_amd64.zip
[root@localhost ~]# mv consul /usr/local/bin/
[root@localhost ~]# mkdir -p /data/consul
# 默认进程是在前台运行的
[root@localhost ~]# nohup consul agent -dev -ui -client 0.0.0.0 -enable-script-checks -data-dir /data/consul &
(2)客户端(68)部署node节点
[root@localhost node_exporter]# ln -s /usr/local/node_exporter/node_exporter.service /lib/systemd/system/
[root@localhost node_exporter]# systemctl enable --now node_exporter.service
(3)主配置文件添加consul
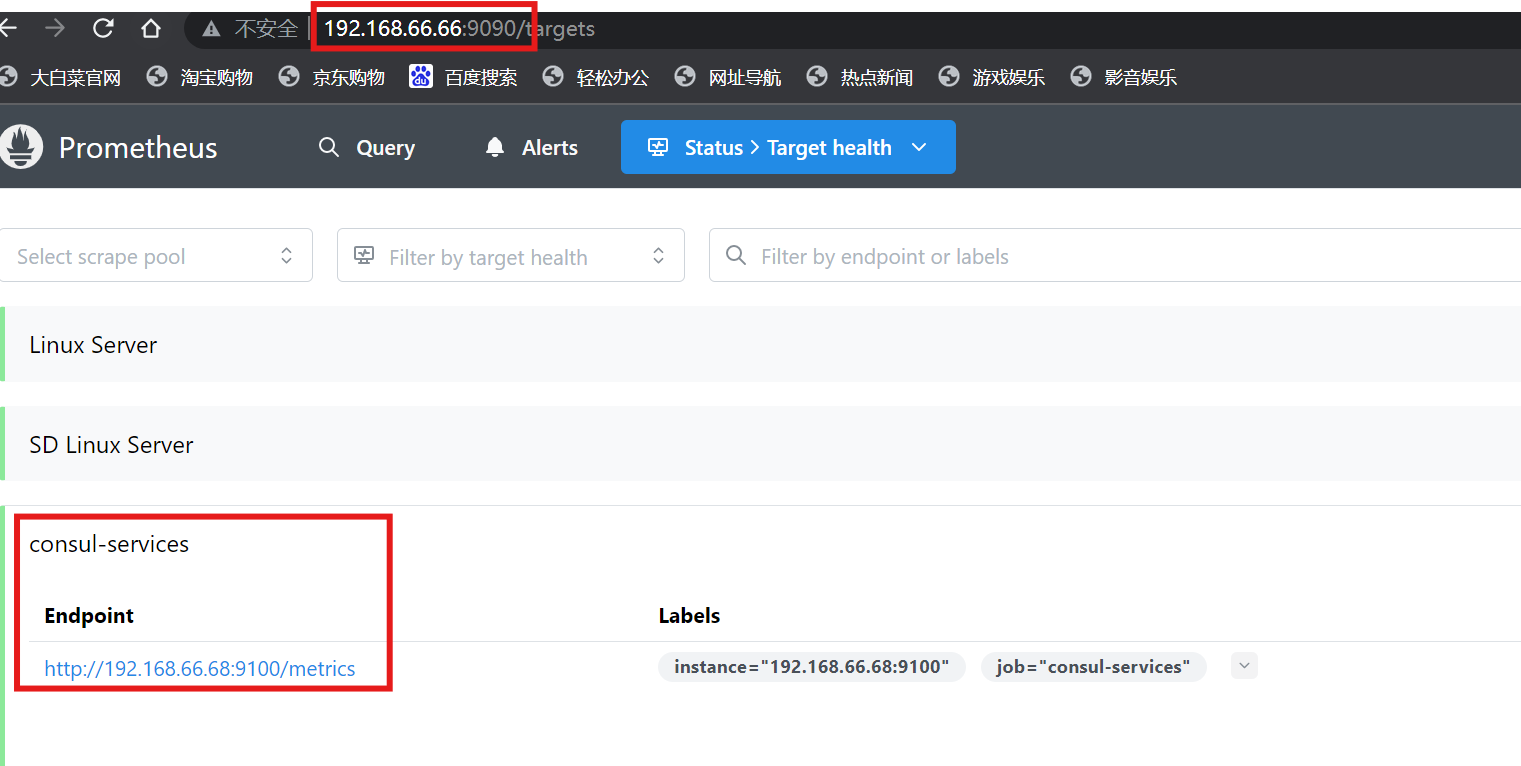
[root@localhost ~]# vi /usr/local/prometheus/prometheus.yml- job_name: 'consul-services'consul_sd_configs:- server: '192.168.66.67:8500'datacenter: 'dc1'scheme: 'http'tags:- 'node_exporter'
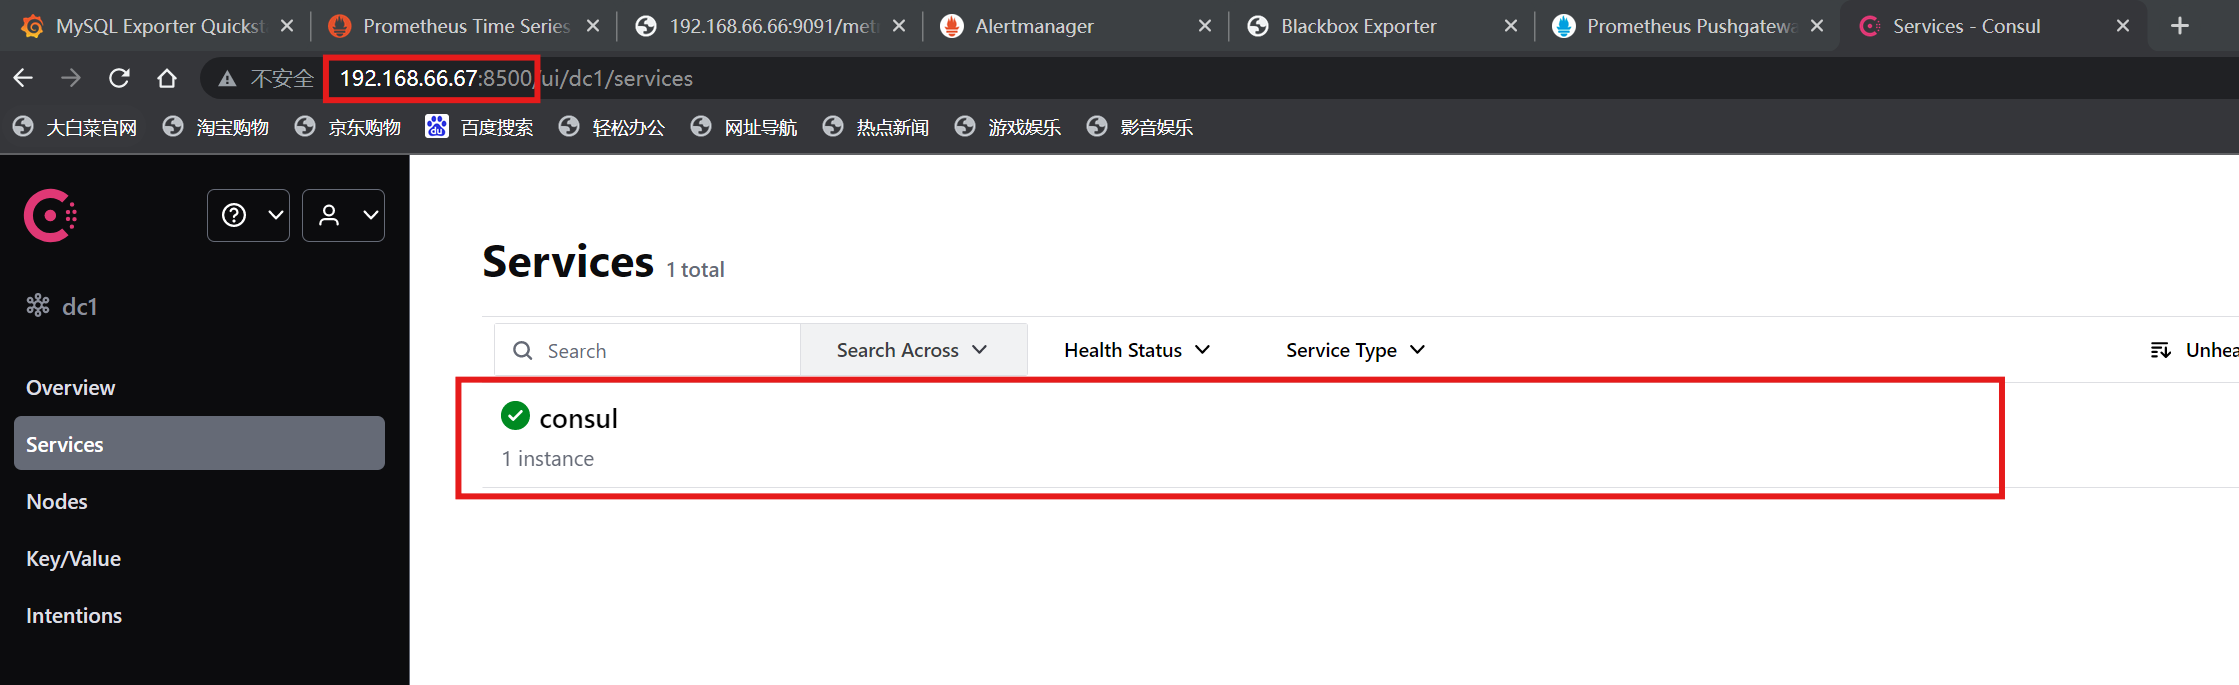
[root@localhost ~]# systemctl restart prometheus.service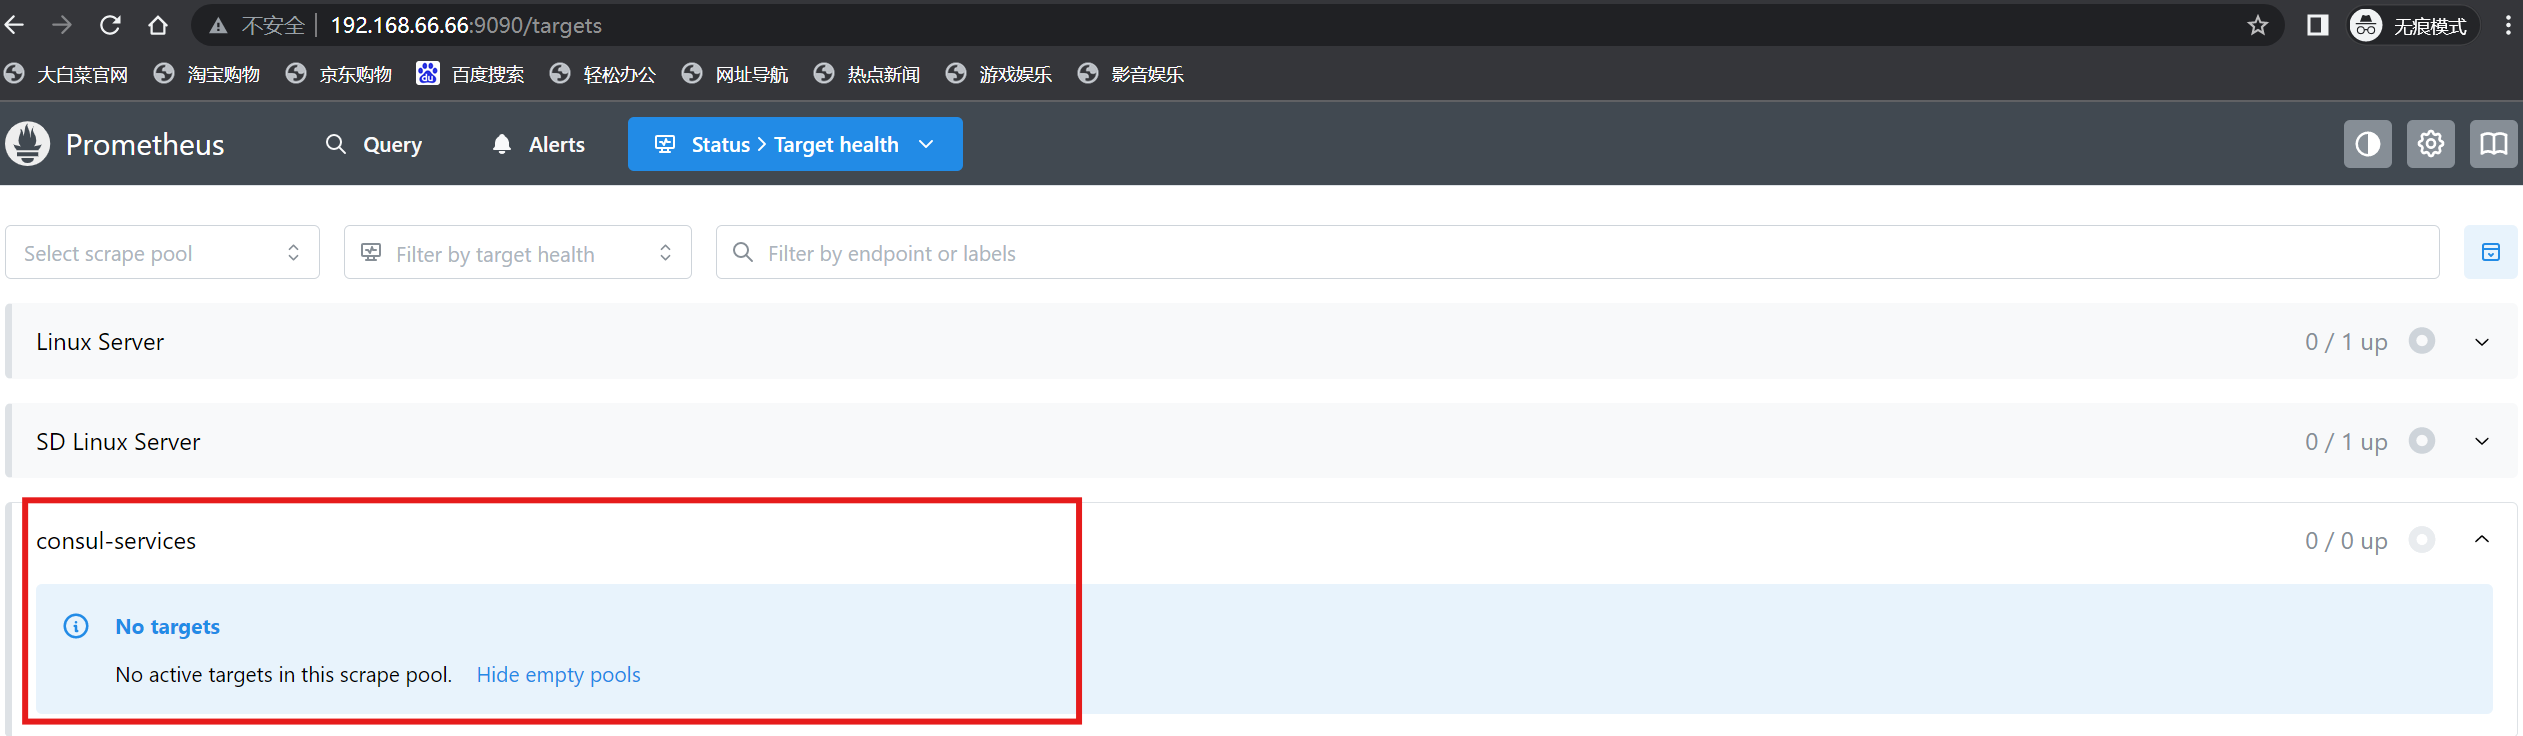
注:可以看到当前consul服务中是空的,因为还没有监控节点注册
(4)将客户端节点注册到consul服务当中
# 66.68
[root@localhost ~]# curl -X PUT -d '{"id": "test_node","name": "node-exporter","address": "192.168.66.68","port":9100,"tags": ["node_exporter"],"checks": [{"http": "http://192.168.66.68:9100/","interval": "30s"}]}' http://192.168.66.67:8500/v1/agent/service/register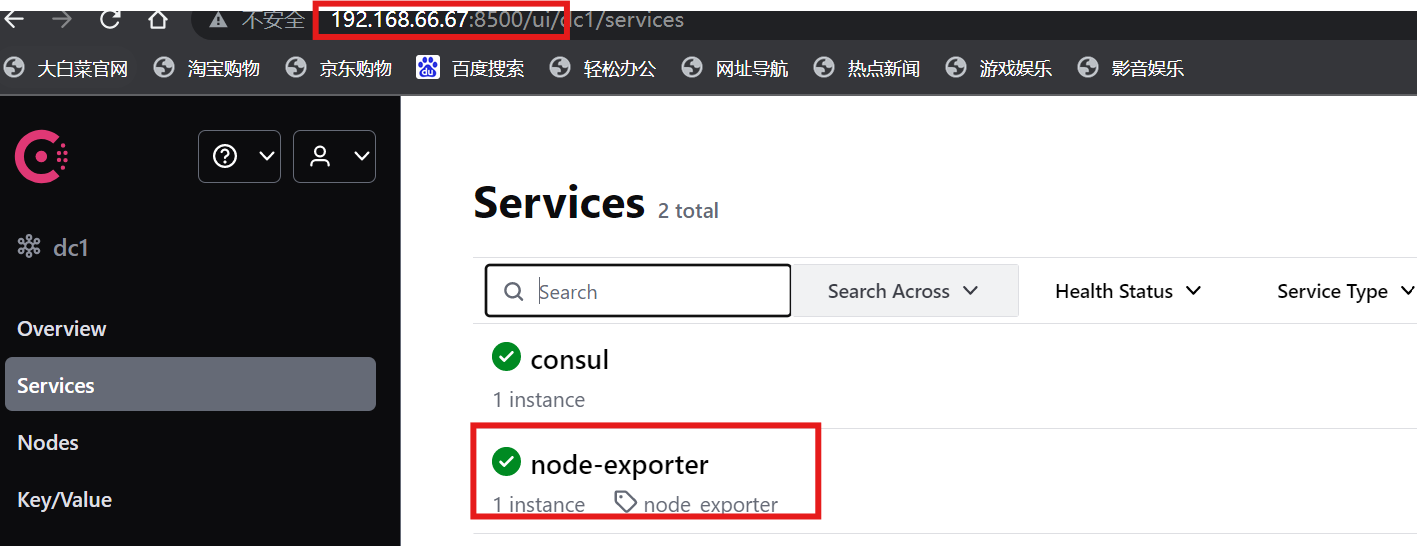
注:谁需要被监控,主动注册到consul中去就可以了;prometheus定期去找consul查询
(5)注销客户端节点
# 66.68
[root@localhost ~]# curl -X PUT http://192.168.66.67:8500/v1/agent/service/deregister/test_node
六、PromQL查询语言
1.PromQL的概念
- PromQL(Prometheus Query Language)是 Prometheus 自己开发的表达式语言,使用它可以对时序数据进行筛选和聚合
2.数据类型
- 瞬时向量 (Instant vector): 一组时序,每个时序只有一个采样值
- 区间向量 (Range vector): 一组时序,每个时序包含一段时间内的多个采样值
- 标量数据 (Scalar):
- 字符串 (String): 一个字符串,暂时未用

3.时序选择器
(1)瞬时向量选择器:瞬时向量选择器用来选择一组时序在某个采样点的采样值
# 最简单的情况就是指定一个度量指标,选择出所有属于该度量指标的时序的当前采样值。比如下面的表达式
http_requests_total 或 promhttp_metric_handler_requests_total# 可以通过在后面添加用大括号包围起来的一组标签键值对来对时序进行过滤。比如下面的表达式筛选出了 `job` 为 `prometheus`,并且 `group` 为 `canary` 的时序
http_requests_total{job="prometheus", group="canary"}# 匹配标签值时可以是等于,也可以使用正则表达式。总共有下面几种匹配操作符:
= : 完全相等
!=: 不相等
=~: 正则表达式包含匹配
!~: 正则表达式不包含不匹配# 下面的表达式筛选出了 environment 为 staging 或 testing 或 development,并且method 不是 GET 的时序:
http_requests_total{environment=~"staging|testing|development",method!="G
ET"}
# 度量指标名可以使用内部标签 `__name__` 来匹配,表达式 `http_requests_total`也可以写成 `{__name__="http_requests_total"}`。表达式`{__name__=~"job:.*"}` 匹配所有度量指标名称以 `job:` 打头的时序
{environment=~"staging|testing|development",method!="GET",__name__="http_
requests_total"}
# 这种写法效果等同于
http_requests_total{environment=~"staging|testing|development",method!="G
ET"}# 案例:cpu_load数据抓取(浏览器访问:http://192.168.88.10:9090/graph 进行查
询)
node_load15
node_load15{job="prometheus"}
node_load15{instance="192.168.88.20:9100",job="prometheus"}
(2)区间向量选择器:区间向量选择器类似于瞬时向量选择器,不同的是它选择的是过去一段时间的采样值
# 可以通过在瞬时向量选择器后面添加包含在 `[]` 里的时长来得到区间向量选择器。比如下
面的表达式选出了所有度量指标为 `http_requests_total` 且 `job` 为 `prometheus`
的时序在过去 1 或 5 分钟的采样值
node_load15{instance="192.168.88.20:9100",job="prometheus"}[1m]
node_load15{instance="192.168.88.20:9100",job="prometheus"}[5m]
# 时长的单位可以是下面几种之一
- s:seconds
- m:minutes
- h:hours
- d:days
- w:weeks
- y:years
(3)偏移修饰器:默认都是以当前时间为基准时间,偏移修饰器用来调整基准时间,使其往前偏移一段时间。偏移修饰器紧跟在选择器后面,使用 offset 来指定要偏移的量
# 比如下面的表达式选择度量名称为 `node_load15` 的所有时序在 `5` 分钟前的采样值。
node_load15{instance="192.168.88.20:9100",job="prometheus"} offset 5m
# 下面的表达式选择度量名称为 `node_load15` 的所有时序在 `1` 小时前的采样值,并列
出连续五分钟内的采样值。
node_load15{instance="192.168.88.20:9100",job="prometheus"}[5m] offset 1h
4.PromQL操作符
(1)二元操作符
# 算术类二元操作符
+:加
-:减
*:乘
/:除
%:求余
^:乘方
# 标量&向量:简单来比喻就是标量是一个数字,向量是一组数字!# 比较类二元操作符:比较类二元操作符同样可以使用在标量与标量、向量与标量,以及向量与向量之间。
默认执行的是过滤,也就是保留值
== (equal)
!= (not-equal)
> (greater-than)
< (less-than)
>= (greater-or-equal)
<= (less-or-equal)# 逻辑类二元操作符
and: 交集
or: 合(并)集
unless: 补集# 二元操作符优先级
#PromQL 的各类二元操作符运算优先级如下:
^
*, /, %
+, -
==, !=, <=, <, >=, >
and, unless
or
(2)向量匹配
# One-to-one 向量匹配:这种匹配模式下,两边向量里的元素如果其标签键值对组合相同则为匹配,
并且只会有一个匹配元素。
指定要参与匹配的标签。语法如下:
<vector expr> <bin-op> ignoring(<label list>) <vector expr>
<vector expr> <bin-op> on(<label list>) <vector expr>
比如对于下面的输入:
method_code:http_errors:rate5m{method="get", code="500"} 24
method_code:http_errors:rate5m{method="get", code="404"} 30# Many-to-one / one-to-many 向量匹配
这种匹配模式下,某一边会有多个元素跟另一边的元素匹配。这时就需要使用 `group_left`
或 `group_right` 组修饰符来指明哪边匹配元素较多,左边多则用 `group_left`,右边
多则用 `group_right`。其语法如下:
<vector expr> <bin-op> ignoring(<label list>) group_left(<label list>)
<vector expr>
<vector expr> <bin-op> ignoring(<label list>) group_right(<label list>)
<vector expr>
<vector expr> <bin-op> on(<label list>) group_left(<label list>) <vector
expr>
<vector expr> <bin-op> on(<label list>) group_right(<label list>) <vector
expr>
(3)聚合操作符
注:PromQL 的聚合操作符用来将向量里的元素聚合得更少。总共有下面这些聚合操作符:
sum:求和
min:最小值
max:最大值
avg:平均值
stddev:标准差
stdvar:方差
count:元素个数
count_values:等于某值的元素个数
bottomk:最小的 k 个元素
topk:最大的 k 个元素
quantile:分位数
5.PromQL函数
注:Prometheus 内置了一些函数来辅助计算
abs():绝对值
sqrt():平方根
exp():指数计算
ln():自然对数
ceil():向上取整
floor():向下取整
round():四舍五入取整
delta():计算区间向量里每一个时序第一个和最后一个的差值
sort():排序