python的scikit-image库的功能介绍(亲测)
scikit-image库与numpy、scipy、Matplotlib形成一个分析闭合!
如何导入库:
pip install scikit-image -i https://mirrors.aliyun.com/pypi/simple/
主要功能模块:
模块 主要功能 skimage.io图像读取和保存 skimage.color颜色空间转换 skimage.transform几何变换、缩放、旋转 skimage.filters各种滤波器和边缘检测 skimage.morphology形态学操作 skimage.feature特征检测和提取 skimage.segmentation图像分割算法 skimage.measure图像测量和分析 skimage.exposure图像对比度和直方图处理 skimage.restoration图像去噪和修复 skimage.util实用工具函数
对功能分别测试:
1、基本图像操作
报错:
from ipykernel.comm import Comm
ModuleNotFoundError: No module named 'ipykernel'
解决办法:
import matplotlib
matplotlib.use('TkAgg')
import matplotlib.pyplot as plt
import skimage
from skimage import io, color, exposure
import matplotlib
matplotlib.use('TkAgg')
import matplotlib.pyplot as plt
import numpy as np
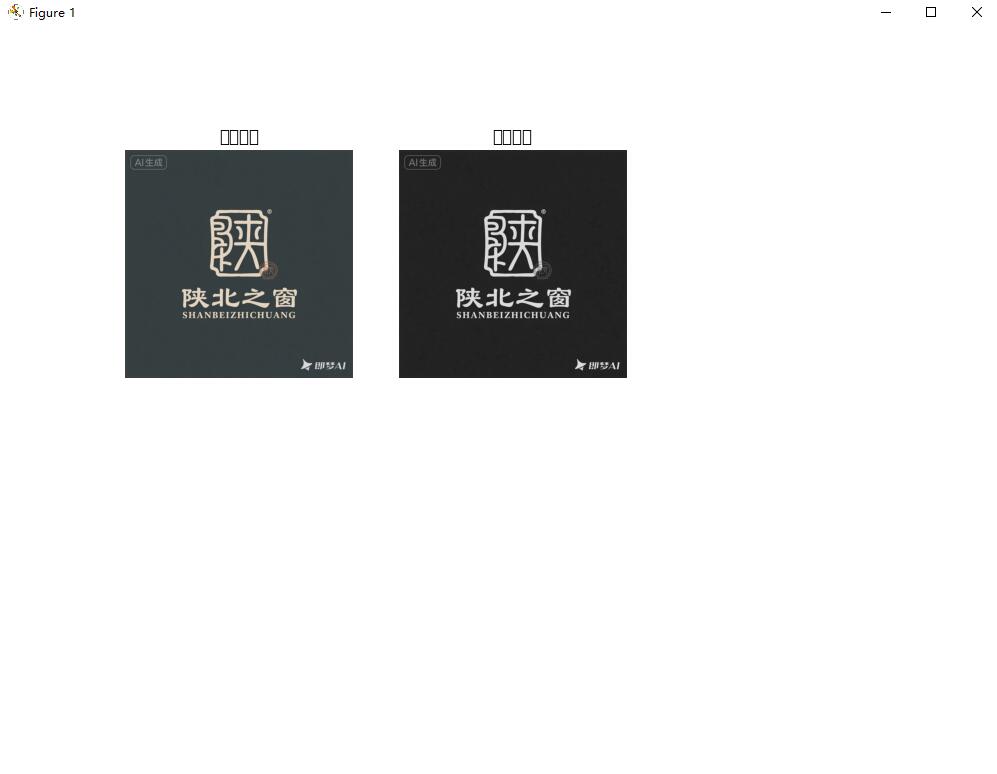
def demo01():# 读取和显示图像image = io.imread(r"E:\开发工具\pythonProject\MOEExpert\folderImage\123.png") # 读取图像print(f"图像形状: {image.shape}") # (高度, 宽度, 通道)print(f"数据类型: {image.dtype}") # uint8# 显示图像plt.figure(figsize=(10, 8))plt.subplot(2, 3, 1)plt.imshow(image)plt.title('原始图像')plt.axis('off')# 转换为灰度图gray_image = color.rgb2gray(image)plt.subplot(2, 3, 2)plt.imshow(gray_image, cmap='gray')plt.title('灰度图像')plt.axis('off')plt.show()if __name__ == "__main__":demo01()效果:
2、颜色空间转换
from skimage import transform, filters
def test02():image = io.imread(r"E:\开发工具\pythonProject\MOEExpert\folderImage\123.png")  # 读取图像# 1. 调整大小resized = transform.resize(image, (200, 300))  # 调整到 200x300# 2. 旋转rotated = transform.rotate(image, 45)  # 旋转45度# 3. 颜色空间转换hsv_image = color.rgb2hsv(image)  # RGB -> HSVlab_image = color.rgb2lab(image)  # RGB -> Labyuv_image = color.rgb2yuv(image)  # RGB -> YUV# 显示变换结果plt.subplot(2, 3, 3)plt.imshow(rotated)plt.title('旋转45度')plt.axis('off')plt.show()if __name__ == "__main__":test02()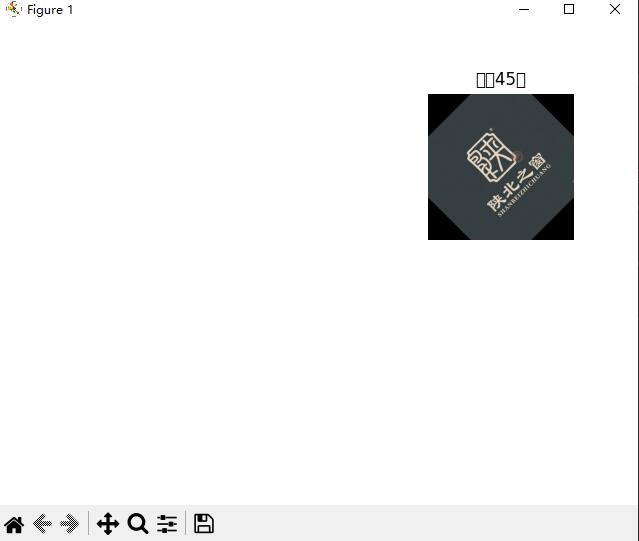
3、图像滤波和图像增强
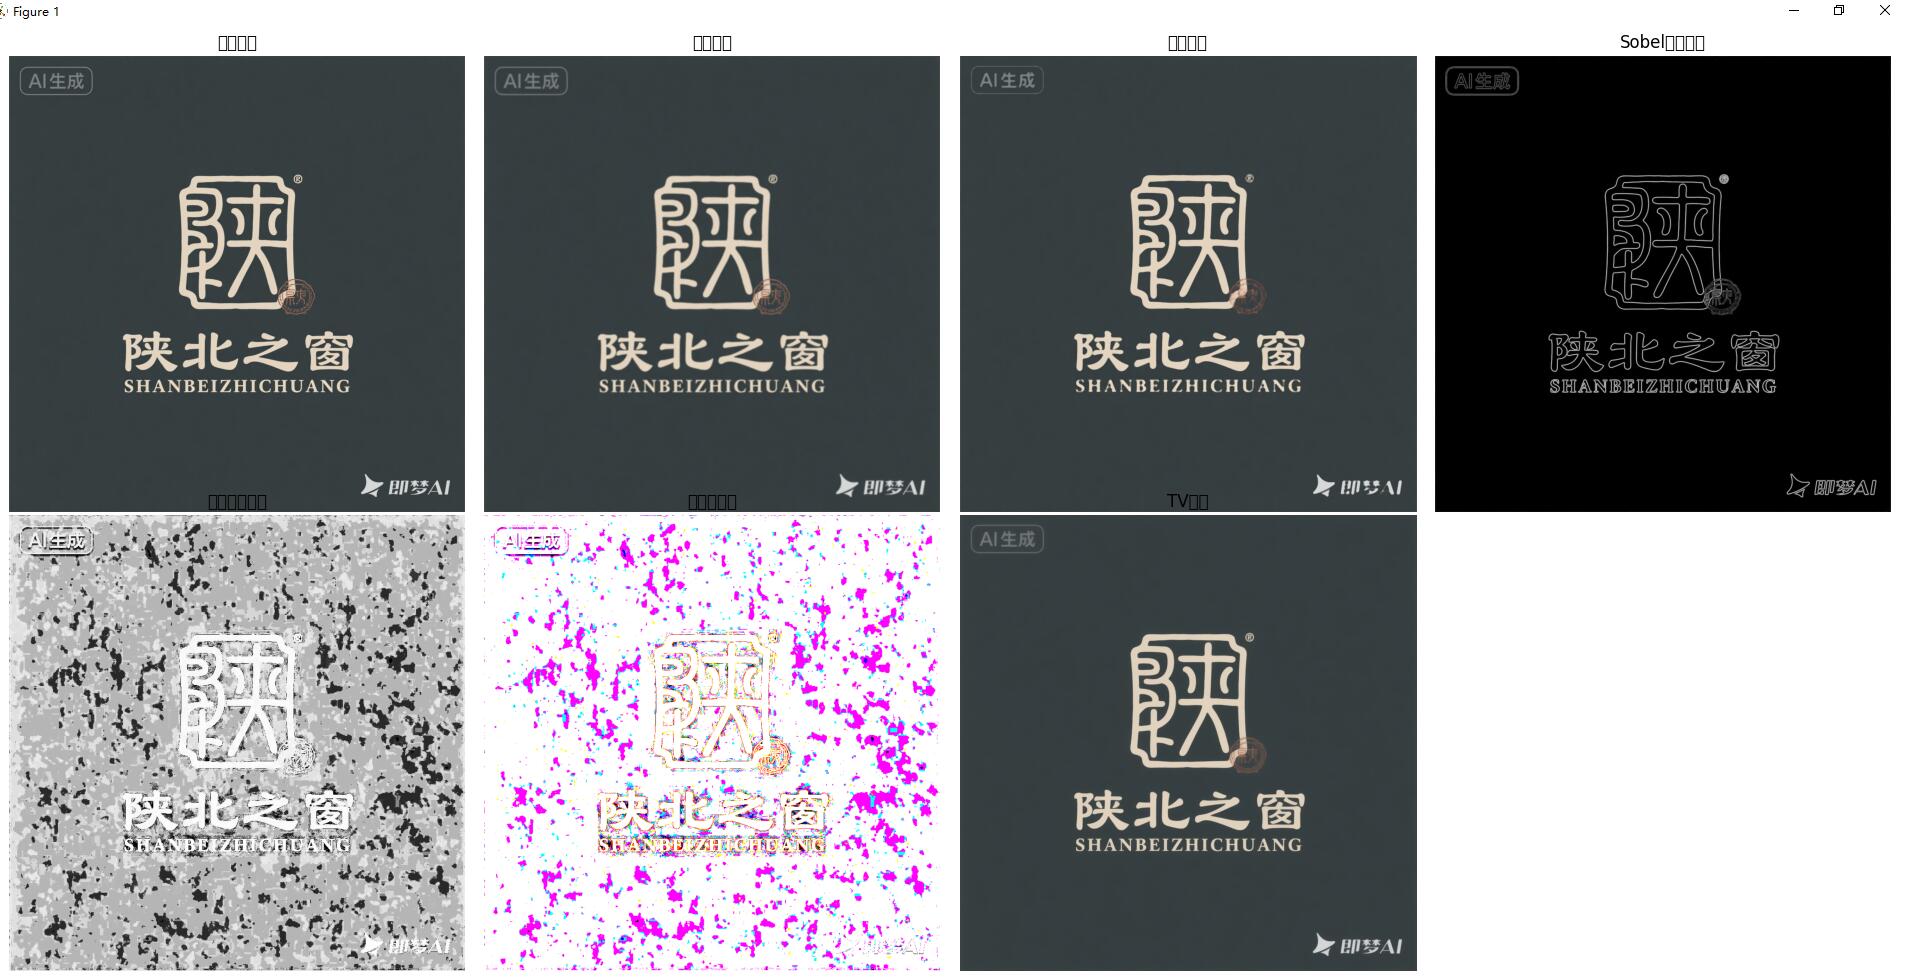
def test03():from skimage import filters, exposure, restoration, ioimport matplotlib.pyplot as pltimport numpy as npimage = io.imread(r"E:\开发工具\pythonProject\MOEExpert\folderImage\123.png") # 读取图像# 创建图形窗口plt.figure(figsize=(15, 10))# 原始图像plt.subplot(2, 4, 1)plt.imshow(image)plt.title('原始图像')plt.axis('off')# 1. 高斯滤波gaussian_filtered = filters.gaussian(image, sigma=1, channel_axis=-1)plt.subplot(2, 4, 2)plt.imshow(gaussian_filtered)plt.title('高斯滤波')plt.axis('off')# 2. 中值滤波 - 修复版本:分别处理每个通道if len(image.shape) == 3: # 彩色图像median_filtered = np.zeros_like(image)for channel in range(image.shape[2]):median_filtered[:, :, channel] = filters.median(image[:, :, channel], disk(3))else: # 灰度图像median_filtered = filters.median(image, disk(3))plt.subplot(2, 4, 3)plt.imshow(median_filtered)plt.title('中值滤波')plt.axis('off')# 3. Sobel边缘检测 - 需要在灰度图像上进行if len(image.shape) == 3:gray_image = color.rgb2gray(image)else:gray_image = imageedges = filters.sobel(gray_image)plt.subplot(2, 4, 4)plt.imshow(edges, cmap='gray')plt.title('Sobel边缘检测')plt.axis('off')# 4. 直方图均衡化 - 需要在灰度图像上进行if len(image.shape) == 3:equalized = exposure.equalize_hist(gray_image)else:equalized = exposure.equalize_hist(image)plt.subplot(2, 4, 5)plt.imshow(equalized, cmap='gray')plt.title('直方图均衡化')plt.axis('off')# 5. 对比度拉伸if len(image.shape) == 3:# 对每个通道分别进行对比度拉伸contrast_stretched = np.zeros_like(image, dtype=np.float64)for channel in range(image.shape[2]):p2, p98 = np.percentile(image[:, :, channel], (2, 98))contrast_stretched[:, :, channel] = exposure.rescale_intensity(image[:, :, channel], in_range=(p2, p98))else:p2, p98 = np.percentile(image, (2, 98))contrast_stretched = exposure.rescale_intensity(image, in_range=(p2, p98))plt.subplot(2, 4, 6)plt.imshow(contrast_stretched)plt.title('对比度拉伸')plt.axis('off')# 6. 去噪denoised = restoration.denoise_tv_chambolle(image, weight=0.1, channel_axis=-1)plt.subplot(2, 4, 7)plt.imshow(denoised)plt.title('TV去噪')plt.axis('off')plt.tight_layout()plt.show()if __name__ == "__main__":test03()效果:
4、形态学测试
形态学解释:
图像处理中的数学形态学
这是一个相对现代的领域,主要用于数字图像处理和计算机视觉。
它提供了一系列基于集合论、格论和拓扑学的工具,用来分析和处理图像的几何结构。
核心操作:使用一个叫做“结构元素”的小模板在图像上移动,进行探测。
腐蚀:使图像中明亮的区域缩小,可以用来消除小点或毛刺。
膨胀:使图像中明亮的区域扩大,可以用来连接相邻的物体或填补空洞。
开运算:先腐蚀后膨胀,用于消除小物体、平滑边界,同时不明显改变面积。
闭运算:先膨胀后腐蚀,用于填充小洞、连接邻近物体,同时不明显改变面积。
应用:图像去噪、边界检测、骨架提取、物体分割等。
数学形态学关心的是图像中物体的“形状和结构”,并对其进行操作和优化。
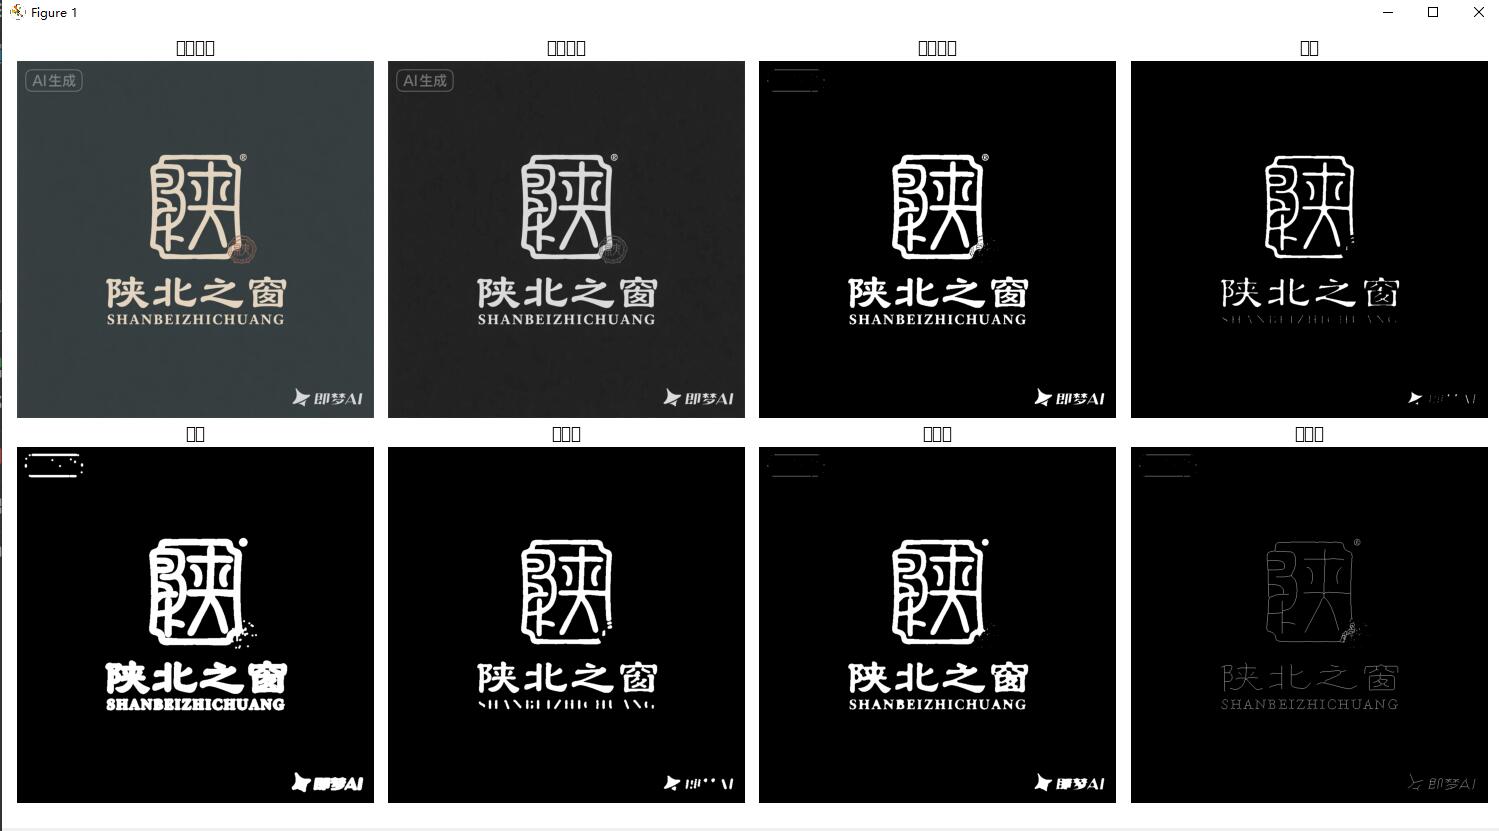
def test04():from skimage import morphology, io, colorfrom skimage.morphology import erosion, dilation, opening, closing, diskimport matplotlib.pyplot as pltimport numpy as np# 读取图像image = io.imread(r"E:\开发工具\pythonProject\MOEExpert\folderImage\123.png")# 转换为灰度图像if len(image.shape) == 3:gray_image = color.rgb2gray(image)else:gray_image = image# 创建二值图像用于演示# 使用Otsu阈值法自动确定最佳阈值from skimage.filters import threshold_otsuthresh = threshold_otsu(gray_image)binary_image = gray_image > thresh# 结构元素selem = disk(3)# 1. 腐蚀和膨胀eroded = erosion(binary_image, selem)dilated = dilation(binary_image, selem)# 2. 开运算和闭运算opened = opening(binary_image, selem)closed = closing(binary_image, selem)# 3. 骨架化skeleton = morphology.skeletonize(binary_image)# 显示形态学操作结果fig, axes = plt.subplots(2, 4, figsize=(15, 8))# 原始图像和灰度图像axes[0, 0].imshow(image)axes[0, 0].set_title('原始图像')axes[0, 0].axis('off')axes[0, 1].imshow(gray_image, cmap='gray')axes[0, 1].set_title('灰度图像')axes[0, 1].axis('off')# 二值图像和形态学操作结果titles = ['二值图像', '腐蚀', '膨胀', '开运算', '闭运算', '骨架化']images = [binary_image, eroded, dilated, opened, closed, skeleton]for i, (ax, img, title) in enumerate(zip(axes.flat[2:], images, titles)):ax.imshow(img, cmap='gray')ax.set_title(title)ax.axis('off')plt.tight_layout()plt.show()if __name__ == "__main__":test04()效果:
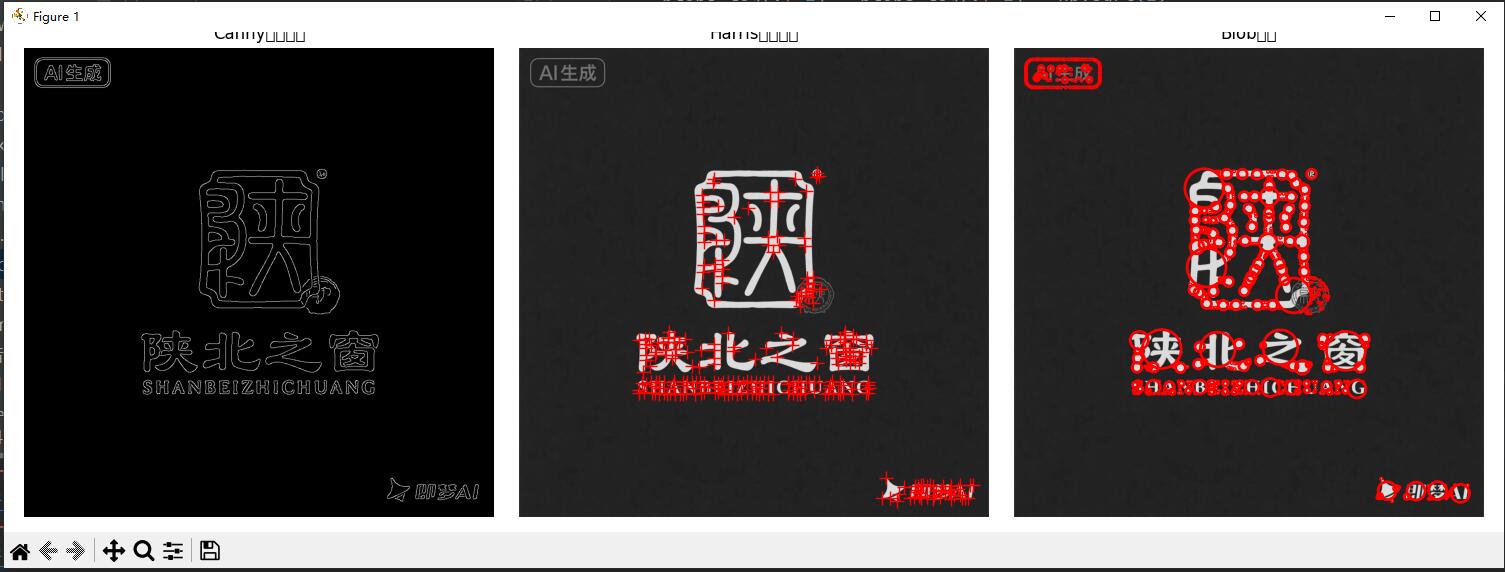
五、特征检测
def test05():from skimage import feature, measure, color, ioimport matplotlib.pyplot as pltimport numpy as np# 读取图像image = io.imread(r"E:\开发工具\pythonProject\MOEExpert\folderImage\123.png")# 检查图像维度并转换为灰度图print(f"图像维度: {image.shape}")print(f"图像数据类型: {image.dtype}")# 如果图像是彩色的(3维),转换为灰度图if len(image.shape) == 3:gray_image = color.rgb2gray(image)else:gray_image = imageprint(f"转换后维度: {gray_image.shape}")# 确保图像是二维的if len(gray_image.shape) != 2:raise ValueError("图像无法转换为二维灰度图")# 1. Canny边缘检测canny_edges = feature.canny(gray_image, sigma=2)# 2. Harris角点检测from skimage.feature import corner_harris, corner_peakscoords = corner_peaks(corner_harris(gray_image), min_distance=5, threshold_rel=0.02)# 3. ORB特征检测from skimage.feature import ORBorb = ORB(n_keypoints=100)orb.detect_and_extract(gray_image)keypoints = orb.keypointsdescriptors = orb.descriptors# 4. Blob检测from skimage.feature import blob_logblobs_log = blob_log(gray_image, max_sigma=30, num_sigma=10, threshold=.1)# 计算blob的半径(对于LOG检测器)blobs_log[:, 2] = blobs_log[:, 2] * np.sqrt(2)# 显示特征检测结果plt.figure(figsize=(15, 5))plt.subplot(1, 3, 1)plt.imshow(canny_edges, cmap='gray')plt.title('Canny边缘检测')plt.axis('off')plt.subplot(1, 3, 2)plt.imshow(gray_image, cmap='gray')plt.plot(coords[:, 1], coords[:, 0], 'r+', markersize=10)plt.title('Harris角点检测')plt.axis('off')plt.subplot(1, 3, 3)plt.imshow(gray_image, cmap='gray')for blob in blobs_log:y, x, r = blobc = plt.Circle((x, y), r, color='red', linewidth=2, fill=False)plt.gca().add_patch(c)plt.title('Blob检测')plt.axis('off')plt.tight_layout()plt.show()if __name__ == "__main__":test05()效果:
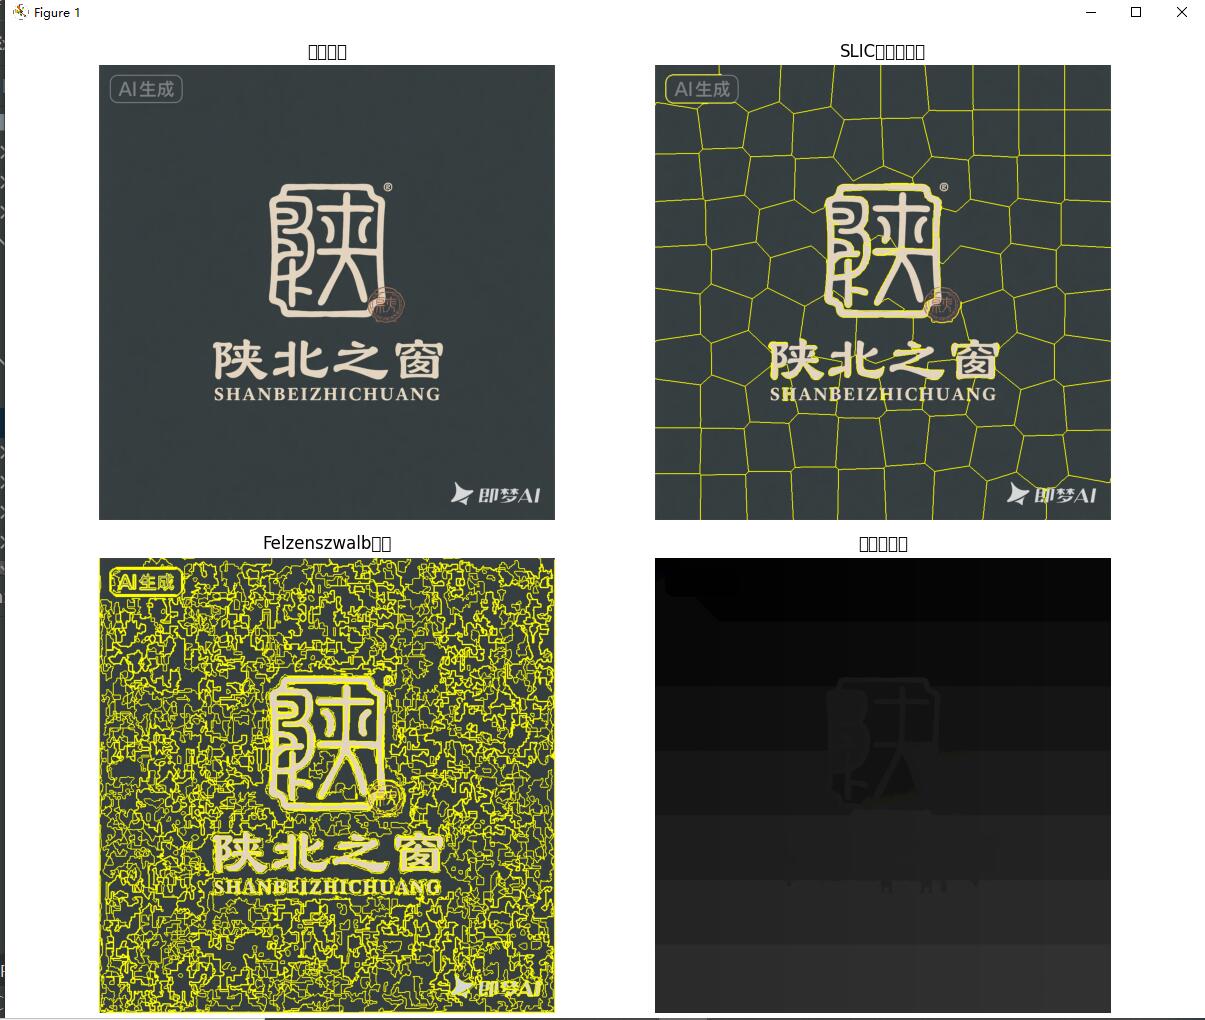
六:图像分割
def test06():from skimage import segmentationfrom skimage.graph import route_through_arrayfrom skimage.segmentation import slic, felzenszwalbimage = io.imread(r"E:\开发工具\pythonProject\MOEExpert\folderImage\123.png")# 1. SLIC超像素分割segments_slic = slic(image, n_segments=100, compactness=10, sigma=1)# 2. Felzenszwalb分割segments_fz = felzenszwalb(image, scale=100, sigma=0.5, min_size=50)# 3. 分水岭算法from skimage.segmentation import watershedfrom scipy import ndimage as ndi# 使用梯度作为分水岭输入gradient = filters.sobel(image)segments_watershed = watershed(gradient, markers=50, compactness=0.001)# 显示分割结果fig, axes = plt.subplots(2, 2, figsize=(12, 10))axes[0, 0].imshow(image)axes[0, 0].set_title('原始图像')axes[0, 0].axis('off')axes[0, 1].imshow(segmentation.mark_boundaries(image, segments_slic))axes[0, 1].set_title('SLIC超像素分割')axes[0, 1].axis('off')axes[1, 0].imshow(segmentation.mark_boundaries(image, segments_fz))axes[1, 0].set_title('Felzenszwalb分割')axes[1, 0].axis('off')axes[1, 1].imshow(segments_watershed, cmap='nipy_spectral')axes[1, 1].set_title('分水岭分割')axes[1, 1].axis('off')plt.tight_layout()plt.show()if __name__ == "__main__":test06()效果图:
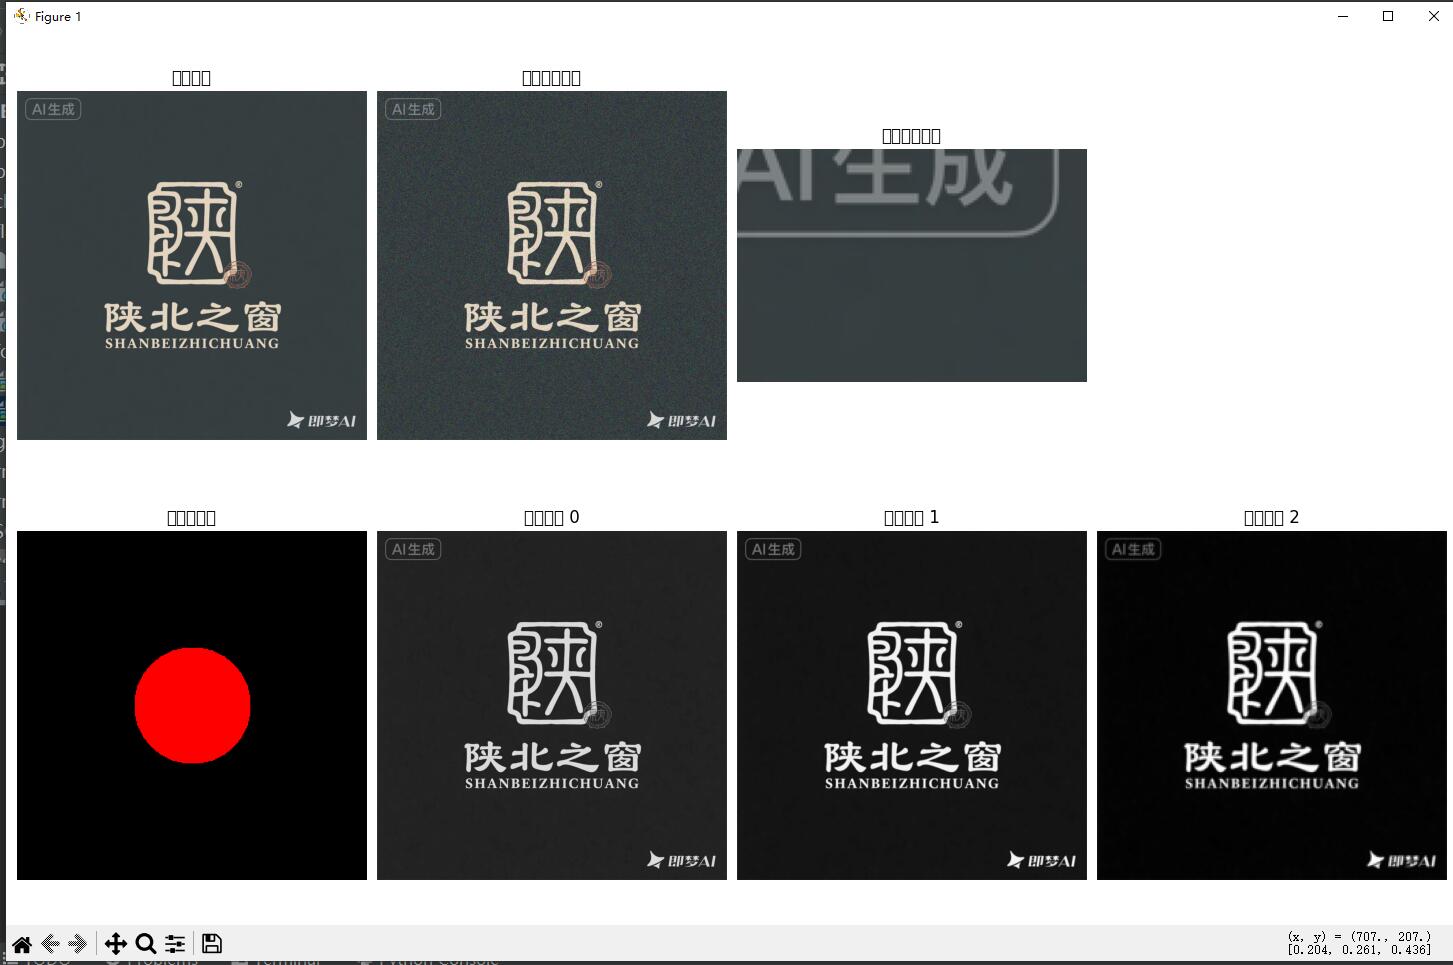
7、实用工具函数
def test07():from skimage import util, draw, io, colorimport matplotlib.pyplot as pltimport numpy as np# 首先读取图像try:# 读取图像文件image_path = r"E:\开发工具\pythonProject\MOEExpert\folderImage\123.png"image = io.imread(image_path)# 确保图像是合适的格式if len(image.shape) == 3:# 如果是彩色图像,可以选择转换为灰度或保持彩色# 这里我们保持彩色用于显示,但某些操作可能需要灰度passprint(f"图像形状: {image.shape}")print(f"图像数据类型: {image.dtype}")except Exception as e:print(f"读取图像失败: {e}")return# 1. 数据类型转换image_float = util.img_as_float(image)  # 转换为float [0, 1]image_uint = util.img_as_uint(image_float)  # 转换为uint16# 2. 添加噪声noisy = util.random_noise(image, mode='gaussian', var=0.01)# 3. 裁剪和填充from skimage.transform import resize, rescale# 确保裁剪范围在图像尺寸内height, width = image.shape[0], image.shape[1]start_row, end_row = max(0, 50), min(height, 150)start_col, end_col = max(0, 50), min(width, 200)cropped = image[start_row:end_row, start_col:end_col]  # 裁剪# 4. 绘制几何形状canvas = np.zeros((300, 300, 3), dtype=np.uint8)rr, cc = draw.disk((150, 150), 50)  # 绘制圆形canvas[rr, cc] = [255, 0, 0]# 5. 图像金字塔from skimage.transform import pyramid_gaussian# 对于彩色图像,需要处理多通道if len(image.shape) == 3:# 使用灰度图像进行金字塔操作,或者分别处理每个通道gray_image = color.rgb2gray(image)pyramid = tuple(pyramid_gaussian(gray_image, downscale=2, max_layer=3))else:pyramid = tuple(pyramid_gaussian(image, downscale=2, max_layer=3))# 显示各种处理结果# 创建更大的图形,使用2行4列的子图布局fig, axes = plt.subplots(2, 4, figsize=(20, 10))# 第一行:原始图像、噪声图像、裁剪图像、空axes[0, 0].imshow(image)axes[0, 0].set_title('原始图像')axes[0, 0].axis('off')axes[0, 1].imshow(noisy)axes[0, 1].set_title('添加高斯噪声')axes[0, 1].axis('off')axes[0, 2].imshow(cropped)axes[0, 2].set_title('裁剪后的图像')axes[0, 2].axis('off')# 第一行最后一个子图留空axes[0, 3].axis('off')# 第二行:绘制的几何形状和金字塔图层axes[1, 0].imshow(canvas)axes[1, 0].set_title('绘制的圆形')axes[1, 0].axis('off')# 金字塔图层for i, layer in enumerate(pyramid):if i < 3:  # 只显示前3层axes[1, i + 1].imshow(layer, cmap='gray')axes[1, i + 1].set_title(f'金字塔层 {i}')axes[1, i + 1].axis('off')plt.tight_layout()plt.show()# 返回处理后的图像供后续使用(如果需要)return {'original': image,'float': image_float,'uint': image_uint,'noisy': noisy,'cropped': cropped,'canvas': canvas,'pyramid': pyramid}
if __name__ == "__main__":test07()
效果:
练习一:简单的图像处理流水线
def image_processing_pipeline(image_path):from skimage import feature, util"""图像处理流水线示例"""# 1. 读取图像img = io.imread(image_path)# 2. 转换为灰度图gray = color.rgb2gray(img)# 3. 去噪denoised = restoration.denoise_tv_chambolle(gray, weight=0.1)# 4. 增强对比度enhanced = exposure.equalize_adapthist(denoised)# 5. 边缘检测edges = feature.canny(enhanced, sigma=2)# 6. 显示结果fig, axes = plt.subplots(2, 3, figsize=(15, 10))images = [img, gray, denoised, enhanced, edges, edges]titles = ['原始', '灰度', '去噪', '对比度增强', '边缘检测', '最终结果']for i, (ax, img, title) in enumerate(zip(axes.flat, images, titles)):if i == 5:  # 在最终结果上叠加边缘ax.imshow(img, cmap='gray')ax.imshow(edges, cmap='hot', alpha=0.5)else:if len(img.shape) == 3:ax.imshow(img)else:ax.imshow(img, cmap='gray')ax.set_title(title)ax.axis('off')plt.tight_layout()plt.show()return edges
if __name__ == "__main__":image_processing_pipeline(r"E:\开发工具\pythonProject\MOEExpert\folderImage\123.png")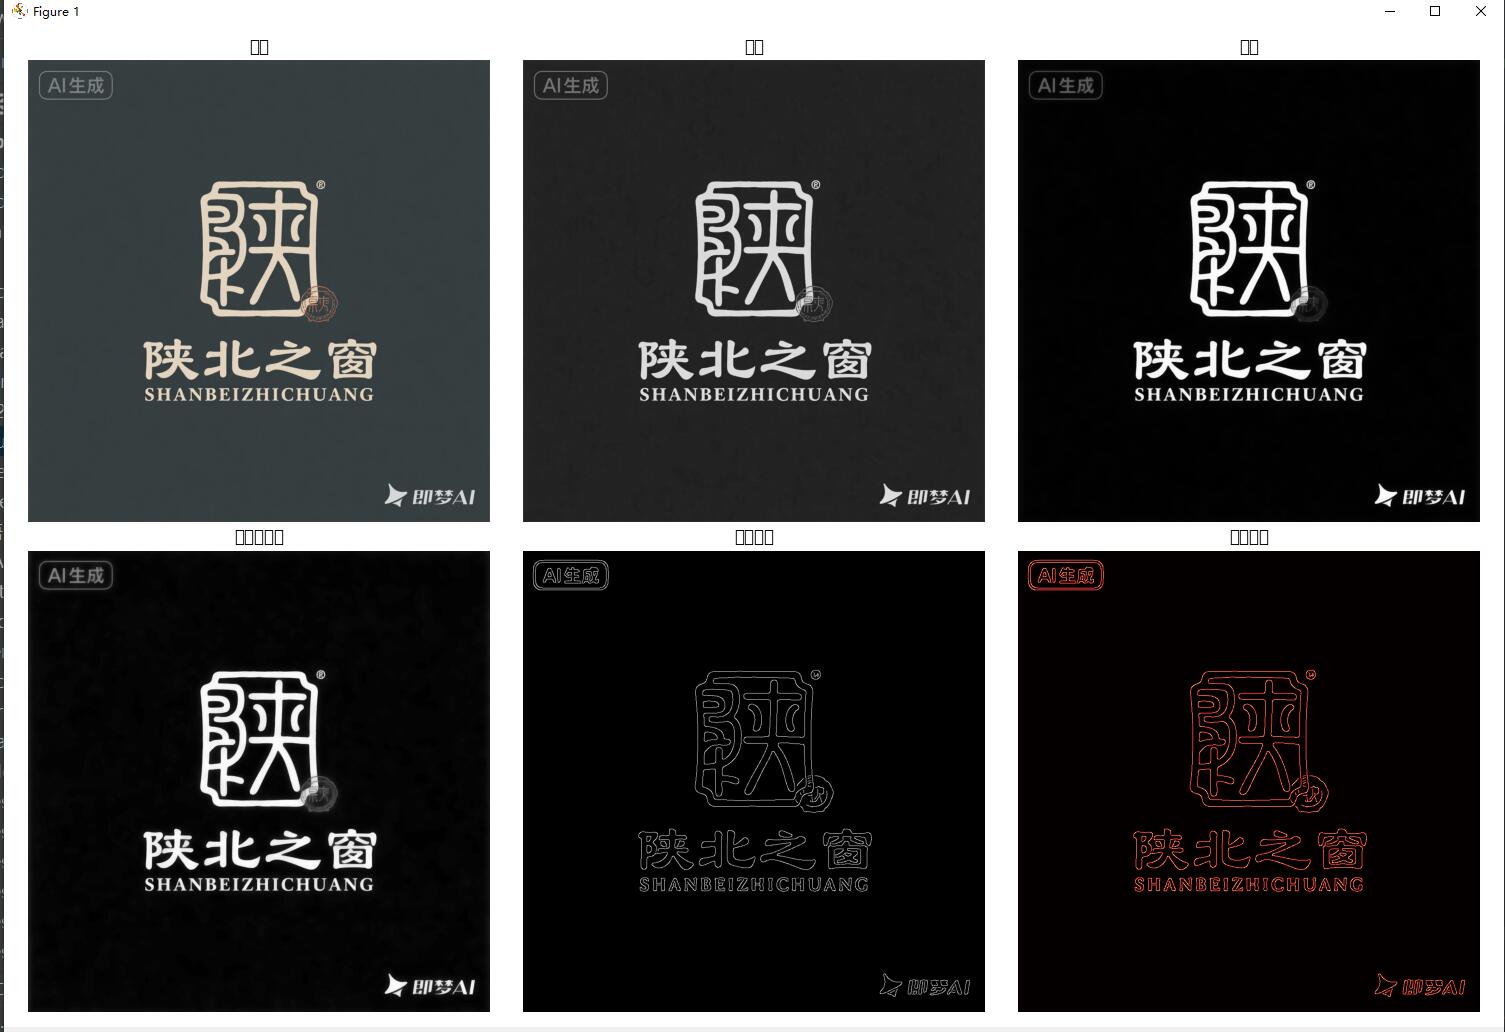
练习二:物体测量与分析
from skimage import io, color, filters, measure
import matplotlib.pyplot as plt
import numpy as npdef measure_objects(image_path):"""测量图像中的物体"""# 读取并预处理image = io.imread(image_path)gray = color.rgb2gray(image)# 二值化threshold = filters.threshold_otsu(gray)binary = gray > threshold# 标签连通区域label_image = measure.label(binary)# 测量区域属性regions = measure.regionprops(label_image)# 显示结果fig, (ax1, ax2) = plt.subplots(1, 2, figsize=(12, 6))ax1.imshow(image)ax1.set_title('原始图像')ax1.axis('off')ax2.imshow(binary, cmap='gray')ax2.set_title('检测到的物体')# 在图像上标注物体for region in regions:# 绘制边界框minr, minc, maxr, maxc = region.bboxrect = plt.Rectangle((minc, minr), maxc - minc, maxr - minr,fill=False, edgecolor='red', linewidth=2)ax2.add_patch(rect)# 显示面积ax2.text(minc, minr, f'A:{region.area}', color='red', fontsize=8)ax2.axis('off')plt.tight_layout()plt.show()# 打印测量结果for i, region in enumerate(regions):print(f"物体 {i+1}: 面积={region.area}, 周长={region.perimeter:.2f}")return regions
效果图: