Prometheus监控部署
一、Prometheus简介
1.什么是Prometheus?
- Prometheus 是一个开源的报警系统和监控工具包,使用Go语言开发,是Google BorgMon监控系统的开源版本。
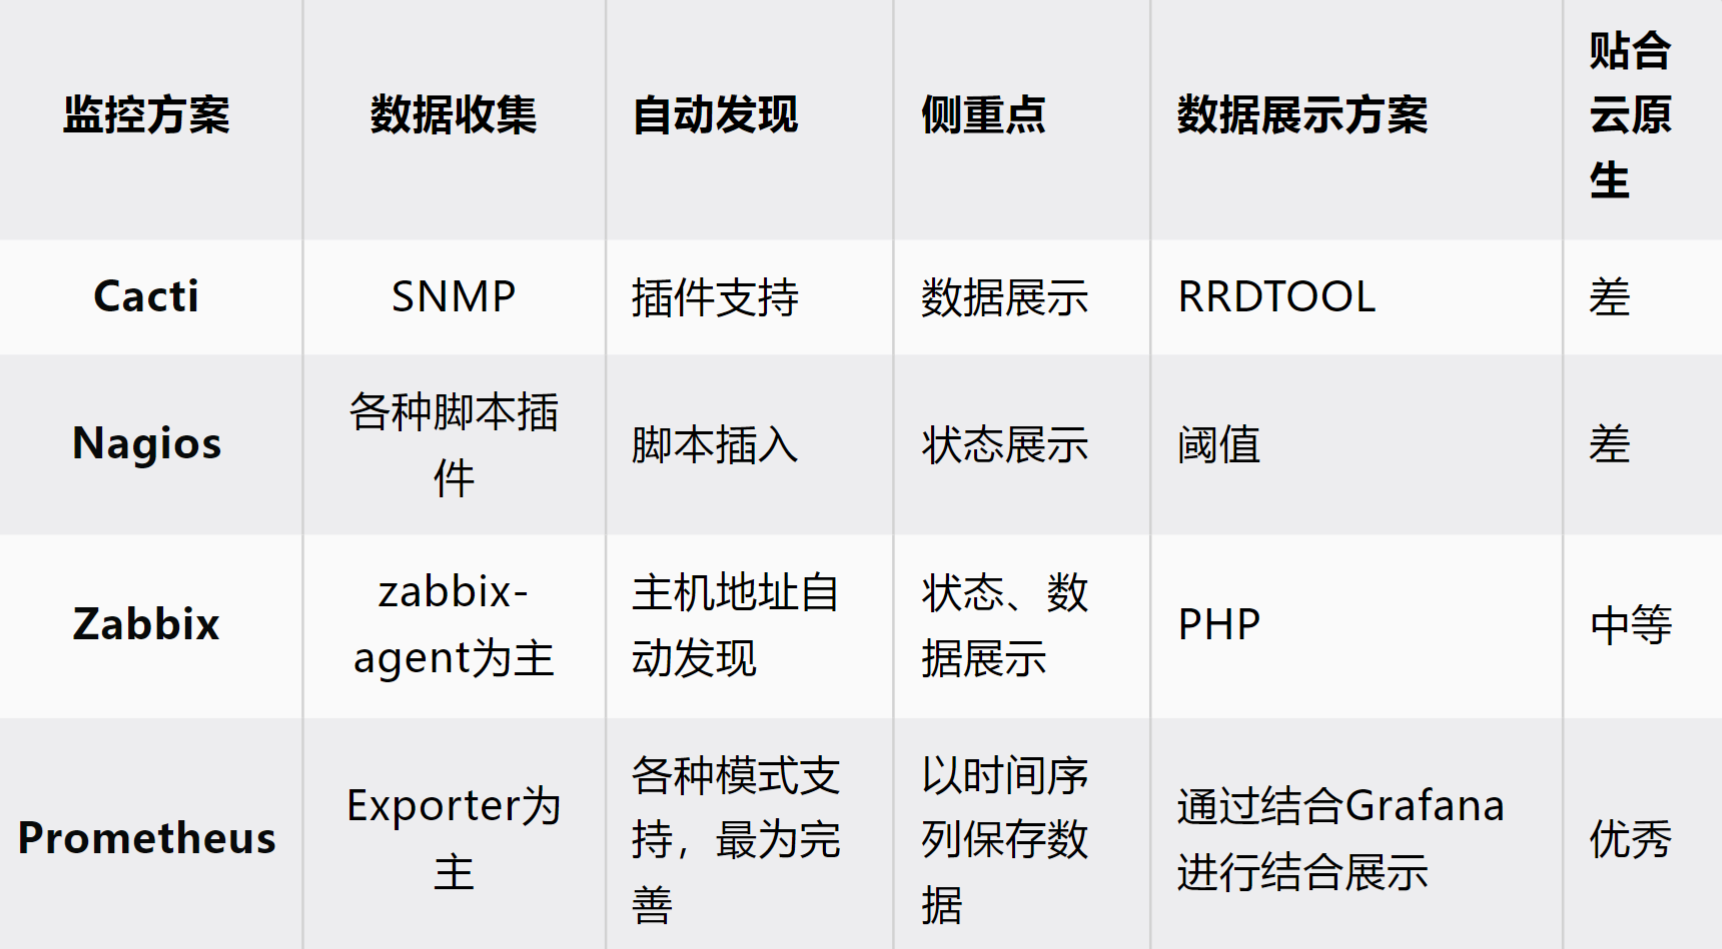
2.各监控系统的对比
3.Prometheus的特性
- 由 metric 名称和 K/V 键值对标识的时间序列的多维数据模型
- 简单的查询语言 PromQL(TSDB数据库的查询语言)
- 不依赖分布式存储,单个服务节点自动治理
- 通过 http 的 pull 模型获取数据的时序集合
- 支持通过网关 push 时序数据
- 通过服务发现或者静态配置发现目标
- 支持多种图表和仪表盘模式
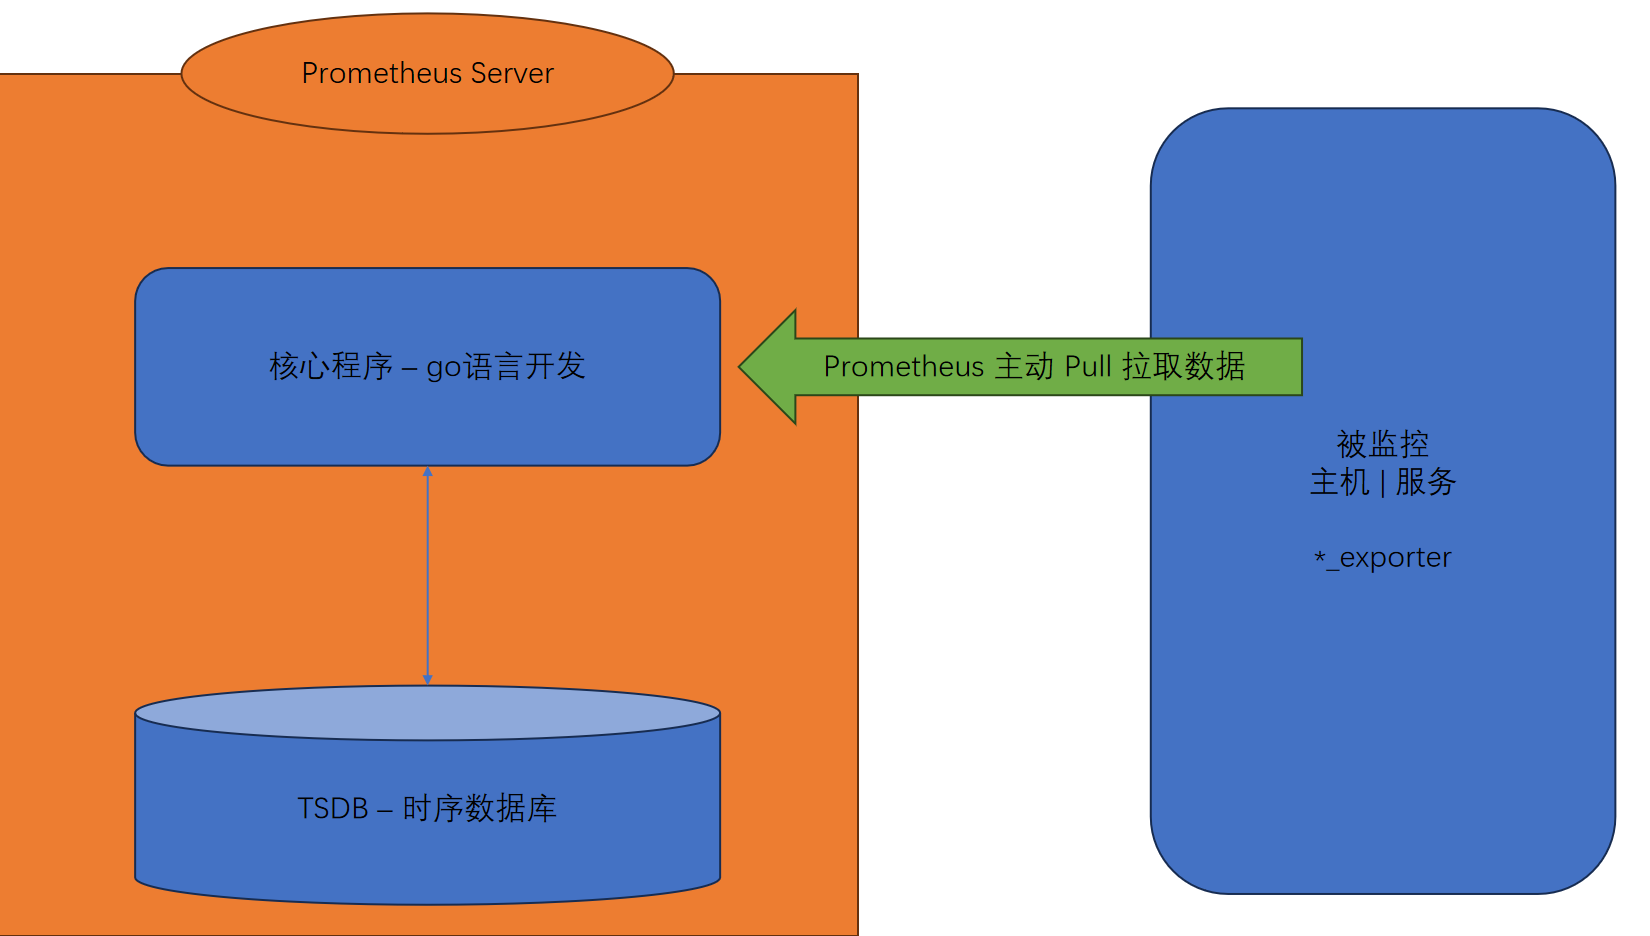
4.Prometheus的架构图和组件
二、Prometheus server部署
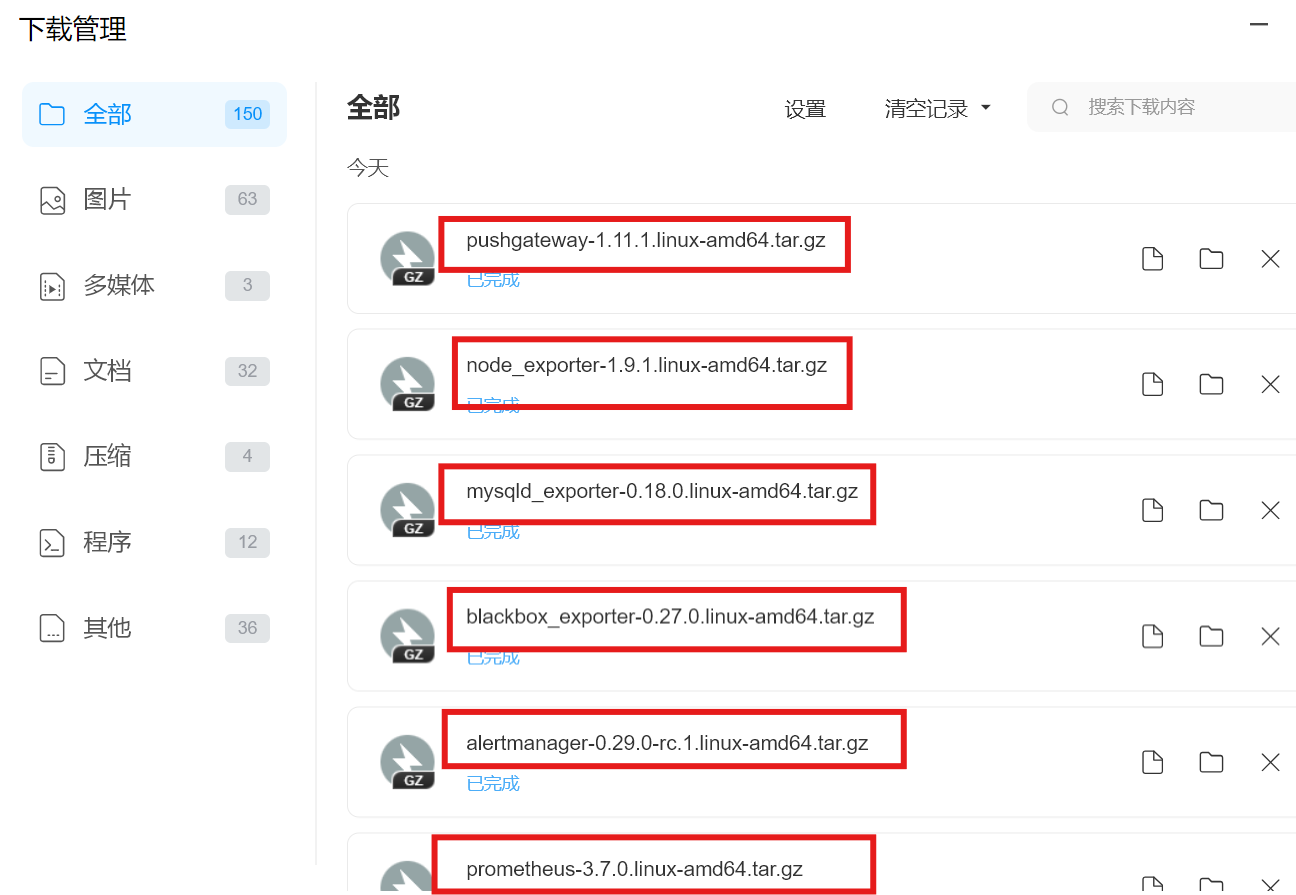
1.官网下载安装所需软件包
注:按照自己的需求下载,这里我都下载了最新版,用到了六个软件包,还有图形化界面软件包
https://prometheus.io/download/![]() https://prometheus.io/download/
https://prometheus.io/download/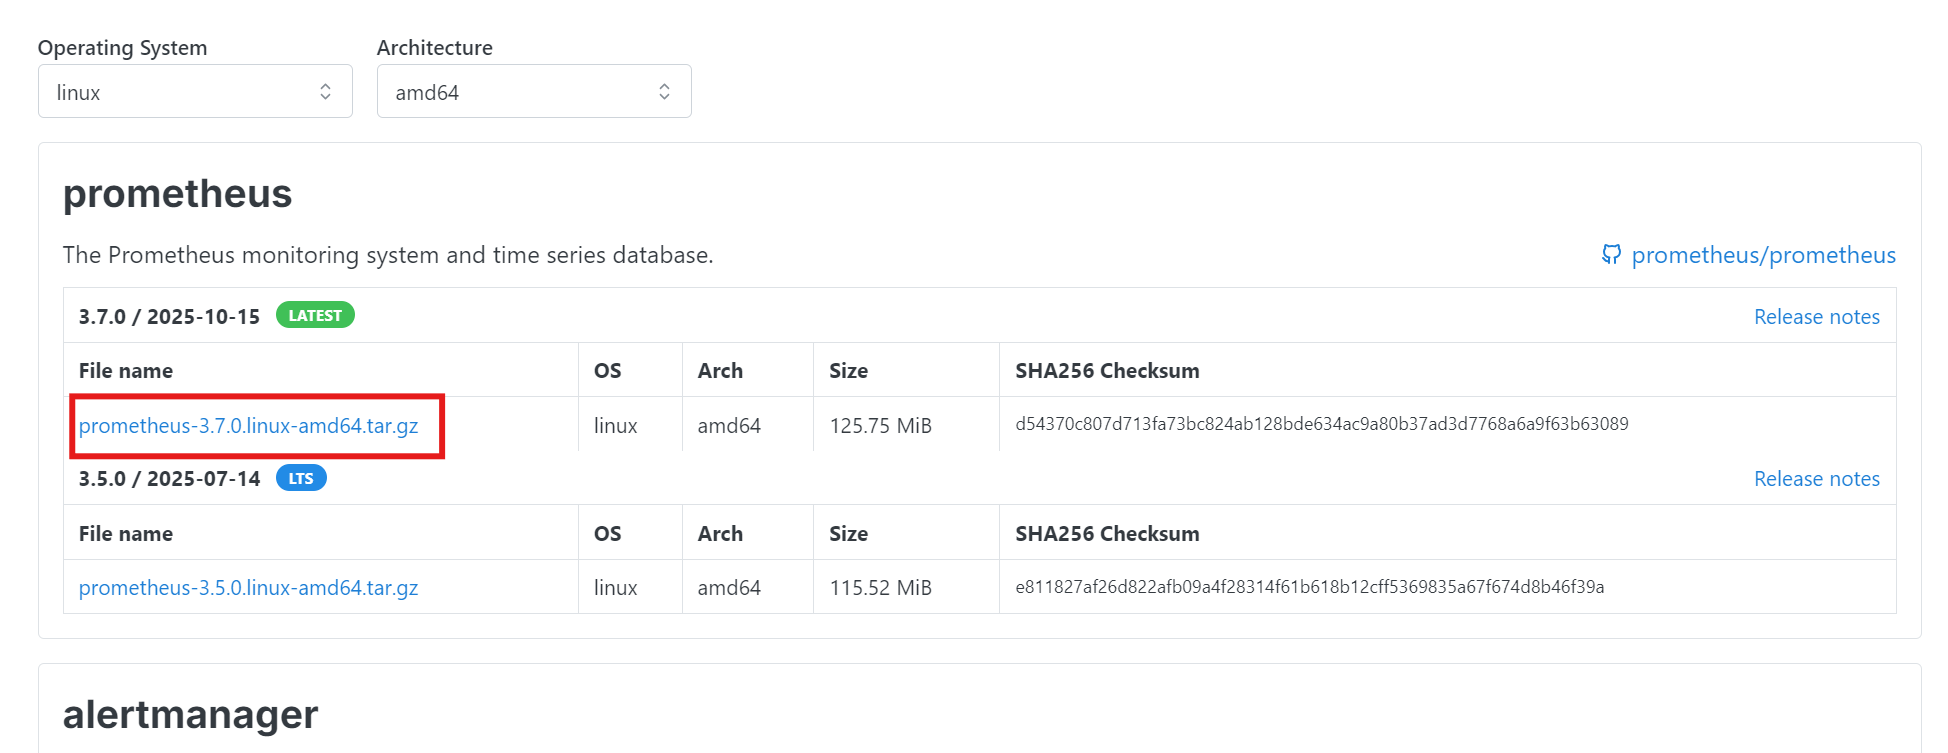
https://grafana.com/grafana/download?pg=get&plcmt=selfmanaged-box1-cta1&platform=linux![]() https://grafana.com/grafana/download?pg=get&plcmt=selfmanaged-box1-cta1&platform=linux
https://grafana.com/grafana/download?pg=get&plcmt=selfmanaged-box1-cta1&platform=linux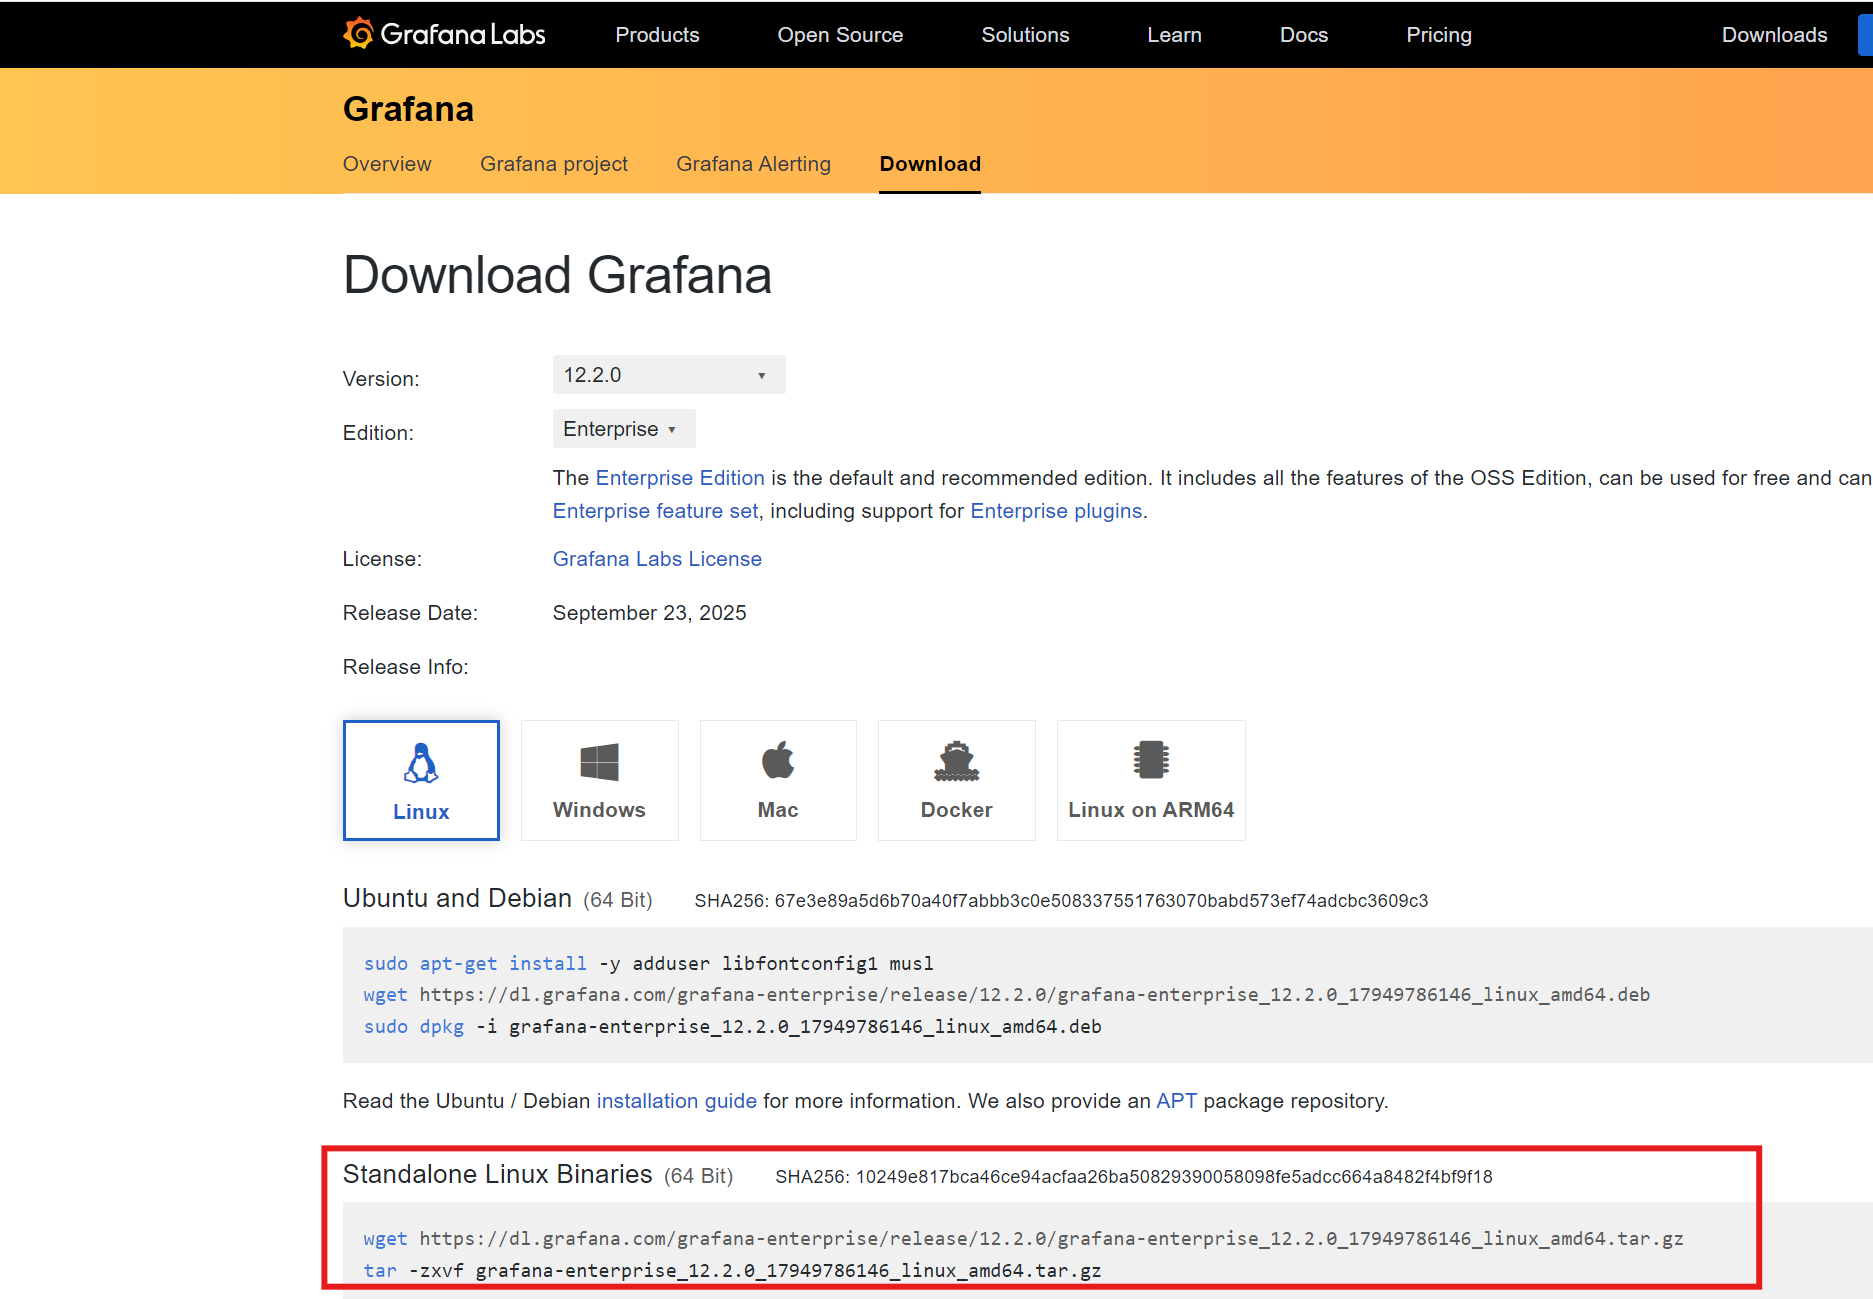
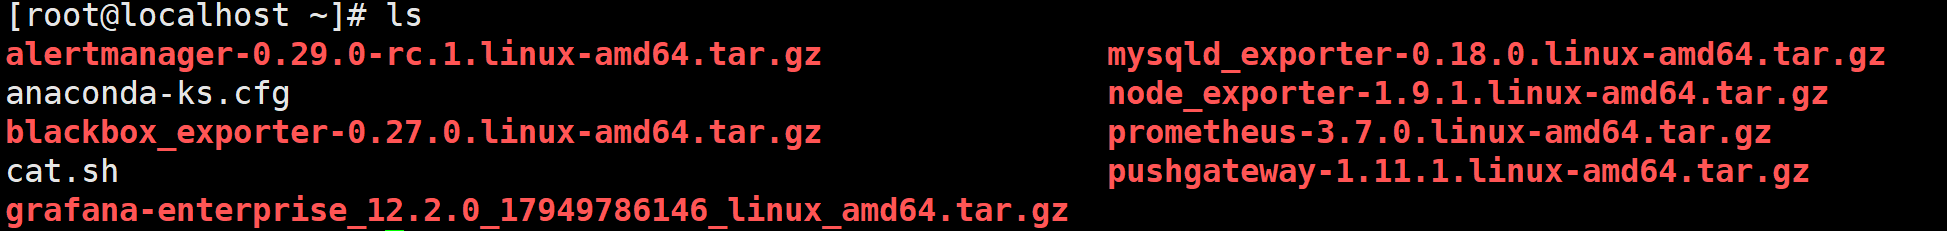
2.安装Prometheus server服务
[root@localhost ~]# tar -xf prometheus-3.7.0.linux-amd64.tar.gz
[root@localhost ~]# cp -r prometheus-3.7.0.linux-amd64 /usr/local/prometheus
[root@localhost ~]# tar -xf grafana-enterprise_12.2.0_17949786146_linux_amd64.tar.gz
[root@localhost ~]# cp -r grafana-12.2.0/ /usr/share/grafana
3.编写服务启动脚本
[root@localhost prometheus]# pwd
/usr/local/prometheus
#创建启动脚本
[root@localhost prometheus]# cat>/usr/local/prometheus/prometheus.service<<EOF
[Unit]
Description=Prometheus
After=network.target
[Service]
Type=simple
User=root
WorkingDirectory=/usr/local/prometheus
ExecStart=/usr/local/prometheus/prometheus --
config.file=/usr/local/prometheus/prometheus.yml
Restart=on-failure
LimitNOFILE=65536
[Install]
WantedBy=multi-user.target
EOF
#创建软链接,记得使用绝对路径
[root@localhost ~]# ln -s /usr/local/prometheus/prometheus.service /lib/systemd/system/
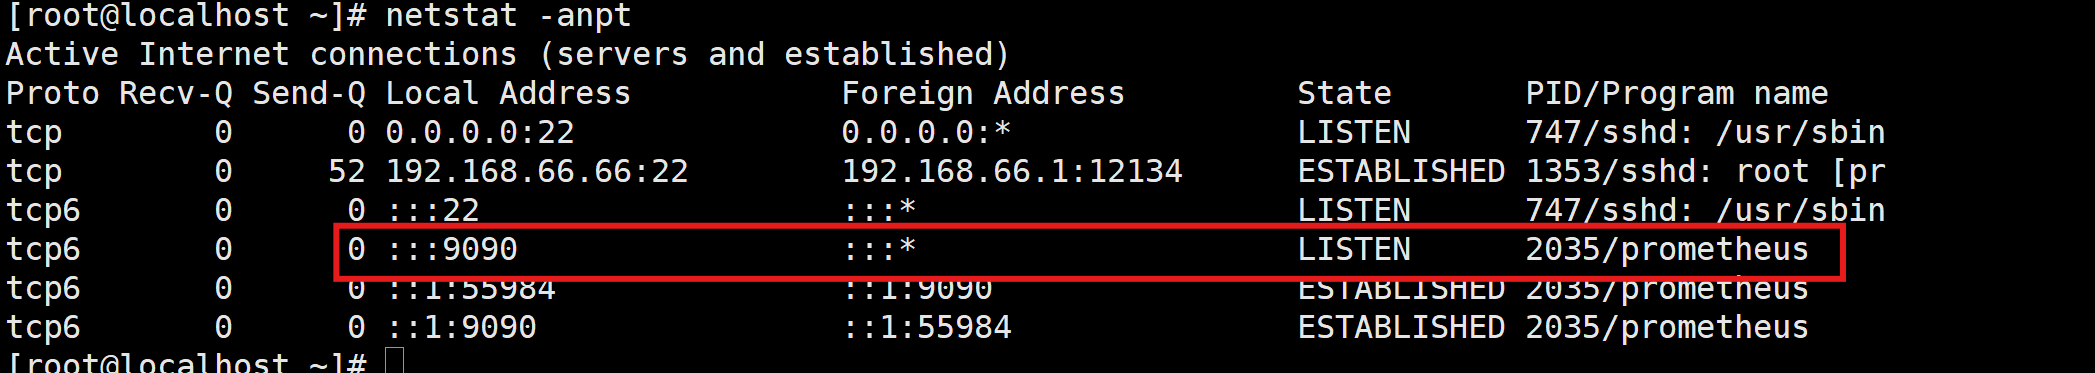
#启动prometheus服务
[root@localhost ~]# systemctl enable --now prometheus
Created symlink /etc/systemd/system/prometheus.service → /usr/local/prometheus/prometheus.service.
Created symlink /etc/systemd/system/multi-user.target.wants/prometheus.service → /usr/local/prometheus/prometheus.service.
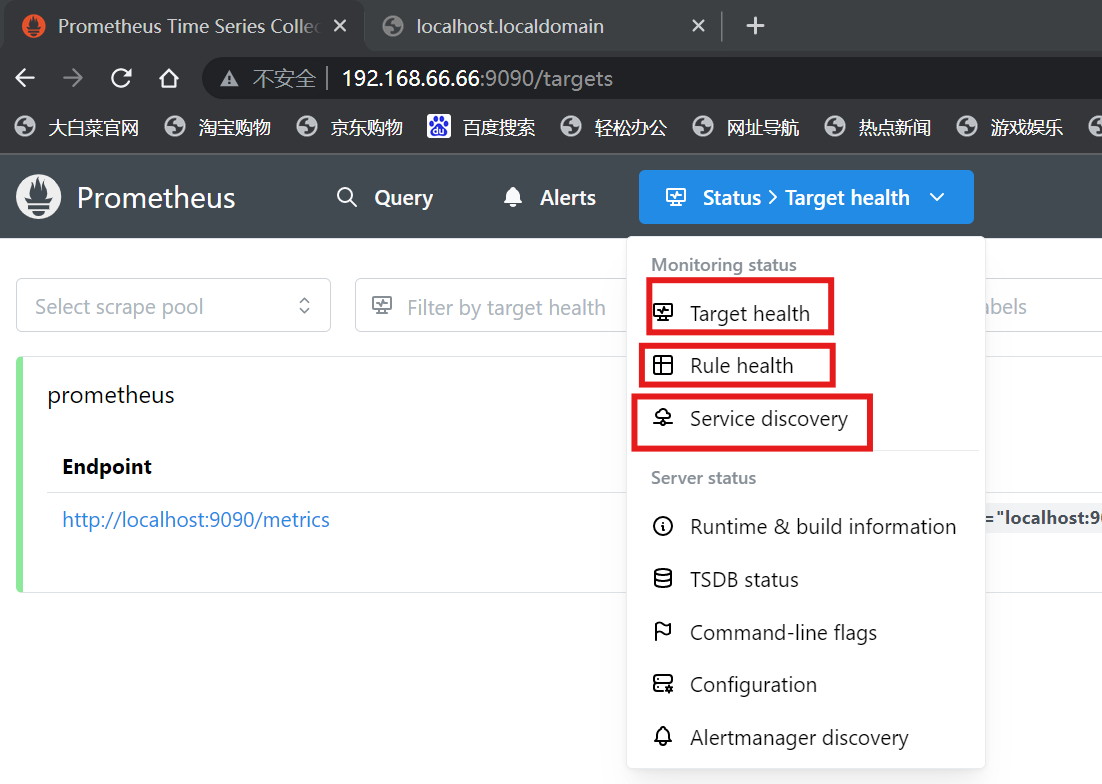
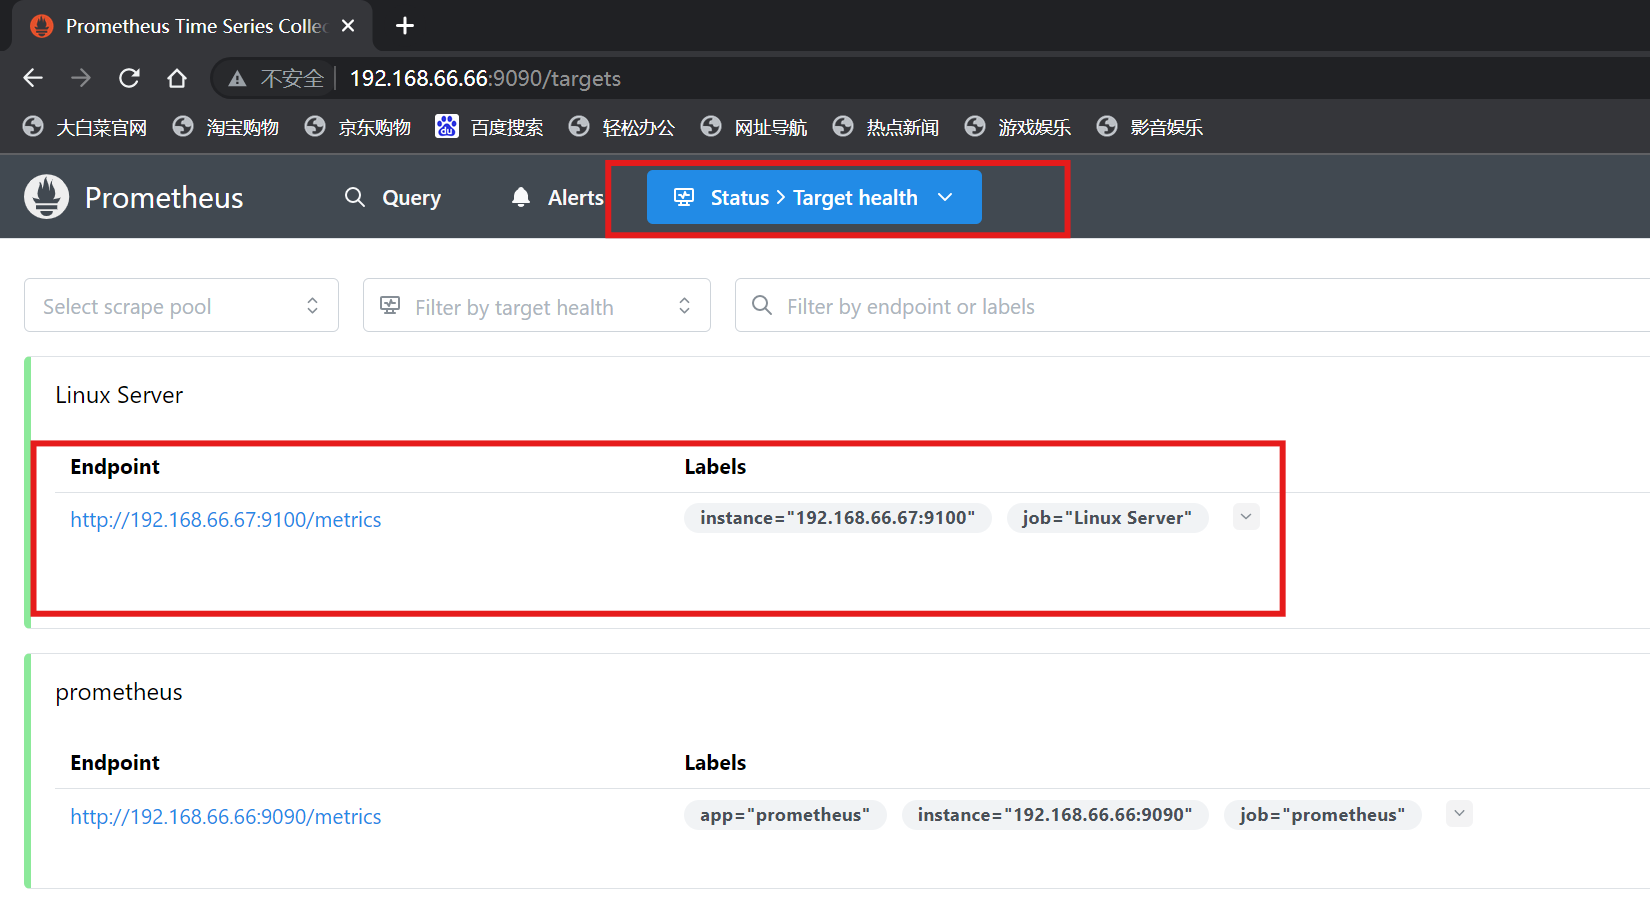
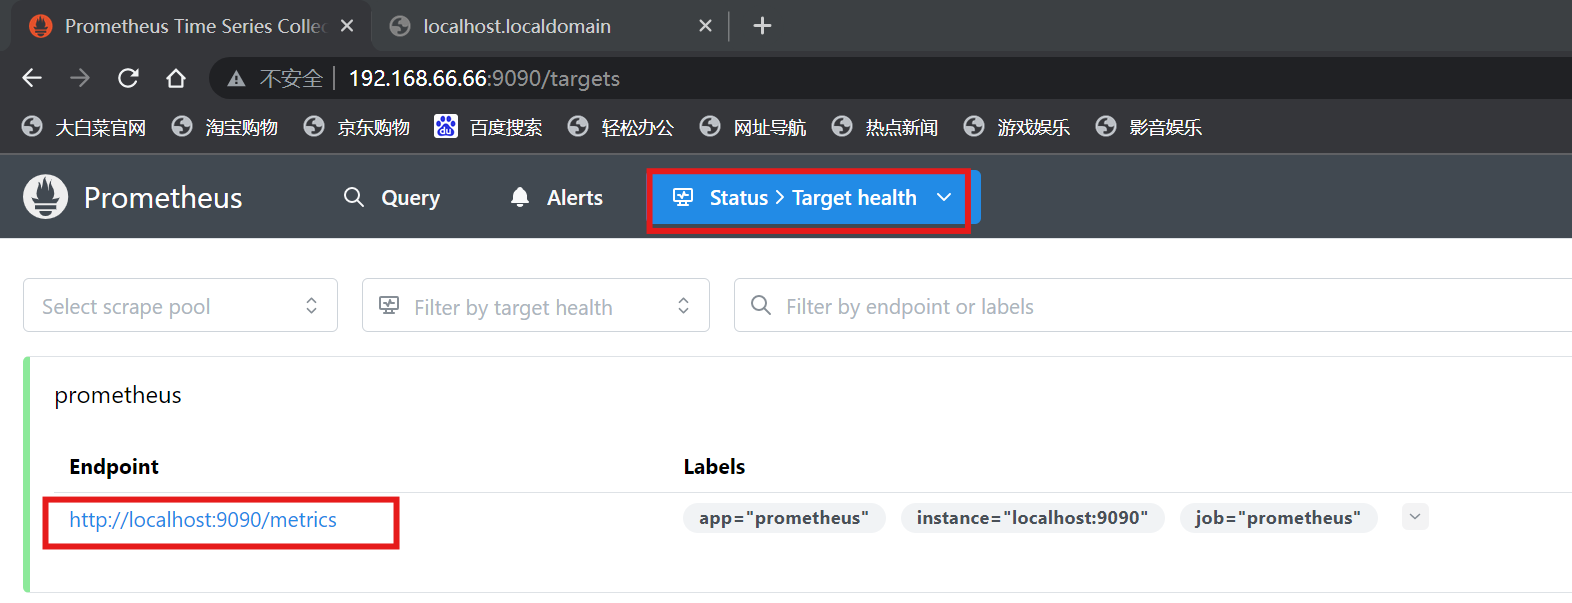
- Target health:被监控对象
- Rule health:规则,也叫触发器,告警规则
- Service discovery:服务发现功能,类似于zabbix的自动发现
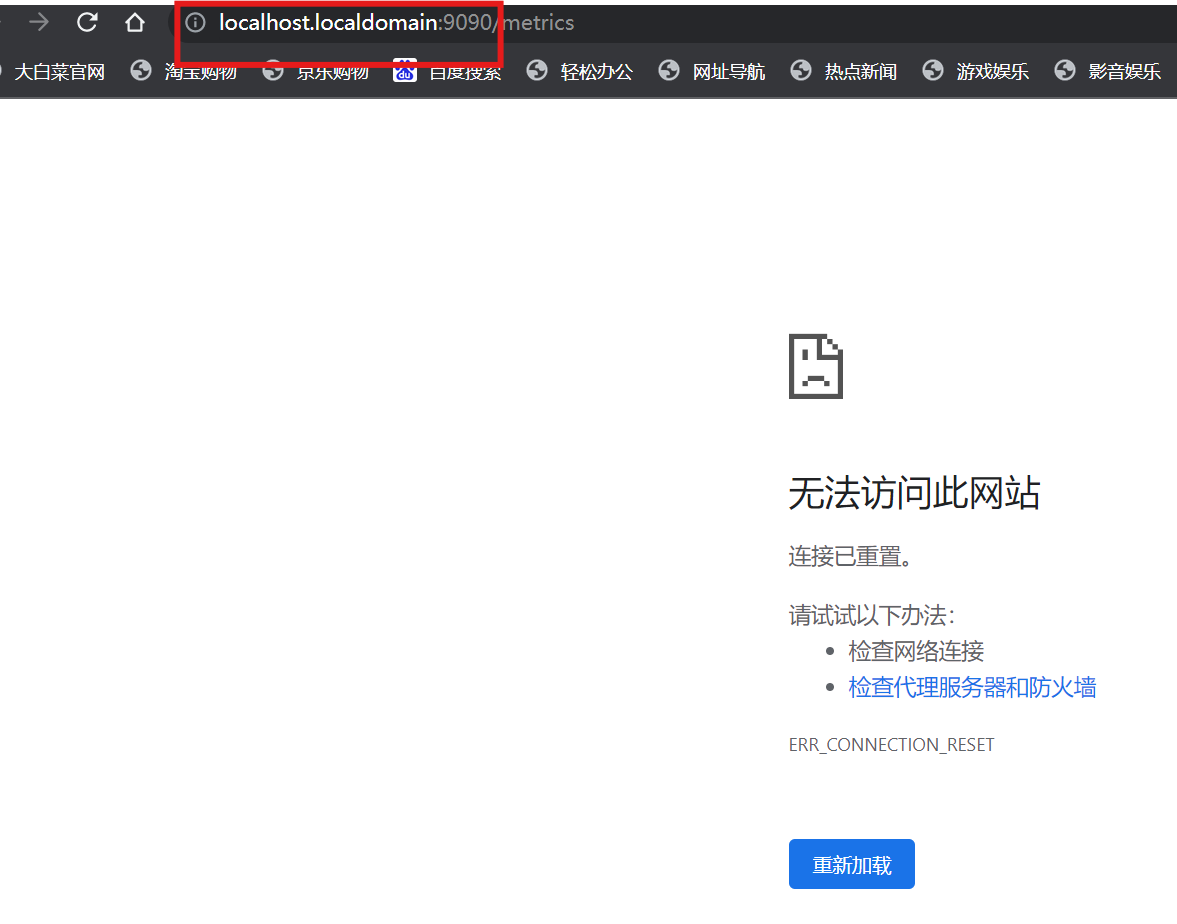
当查看监控对象时,因为我们没有做域名解析,所以这边查本地主机信息是查不到的,要把主机名改成ip地址才可以查看,我们也可以直接改配置文件中的域名为ip地址
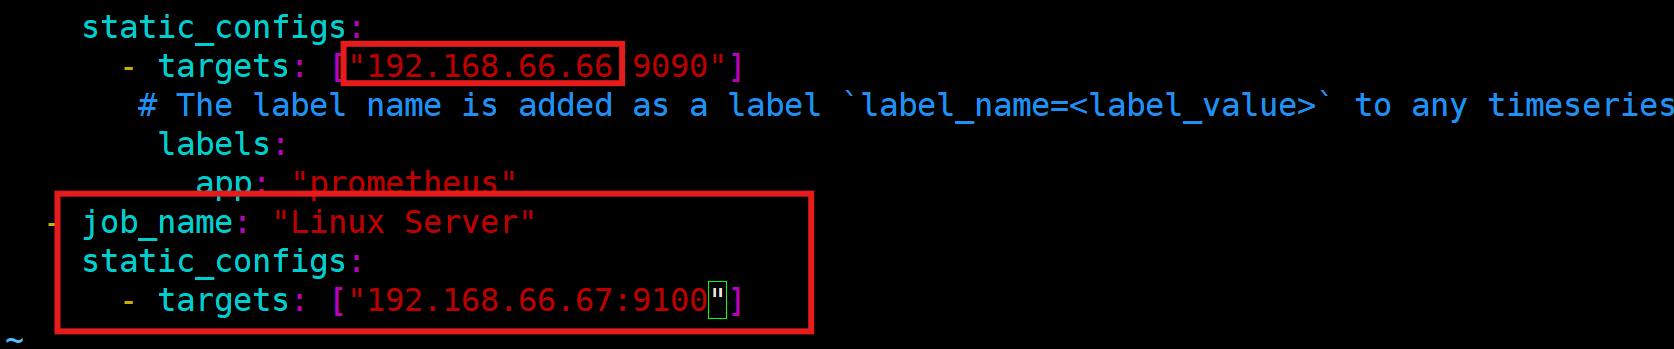
4.修改Prometheus的配置文件
注:在Prometheus node节点配置好之后再修改
[root@localhost ~]# systemctl restart prometheus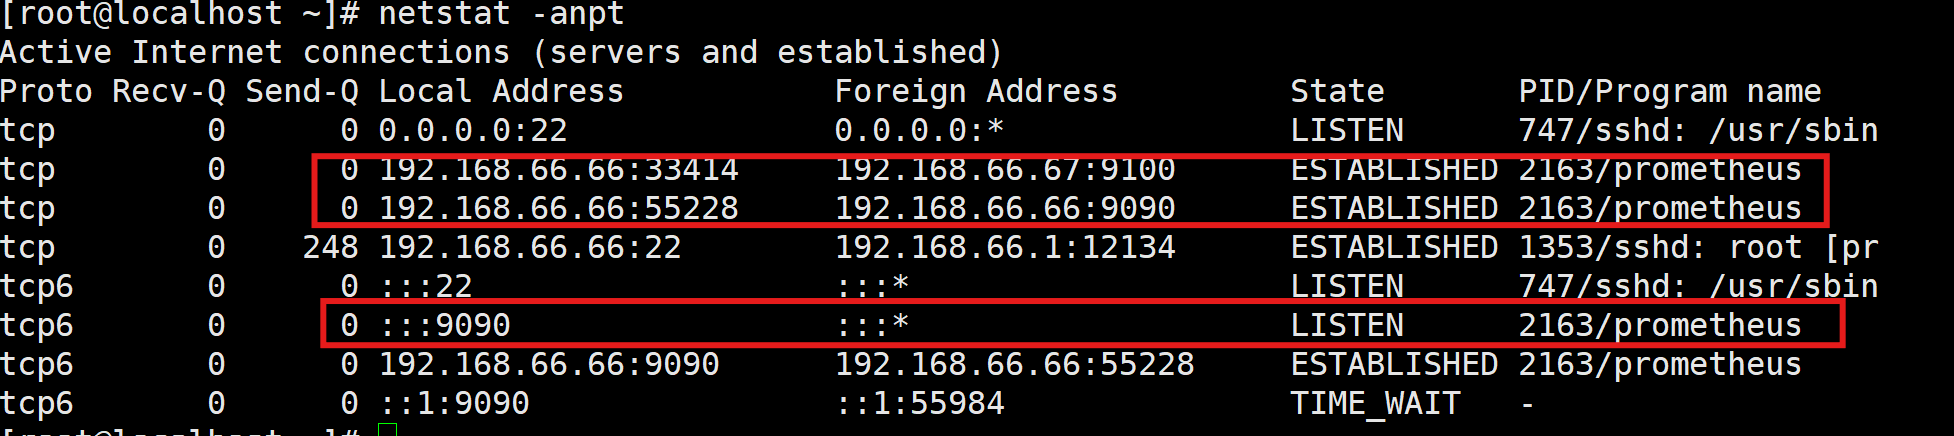
三、Prometheus node部署
1.解压缩并安装Node Exporter
[root@localhost ~]# ls
anaconda-ks.cfg  cat.sh  node_exporter-1.9.1.linux-amd64.tar.gz
[root@localhost ~]# tar -xf node_exporter-1.9.1.linux-amd64.tar.gz
[root@localhost ~]# cp -r node_exporter-1.9.1.linux-amd64 /usr/local/node_exporter
2.编写node启动脚本
#当前目录
[root@localhost node_exporter]# pwd
/usr/local/node_exporter
#编写启动脚本
[root@localhost node_exporter]# cat>/usr/local/node_exporter/node_exporter.service<<EOF
[Unit]
Description=Node Exporter
After=network.target
Wants=network-online.target
[Service]
Type=simple
User=root
ExecStart=/usr/local/node_exporter/node_exporter
Restart=on-failure
LimitNOFILE=65536
[Install]
WantedBy=multi-user.target
EOF
[root@localhost node_exporter]# cd
#创建软链接
[root@localhost ~]# ln -s /usr/local/node_exporter/node_exporter.service /lib/systemd/system/
#设置开机自启动
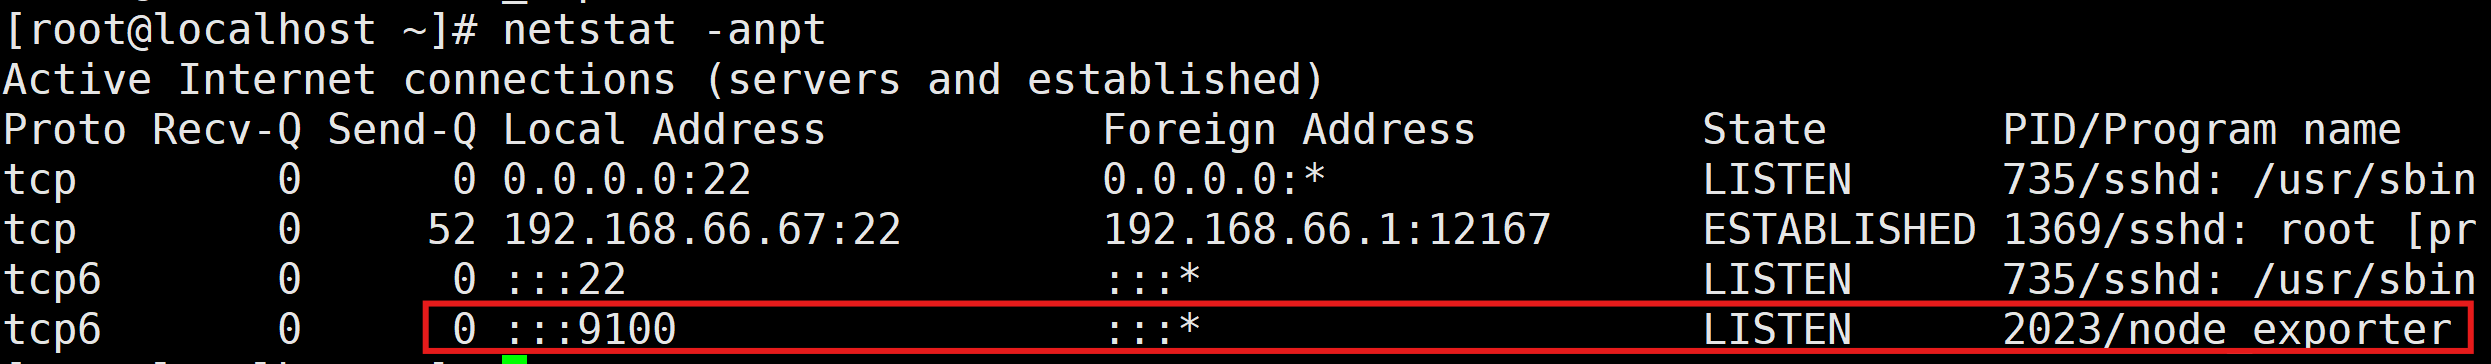
[root@localhost ~]# systemctl enable --now node_exporter
Created symlink /etc/systemd/system/node_exporter.service → /usr/local/node_exporter/node_exporter.service.
Created symlink /etc/systemd/system/multi-user.target.wants/node_exporter.service → /usr/local/node_exporter/node_exporter.service.
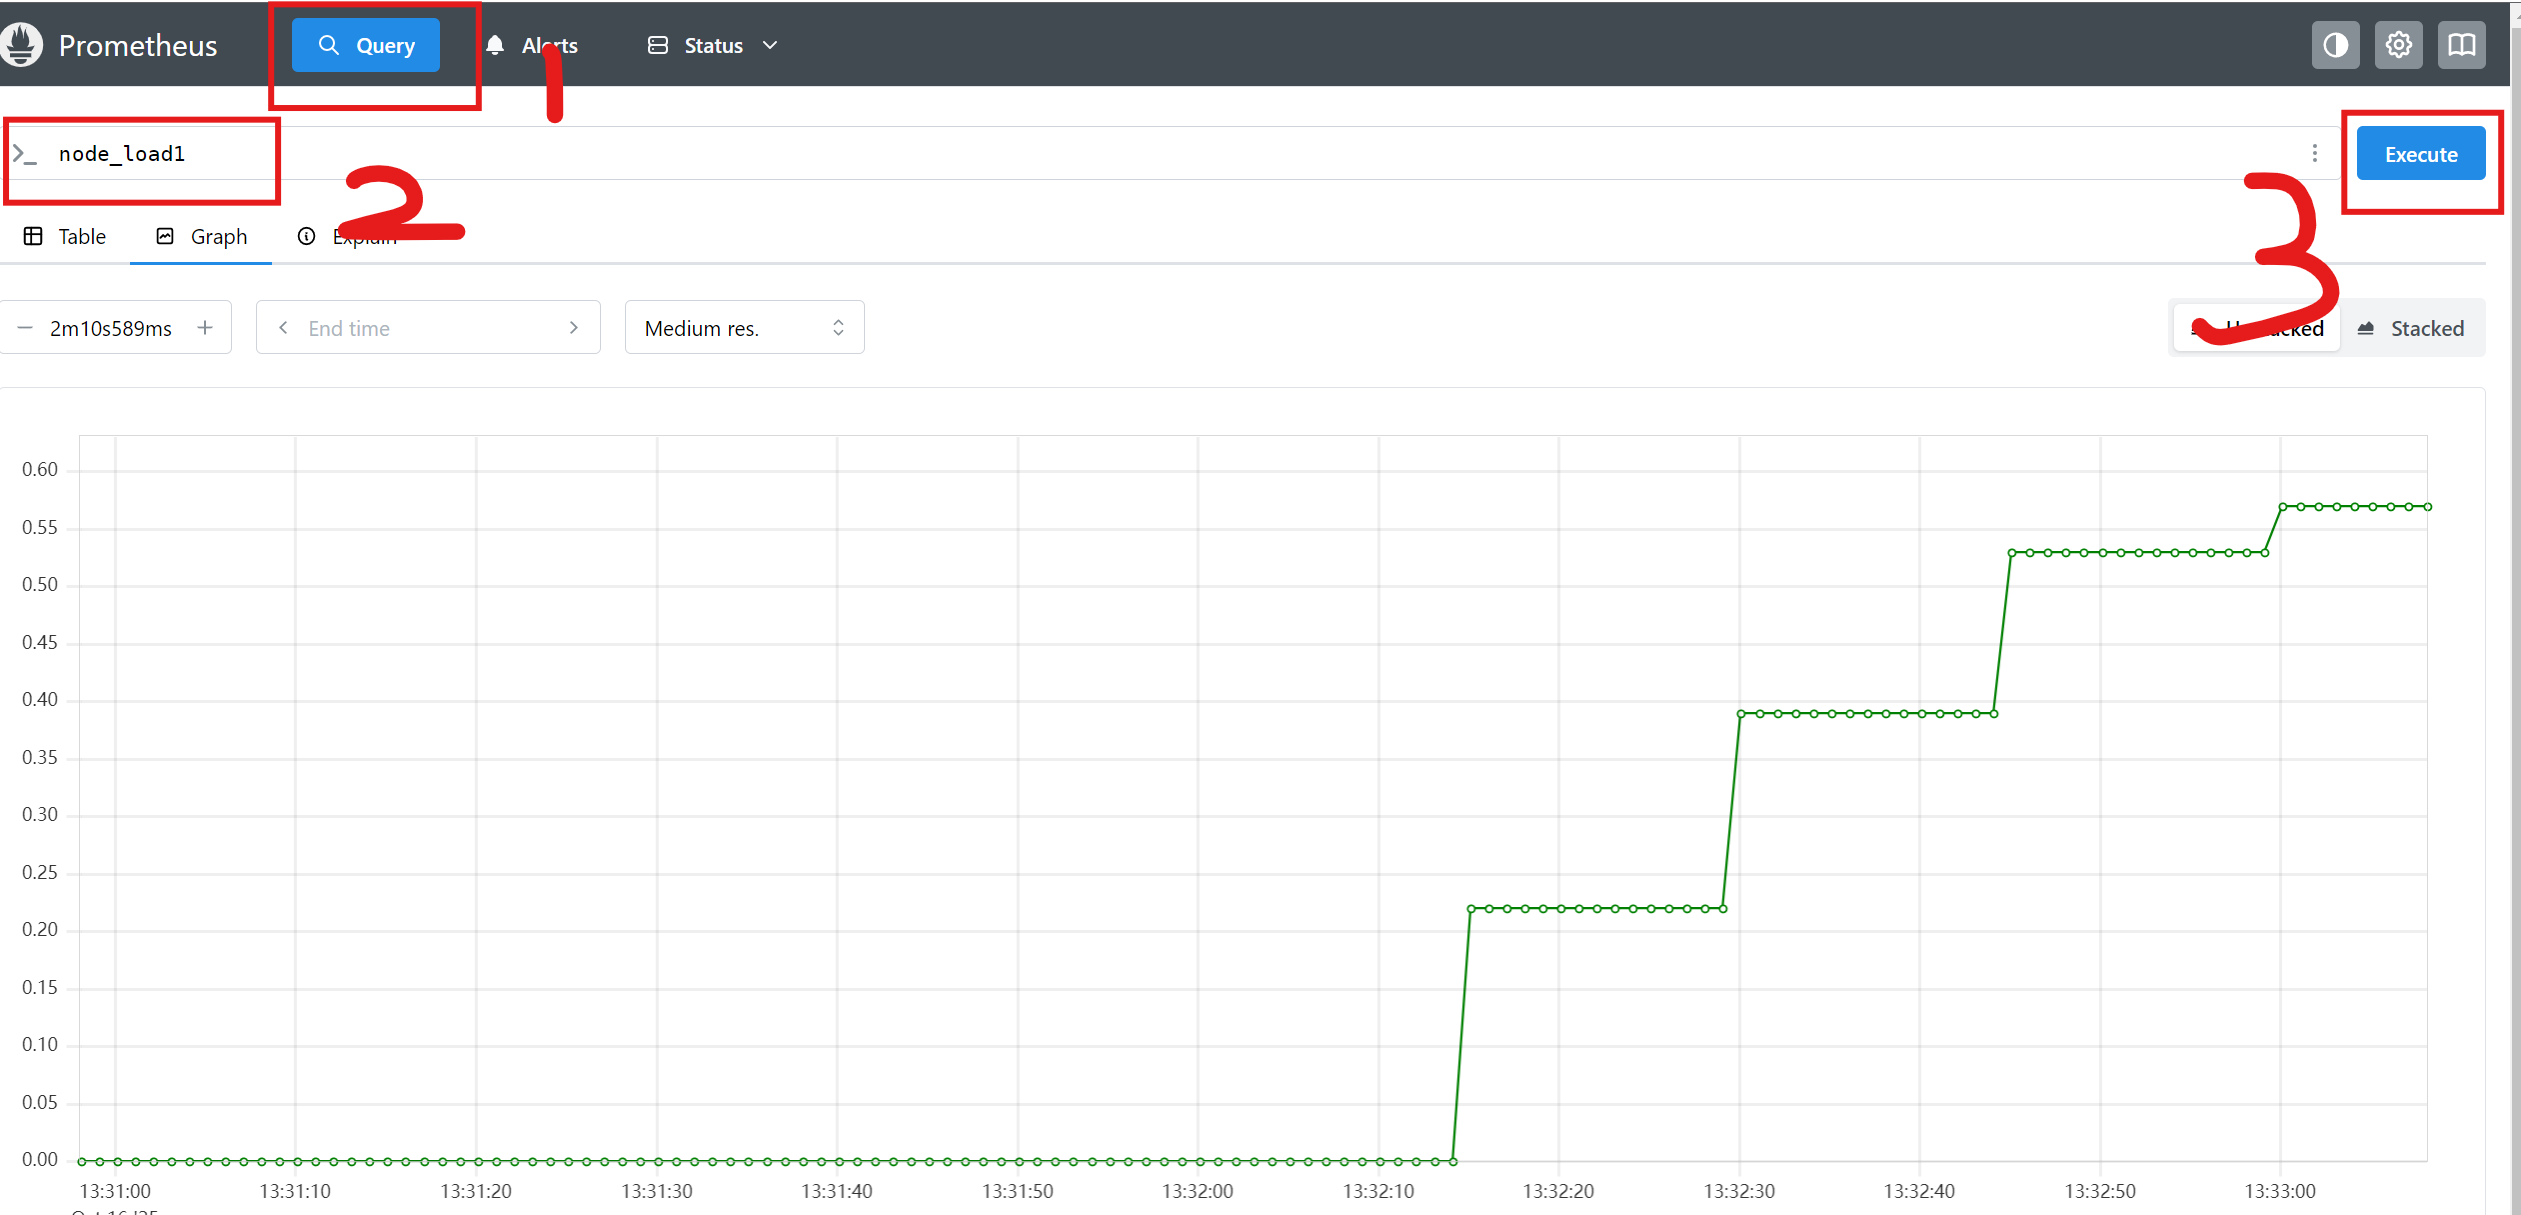
3.查看监控页面采集的数据