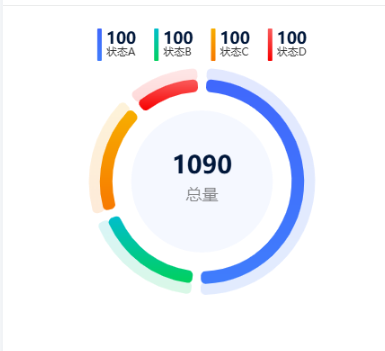
饼图1
var myChart = echarts.init(document.getElementById('eqp-pie-chart'));option = {tooltip: {trigger: 'item'},legend: {data: ['状态A', '状态B', '状态C', '状态D'],textStyle: {rich: {a: {color: 'rgba(0, 23, 58, 1)',fontSize: 18,fontWeight: 'bold'},b: {color: 'blue',fontSize: 16}},},formatter: function (name) {return `{a|${100}}\n${name}`;},itemGap: 20, itemWidth: 5, itemHeight: 36, padding: [5, 10], borderRadius: 2, borderColor: '#ccc' },title: {show: true,text: '1090',subtext: '总量',x: 'center', y: '40%',textStyle: {color: '#00173A', fontSize: 27 },subtextStyle: {color: '#33333399', fontSize: 18 }},series: [{type: 'pie',radius: ['0%', '45%'],label: {show: false,position: 'center'},data: [{value: 1090, name: 'Total', itemStyle: {color: 'rgba(64,124,252,0.05)'}},]},{name: '设备状态统计',type: 'pie',radius: ['57%', '65%'],padAngle: 19,avoidLabelOverlap: false,padAngle: 5,itemStyle: {borderRadius: 5},label: {show: false,position: 'center'},emphasis: {label: {show: true,fontSize: 40,fontWeight: 'bold'}},labelLine: {show: false},data: [{value: 432, name: '状态A', itemStyle: {color: new echarts.graphic.LinearGradient(0, 0, 0, 1, [{offset: 1,color: 'rgba(64, 125, 252, 1)' }, {offset: 0,color: 'rgba(64, 104, 252, 1)' }])}},{value: 159, name: '状态B', itemStyle: {color: new echarts.graphic.LinearGradient(0, 0, 0, 1, [{offset: 1,color: 'rgba(1, 209, 94, 1)' }, {offset: 0,color: 'rgba(1, 190, 205, 1)' }])}},{value: 159, name: '状态C', itemStyle: {color: new echarts.graphic.LinearGradient(0, 0, 0, 1, [{offset: 1,color: 'rgba(247, 121, 0, 1)' }, {offset: 0,color: 'rgba(247, 174, 0, 1)' }])}},{value: 99, name: '状态D', itemStyle: {color: new echarts.graphic.LinearGradient(0, 0, 0, 1, [{offset: 1,color: 'rgba(247, 1, 1, 1)' }, {offset: 0,color: 'rgba(250, 93, 93, 1)' }])}}]},{name: '设备状态统计阴影',type: 'pie',radius: ['64%', '72%'],padAngle: 19,avoidLabelOverlap: false,padAngle: 5,itemStyle: {borderRadius: 5},label: {show: false,position: 'center'},emphasis: {label: {show: true,fontSize: 40,fontWeight: 'bold'}},labelLine: {show: false},data: [{value: 432, name: '状态A', itemStyle: {color: new echarts.graphic.LinearGradient(0, 0, 0, 1, [{offset: 1,color: 'rgba(64, 125, 252, 0.15)' }, {offset: 0,color: 'rgba(64, 104, 252, 0.15)' }])}},{value: 159, name: '状态B', itemStyle: {color: new echarts.graphic.LinearGradient(0, 0, 0, 1, [{offset: 1,color: 'rgba(1, 209, 94, 0.15)' }, {offset: 0,color: 'rgba(1, 190, 205, 0.15)' }])}},{value: 159, name: '状态C', itemStyle: {color: new echarts.graphic.LinearGradient(0, 0, 0, 1, [{offset: 1,color: 'rgba(247, 121, 0, 0.15)' }, {offset: 0,color: 'rgba(247, 174, 0, 0.15)' }])}},{value: 99, name: '状态D', itemStyle: {color: new echarts.graphic.LinearGradient(0, 0, 0, 1, [{offset: 1,color: 'rgba(247, 1, 1, 0.15)' }, {offset: 0,color: 'rgba(250, 93, 93, 0.15)' }])}}]}]
};
myChart.setOption(option);