PyQt6实例_个股收盘价和市盈率TTM
目录
前置:
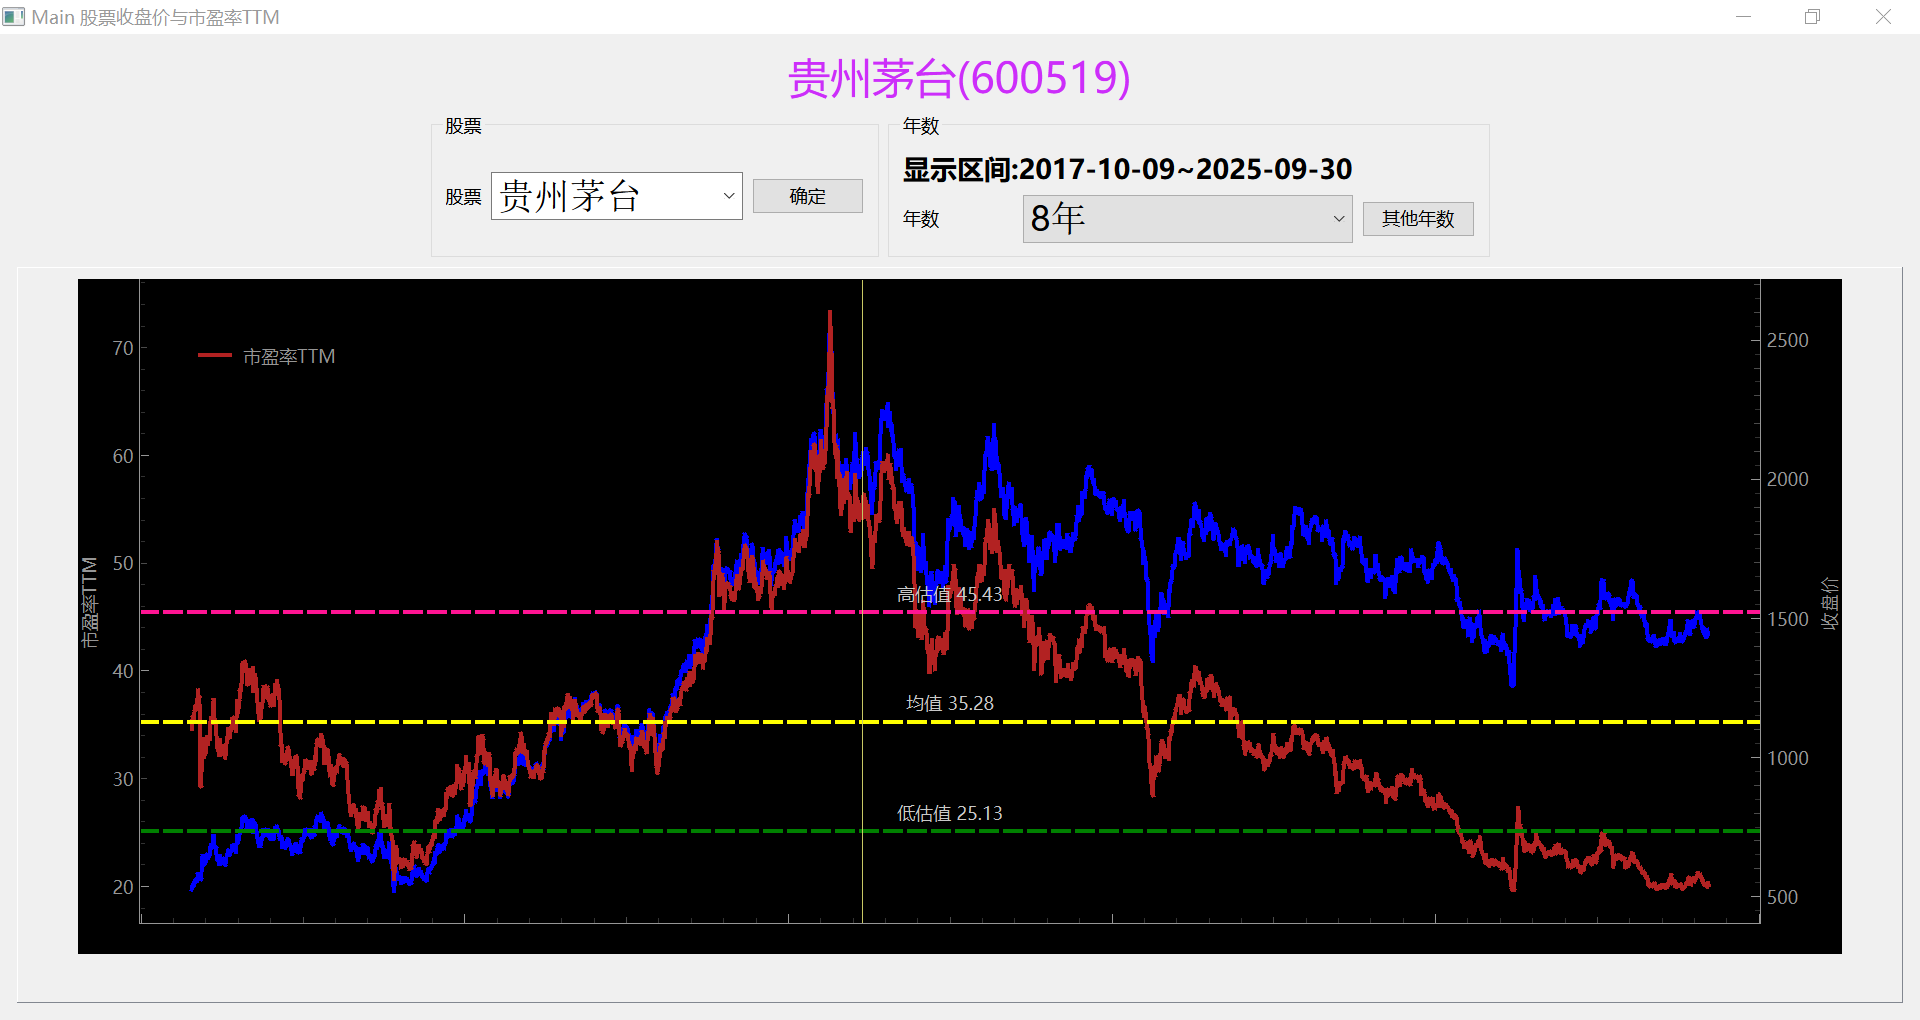
效果:
代码:
pyqtgraph折线图控件
主界面
调用
前置:
1 个股数据来自优矿
2 代码中是将数据存入postgreSQL数据库进行调用,不用数据库的可以将对应代码更改成调用csv文件
3 图中均值、高估值、低估值是市盈率TTM计算所得
高估值 = 均值 + 一个标准差
低估值 = 均值 - 一个标准差
效果:
代码:
pyqtgraph折线图控件
class Graph2YLinesWidget(pg.PlotWidget):def __init__(self):super().__init__()self.setMinimumHeight(450)self.init_data()def init_data(self):self.color_bar = (0, 0, 255)self.color_line = (178, 34, 34)self.color_mean = ( 255,255,0) # 纯黄self.color_top = (255,20,147) # 深粉色self.color_below = (0,128,0) # 纯绿self.x = Noneself.xTicks:list = []self.p2 = pg.ViewBox()self.whole_left_df = pd.DataFrame() # lienself.whole_right_df = pd.DataFrame() # barself.whole_left_name:str = ''self.whole_right_name:str = ''passdef set_data(self,df:pd.DataFrame,left_name:str,right_name:str):'''dateStr 字符型:return:'''self.clear()if self.p2:self.p2.clear()passif df.empty:returndf['x'] = range(len(df))left_df = df.loc[:,['x','dateStr','a1']]right_df = df.loc[:,['x','dateStr','a2']]left_df.dropna(subset=['a1'],inplace=True)right_df.dropna(subset=['a2'],inplace=True)self.x = df['x'].to_list()self.whole_right_df = right_df.copy()self.whole_left_df = left_df.copy()self.whole_left_name = left_nameself.whole_right_name = right_nameself.xTicks = df.loc[:,['x','dateStr']].valuesself.addLegend()self.setLabel('left',left_name)y_left = left_df['a1'].to_list()x_left = left_df['x'].to_list()right_df = right_df.fillna(0)y_right = right_df['a2'].to_list()x_right = right_df['x'].to_list()curve_left = pg.PlotCurveItem(x=x_left,y=y_left,pen=pg.mkPen({'color': self.color_line, 'width': 4}), connect='finite',name=left_name)self.addItem(curve_left)self.setLabel('right',right_name)self.p2.enableAutoRange()self.scene().addItem(self.p2)self.getAxis('right').linkToView(self.p2)self.p2.setXLink(self)curve_right = pg.PlotCurveItem(x=x_right, y=y_right, pen=pg.mkPen({'color': self.color_bar, 'width': 4}),connect='finite', name=right_name)self.p2.addItem(curve_right)# 三条线val_mean = left_df['a1'].mean()val_std = left_df['a1'].std()val_top = val_mean + val_stdval_below = val_mean - val_stdcur_mean = pg.InfiniteLine(pos=(0, val_mean), angle=0, movable=False,pen=pg.mkPen({'color': self.color_mean, 'width': 4, 'style' : Qt.PenStyle.DashLine}), label=f'均值 {other_utils.trans_float_to_money(val_mean)}')cur_top = pg.InfiniteLine(pos=(0, val_top), angle=0, movable=False,pen=pg.mkPen({'color': self.color_top, 'width': 4, 'style': Qt.PenStyle.DashLine}),label=f'高估值 {other_utils.trans_float_to_money(val_top)}')cur_below = pg.InfiniteLine(pos=(0, val_below), angle=0, movable=False,pen=pg.mkPen({'color': self.color_below, 'width': 4, 'style': Qt.PenStyle.DashLine}),label=f'低估值 {other_utils.trans_float_to_money(val_below)}')self.addItem(cur_mean)self.addItem(cur_top)self.addItem(cur_below)horAxis = StrAxisItem(ticks=self.xTicks, orientation='bottom')self.setAxisItems({'bottom': horAxis})self.vLine = pg.InfiniteLine(angle=90, movable=False)self.hLine = pg.InfiniteLine(angle=0, movable=False)self.addItem(self.vLine, ignoreBounds=True)self.addItem(self.hLine, ignoreBounds=True)self.label = pg.TextItem()self.addItem(self.label,ignoreBounds=True)self.vb = self.getViewBox()self.vb.sigResized.connect(self.updateViews)self.scene().sigMouseMoved.connect(self.mouseMoved)self.enableAutoRange()passdef updateViews(self):self.p2.setGeometry(self.getViewBox().sceneBoundingRect())self.p2.linkedViewChanged(self.getViewBox(), self.p2.XAxis)passdef mouseMoved(self,evt):pos = evtif self.sceneBoundingRect().contains(pos):mousePoint = self.vb.mapSceneToView(pos)index = int(mousePoint.x())if index > 0 and index < len(self.x):l_df = self.whole_left_df.loc[self.whole_left_df['x']==index]# r_index0 = index - self.bar_width# r_index1 = index + self.bar_width# r_df = self.whole_right_df.loc[(self.whole_right_df['x']>r_index0) & (self.whole_right_df['x']<r_index1)]r_df = self.whole_right_df.loc[self.whole_right_df['x'] == index]dateStr = self.xTicks[index][1]html_str = f"<span style='font-size:20pt;color:#ffff00;'>{self.whole_left_name}日期:{dateStr} <br/>"if not l_df.empty:html_str += f"{self.whole_left_name}:{other_utils.trans_float_to_money(l_df.iloc[0]['a1'])} <br/>"passif not r_df.empty:html_str += f"{self.whole_right_name}日期:{r_df.iloc[0]['dateStr']} <br/>"html_str += f"{self.whole_right_name}:{other_utils.trans_float_to_money(r_df.iloc[0]['a2'])} "passhtml_str += '</span>'self.label.setHtml(html_str)self.label.setPos(mousePoint.x(),mousePoint.y())self.vLine.setPos(mousePoint.x())self.hLine.setPos(mousePoint.y())passpasspasspass主界面
class StockTool00Widget(QWidget):def __init__(self,parent=None):super().__init__()self.setWindowTitle('Main 股票收盘价与市盈率TTM')self.label_title = QLabel('某一股票', alignment=Qt.AlignmentFlag.AlignHCenter)self.label_title.setStyleSheet("font-size:28px;color:#CC2EFA;")groupbox100 = QGroupBox('股票')label100 = QLabel('股票')self.combox_stock = CompleteCombox()self.combox_stock.setFont(QFont('Arial', 18))self.combox_stock.setSizeAdjustPolicy(QComboBox.SizeAdjustPolicy.AdjustToContents)self.btn_100_check = QPushButton('确定', clicked=self.btn_100_check_clicked)layout100 = QGridLayout()layout100.addWidget(label100, 0, 0, 1, 1)layout100.addWidget(self.combox_stock, 0, 1, 1, 2)layout100.addWidget(self.btn_100_check, 0, 3, 1, 1)groupbox100.setLayout(layout100)groupbox200 = QGroupBox('年数')self.label_year = QLabel('显示区间')self.label_year.setStyleSheet("font-size:18px;font-weight:bold;")label200 = QLabel('年数')self.combox_year = QComboBox()self.combox_year.setFont(QFont('Arial', 18))self.combox_year.setSizeAdjustPolicy(QComboBox.SizeAdjustPolicy.AdjustToContents)self.combox_year.currentTextChanged.connect(self.combox_year_currentTextChanged)btn_200_year = QPushButton('其他年数', clicked=self.btn_200_year_clicked)layout200 = QGridLayout()layout200.addWidget(self.label_year, 0, 0, 1, 4)layout200.addWidget(label200, 1, 0, 1, 1)layout200.addWidget(self.combox_year, 1, 1, 1, 3)layout200.addWidget(btn_200_year, 1, 4, 1, 1)groupbox200.setLayout(layout200)label_graph = QLabel('收盘价&市盈率TTM', alignment=Qt.AlignmentFlag.AlignHCenter)label_graph.setStyleSheet("font-size:16px;font-weight:bold;")self.graph_widget = Graph2YLinesWidget()layout_scroll = QVBoxLayout()layout_scroll.setContentsMargins(40, 40, 40, 40) # 上 右 下 左scroll_area = QScrollArea()scroll_area.setWidgetResizable(True)scroll_area.setVerticalScrollBarPolicy(Qt.ScrollBarPolicy.ScrollBarAlwaysOff)layout_scroll.addWidget(label_graph)layout_scroll.addWidget(self.graph_widget)one_widget = QWidget()one_widget.setLayout(layout_scroll)scroll_area.setWidget(one_widget)layout900 = QHBoxLayout()layout900.addStretch(1)layout900.addWidget(groupbox100)layout900.addWidget(groupbox200)layout900.addStretch(1)layout = QVBoxLayout()layout.addWidget(self.label_title)layout.addLayout(layout900)layout.addWidget(scroll_area)self.setLayout(layout)self.open_init()passdef open_init(self):self.whole_df: pd.DataFrame = pd.DataFrame()self.whole_year_map: dict = {'8年': 8,'全部': 0,'5年': 5}self.whole_year_int: int = 8self.combox_year.addItems(list(self.whole_year_map.keys()))with open(TICKER_NAME_JSON, 'r', encoding='utf-8') as fr:self.ticker_name_map = json.load(fr)self.name_ticker_map = {v: k for k, v in self.ticker_name_map.items()}self.combox_stock.clear()self.combox_stock.add_strings(list(self.name_ticker_map.keys()))passdef btn_100_check_clicked(self):cur_name = self.combox_stock.currentText()cur_ticker = self.name_ticker_map.get(cur_name,None)if not cur_ticker:QMessageBox.information(self,'提示',f'输入的 {cur_name} 在股票列表中不存在',QMessageBox.StandardButton.Ok)returnself.btn_100_check.setDisabled(True)df = self.caculate_df(cur_ticker)name = self.ticker_name_map.get(cur_ticker, cur_ticker)title_name = f"{name}({cur_ticker})"self.label_title.setText(title_name)self.whole_df = df.copy()self.whole_df['o_date'] = pd.to_datetime(self.whole_df['dateStr'])self.whole_df.sort_values(by='o_date', ascending=True, inplace=True)self.show_graph()self.btn_100_check.setDisabled(False)passdef caculate_df(self,ticker:str)->pd.DataFrame:conn = postgresql_utils.connect_db()cur = conn.cursor()try:sql_str = f"select tradeDate,closePrice,PE from t_stock_daily where ticker=\'{ticker}\';"cur.execute(sql_str)res = cur.fetchone()df = pd.DataFrame(data={'date': res[0],'a2': res[1],'a1': res[2]})df['o_date'] = pd.to_datetime(df['date'])df.sort_values(by='o_date', ascending=True, inplace=True)# df = df.loc[df['o_date'] > '2018-01-01']df['dateStr'] = df['o_date'].apply(date_utils.trans_date_to_str)passexcept:conn.rollback()traceback.print_exc()passelse:return dffinally:cur.close()conn.close()passdef combox_year_currentTextChanged(self):cur_txt = self.combox_year.currentText()cur_int = self.whole_year_map.get(cur_txt)if cur_int == self.whole_year_int:returnelse:self.whole_year_int = cur_intself.show_graph()passdef btn_200_year_clicked(self):txt, ok = QInputDialog.getInt(self, '输入整数', '年数')if ok and txt:self.whole_year_int = txtself.show_graph()passdef show_graph(self):if self.whole_year_int > 0:mp = self.whole_df.iloc[-1]['o_date']pre_ = date_utils.res_before_any_year_of_oneDay(mp,self.whole_year_int)df = self.whole_df.loc[self.whole_df['o_date']>=pre_].copy()preStr = df.iloc[0]['dateStr']afterStr = df.iloc[-1]['dateStr']self.label_year.setText(f"显示区间:{preStr}~{afterStr}")passelse:df = self.whole_df.copy()self.label_year.setText(f"显示区间:全区间")passself.graph_widget.set_data(df,'市盈率TTM','收盘价')passdef closeEvent(self,a0):answer = QMessageBox.question(self,'确认退出?','退出将中断操作,确定要退出么?',QMessageBox.StandardButton.Yes | QMessageBox.StandardButton.No)if answer == QMessageBox.StandardButton.Yes:a0.accept()else:a0.ignore()passpass调用
if __name__ == '__main__':app = QApplication([])mw = StockTool00Widget()mw.showMaximized()app.exec()pass