Pandas与SQL融合:用pandasql高效分析Uber数据
Pandas和SQL都是强大的数据分析工具,但如果我们能将它们结合起来呢?借助 pandasql,你可以在Jupyter Notebook中直接编写SQL语句。这种集成让我们能够无缝结合SQL逻辑和Python,从而更高效地完成数据分析。
在本文中,我们将结合使用Pandas和SQL,对一个来自Uber的数据项目进行分析。让我们开始吧!

什么是pandasql?
Pandasql通过内存中的SQLite引擎与任意DataFrame集成,因此你可以在Python环境中直接编写纯 SQL。
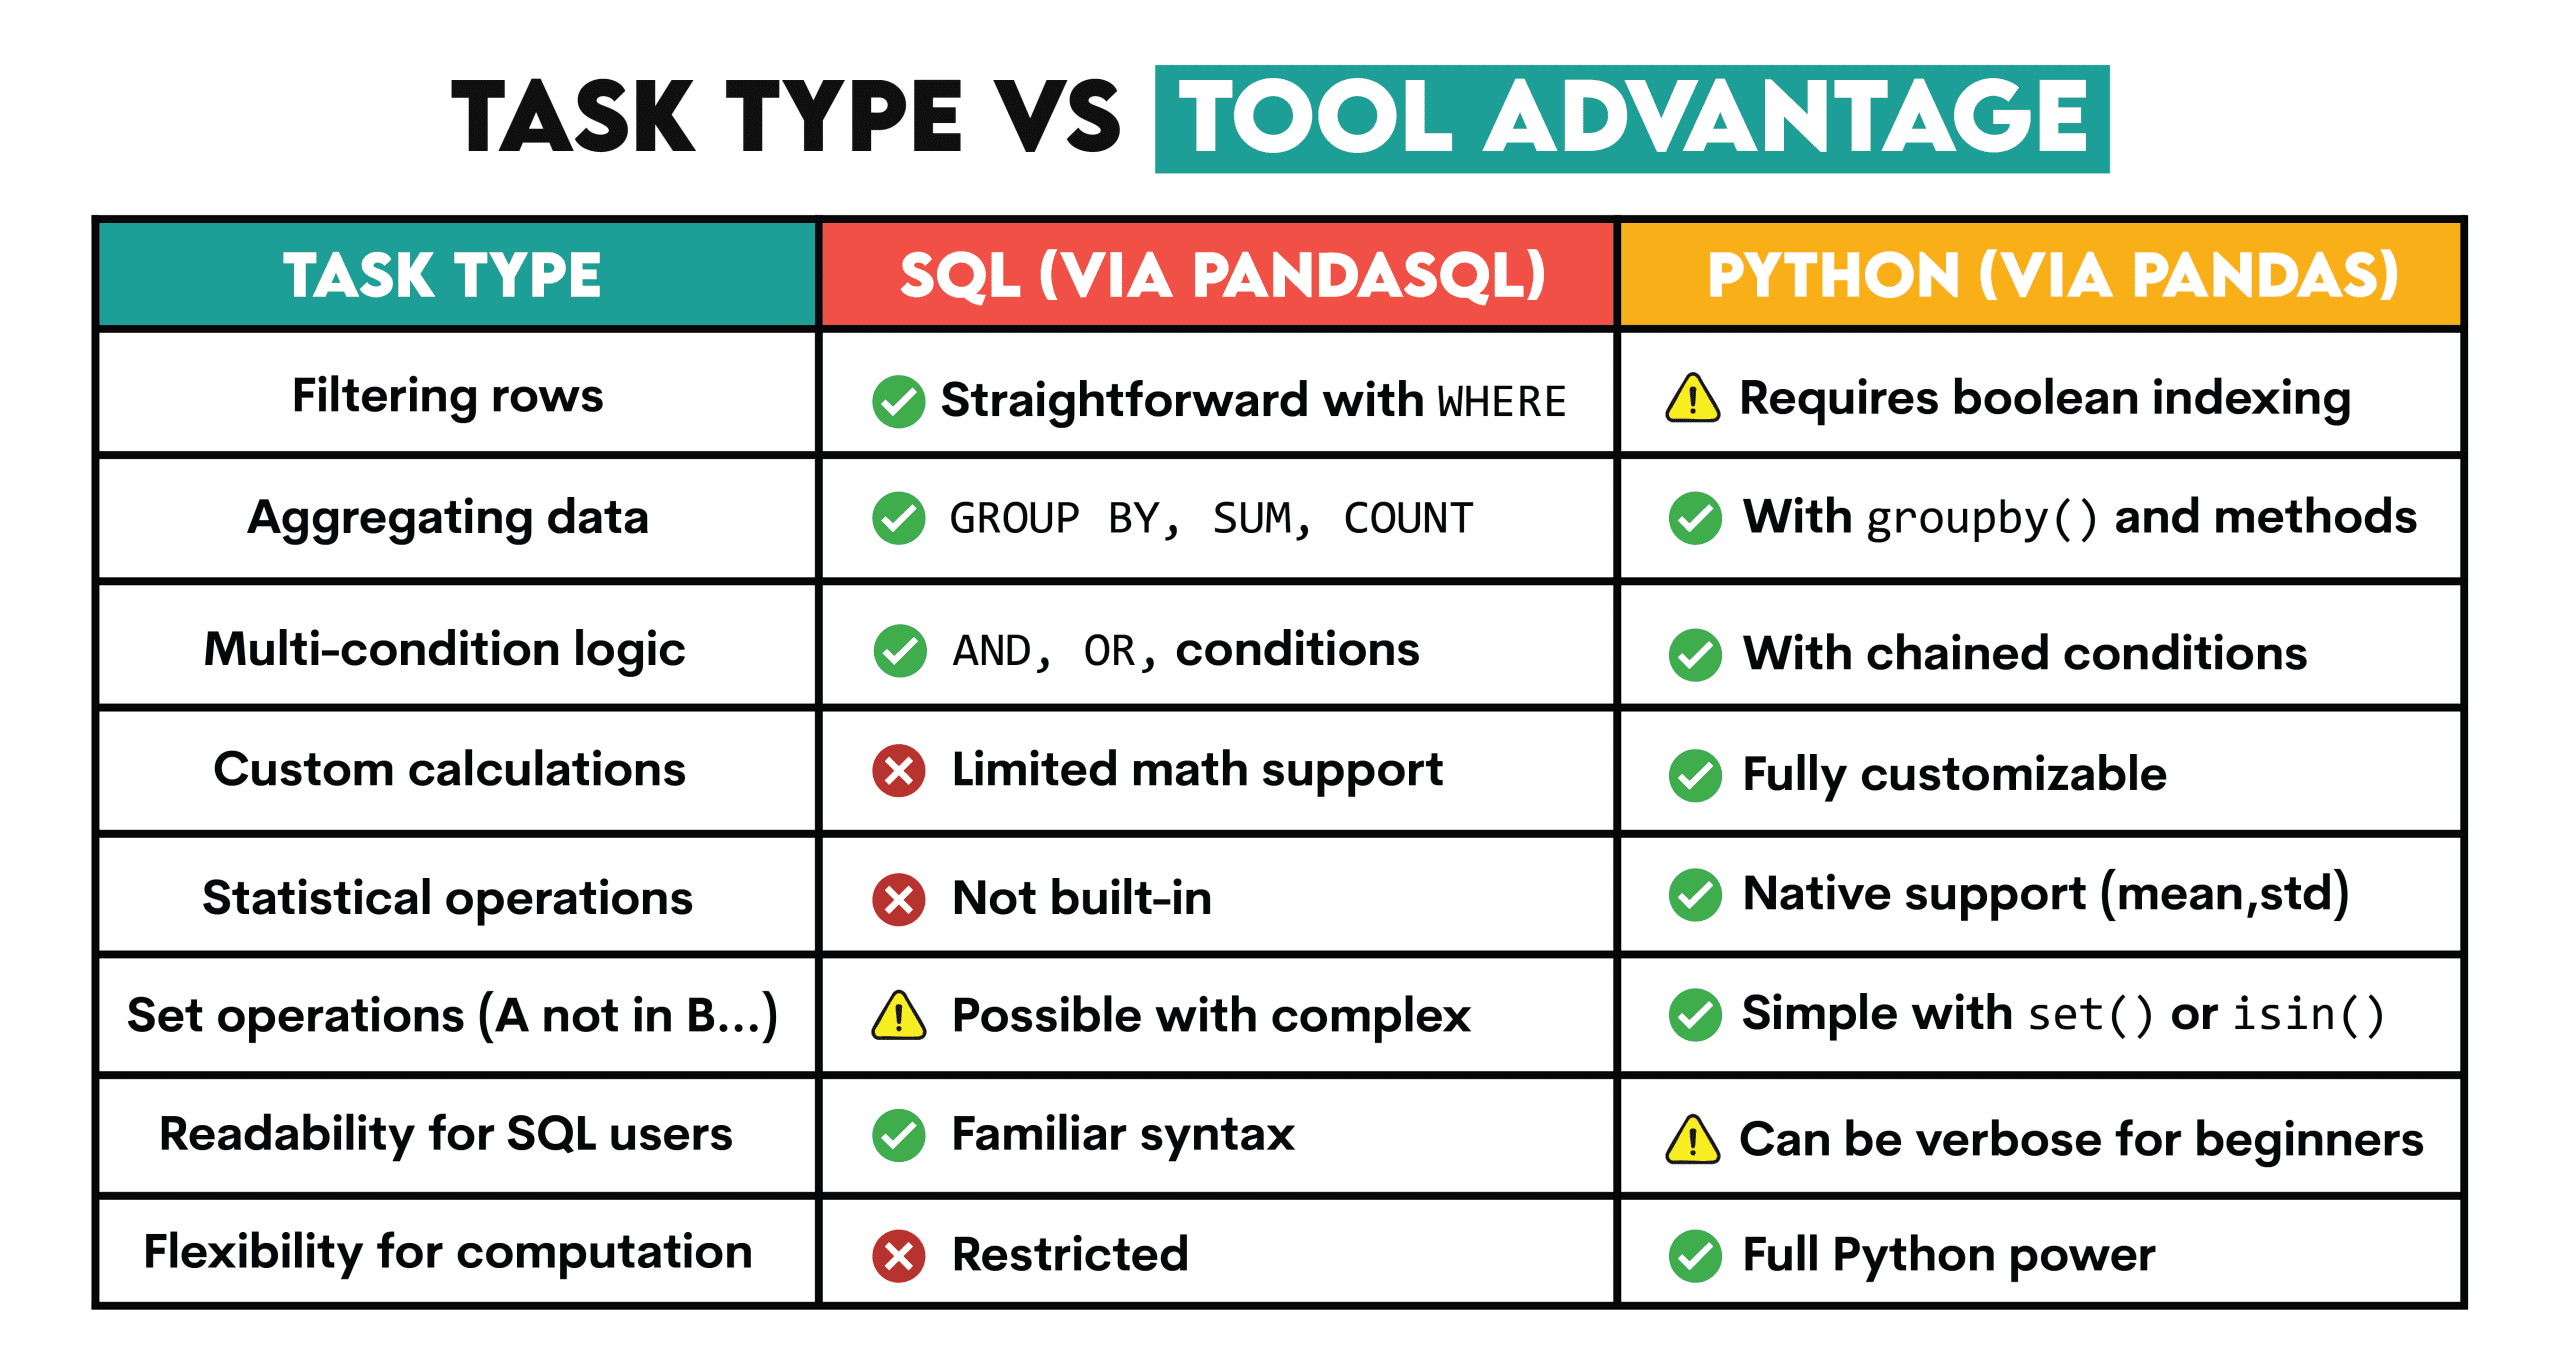
同时使用Pandas和SQL的优势
- SQL 可轻松实现数据筛选、聚合,或多条件逻辑。
- Python 则提供了高级统计分析、定制计算以及SQL之外的集合运算能力。
当二者结合时,SQL简化数据筛选,而Python增强了分析灵活性。
在Jupyter Notebook中运行pandasql
要在Jupyter Notebook中运行pandasql,可以先使用如下代码:
import pandas as pd
from pandasql import sqldf
run = lambda q: sqldf(q, globals())
然后,你可以像这样运行SQL:
run("""
SELECT *
FROM df
LIMIT 10;
""")
在本文接下来的内容中,我们会直接展示SQL代码,而不再重复展示run函数。
接下来,我们将通过一个Uber真实项目看看SQL与Pandas结合的效果。
实战案例:分析Uber司机绩效数据
在这个数据分析项目中,Uber要求我们分析司机绩效数据,并评估奖金发放策略。

数据探索与分析
加载初始数据集
import pandas as pd
import numpy as np
df = pd.read_csv('dataset_2.csv')
查看数据
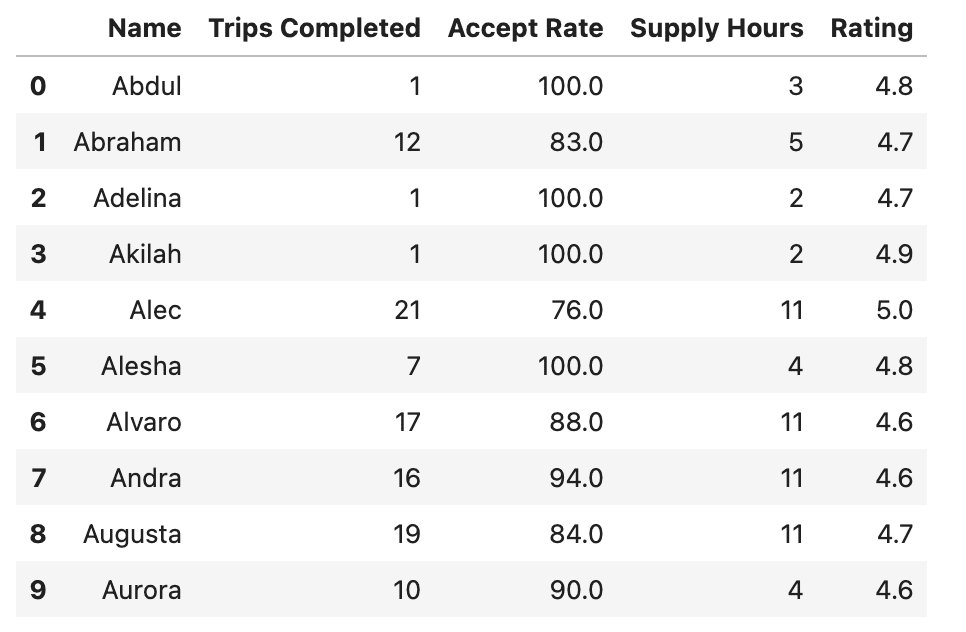
df.head(10)
数据集包含:
- 驾驶员姓名
- 完成的行程数
- 接单率(接受行程请求的百分比)
- 总在线时长
- 平均评分
验证列名:
df.info()
数据集包含5列,没有缺失值。
问题一:谁符合奖金方案1?
方案1条件:
- 在线 ≥ 8小时
- 接单率 ≥ 90%
- 完成行程 ≥ 10
- 评分 ≥ 4.7
奖金:每位符合条件司机奖励 50美元
步骤1:SQL筛选符合条件的司机
opt1_eligible = run("""SELECT NameFROM   dfWHERE  `Supply Hours`    >=  8AND  `Trips Completed` >= 10AND  `Accept Rate`     >= 90AND  Rating            >= 4.7;
""")
opt1_eligible
步骤2:Pandas计算奖金总额
payout_opt1 = 50 * len(opt1_eligible)
print(f"Option 1 payout: ${payout_opt1:,}")
问题二:计算奖金方案2的总额
方案2条件:
- 行程 ≥ 12
- 评分 ≥ 4.7
奖金:每单奖励4美元
步骤1:SQL筛选符合条件的司机
opt2_drivers = run("""SELECT Name,`Trips Completed`FROM   dfWHERE  `Trips Completed` >= 12AND  Rating            >= 4.7;
""")
opt2_drivers.head()
步骤2:Pandas计算奖金
total_trips   = opt2_drivers["Trips Completed"].sum()
option2_bonus = 4 * total_trips
print(f"Total trips: {total_trips},  Option-2 payout: ${option2_bonus}")
问题三:符合方案1但不符合方案2的司机
步骤1:SQL建立两个集合
opt1_drivers = run("""SELECT NameFROM   dfWHERE  `Supply Hours`    >=  8AND  `Trips Completed` >= 10AND  `Accept Rate`     >= 90AND  Rating            >= 4.7;
""")opt2_drivers = run("""SELECT NameFROM   dfWHERE  `Trips Completed` >= 12AND  Rating            >= 4.7;
""")
步骤2:Python集合运算
only_opt1 = set(opt1_drivers["Name"]) - set(opt2_drivers["Name"])
count_only_opt1 = len(only_opt1)
print(f"Drivers qualifying for Option 1 but not Option 2: {count_only_opt1}")
问题四:低绩效却高评分的司机比例
条件: 行程 < 10,接单率 < 90%,评分 ≥ 4.7
SQL筛选:
low_kpi_df = run("""SELECT *FROM   dfWHERE  `Trips Completed` < 10AND  `Accept Rate`     < 90AND  Rating            >= 4.7;
""")
Pandas计算比例:
num_low_kpi   = len(low_kpi_df)
total_drivers = len(df)
percentage    = round(100 * num_low_kpi / total_drivers, 2)
print(f"{num_low_kpi} out of {total_drivers} drivers ⇒ {percentage}%")
问题五:不与Uber合作时的年利润
SQL计算年收入与支出:
taxi_stats = run("""
SELECT200*6*(52-3)                      AS annual_revenue,((200+500)*(52-3) + 400*12)       AS annual_expenses
""")
Pandas计算利润与利润率:
rev  = taxi_stats.loc[0, "annual_revenue"]
cost = taxi_stats.loc[0, "annual_expenses"]profit  = rev - cost
margin  = round(100 * profit / rev, 2)print(f"Revenue  : ${rev:,}")
print(f"Expenses : ${cost:,}")
print(f"Profit   : ${profit:,}    (margin: {margin}%)")
问题六:购买新车后维持利润需增加的周收入
SQL计算新的支出:
new_exp = run("""
SELECT40000             AS car,200*1.05*(52-3)   AS gas,400*0.80*12       AS insurance
""")
new_cost = new_exp.sum(axis=1).iloc[0]
Pandas计算所需增加的周收入:
old_rev    = 58800
old_profit = 19700
old_margin = old_profit / old_rev
weeks      = 49new_rev_required = new_cost / (1 - old_margin)
total_increase = new_rev_required - old_rev
weekly_bump = round(total_increase / weeks, 2)print(f"Required weekly gross-fare increase = ${weekly_bump}")
总结
通过pandasql将SQL与Python结合,我们解决了六类问题。
- SQL 在结构化数据的快速筛选与汇总方面表现突出;
- Python 在数值计算与动态分析方面更具优势。
二者结合让整个分析流程更加高效、直观。