【QT】-怎么实现瀑布图
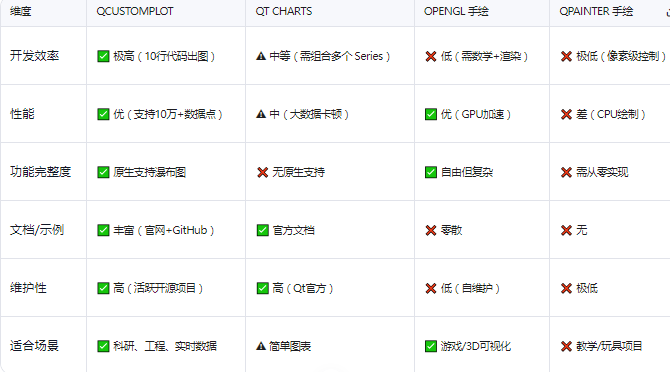
为什么 QCustomPlot 是最科学的选择?
一、QCustomPlot 实现瀑布图步骤(附代码)
步骤 1:下载并集成 QCustomPlot
官网下载:https://www.qcustomplot.com/
将 qcustomplot.h 和 qcustomplot.cpp 加入你的项目
在 .pro 文件中添加:
QT += widgets printsupport
HEADERS += qcustomplot.h
SOURCES += qcustomplot.cpp
步骤 2:创建瀑布图核心代码
#include "qcustomplot.h"// 假设你有一个二维数据:data[time][frequency] = amplitude
QVector<QVector<double>> waterfallData; // 你的瀑布图数据void setupWaterfallPlot(QCustomPlot *customPlot)
{// 1. 创建 ColorMap(瀑布图本质是颜色映射图)QCPColorMap *colorMap = new QCPColorMap(customPlot->xAxis, customPlot->yAxis);customPlot->addPlottable(colorMap);// 2. 填充数据int timePoints = waterfallData.size();      // 时间点数量int freqPoints = waterfallData[0].size();   // 频率点数量colorMap->data()->setSize(timePoints, freqPoints);colorMap->data()->setRange(QCPRange(0, timePoints-1), QCPRange(0, freqPoints-1));for (int t = 0; t < timePoints; ++t) {for (int f = 0; f < freqPoints; ++f) {colorMap->data()->setCell(t, f, waterfallData[t][f]);}}// 3. 设置颜色渐变(如:蓝-绿-红)QCPColorGradient gradient;gradient.setColorStopAt(0, QColor(0, 0, 255));     // 蓝色(低能量)gradient.setColorStopAt(0.5, QColor(0, 255, 0));   // 绿色(中能量)gradient.setColorStopAt(1, QColor(255, 0, 0));     // 红色(高能量)colorMap->setGradient(gradient);// 4. 设置坐标轴标签customPlot->xAxis->setLabel("Time (s)");customPlot->yAxis->setLabel("Frequency (Hz)");// 5. 刷新显示customPlot->rescaleAxes();customPlot->replot();
}
步骤 3:实时更新瀑布图(如频谱分析)
// 每次获取新数据时调用
void updateWaterfall(QCustomPlot *customPlot, const QVector<double> &newSpectrum)
{QCPColorMap *colorMap = qobject_cast<QCPColorMap*>(customPlot->plottable(0));if (!colorMap) return;int timePoints = colorMap->data()->keySize();int freqPoints = colorMap->data()->valueSize();// 数据滚动:旧数据前移,新数据插入最后一行for (int t = 0; t < timePoints - 1; ++t) {for (int f = 0; f < freqPoints; ++f) {double val = colorMap->data()->cell(t+1, f);colorMap->data()->setCell(t, f, val);}}// 插入新频谱数据for (int f = 0; f < freqPoints; ++f) {colorMap->data()->setCell(timePoints-1, f, newSpectrum[f]);}customPlot->replot();
}
效果预览
你的瀑布图将显示为:
频率 (Hz)
^
| 红色(高能量)
| 绿色(中能量)
| 蓝色(低能量)
±---------------> 时间 (s)
X轴:时间(或帧号)
Y轴:频率(或通道)
颜色:能量强度(通过 QCPColorGradient 自定义)
🧩 二、为什么不用 Qt Charts?
Qt Charts 的 QLineSeries + QAreaSeries 可以模拟瀑布图,但:
❌ 无原生支持 → 需手动绘制数百条曲线
❌ 性能差 → 大数据量卡顿
❌ 颜色映射难 → 需为每条曲线单独设色
❌ 无滚动优化 → 实时更新效率低
Qt Charts 适合:柱状图、折线图、饼图等基础图表,不适合科学/工程级瀑布图。
三、高级优化技巧(QCustomPlot)
- 提升性能(大数据量)
colorMap->setInterpolate(false); // 关闭插值,提升速度
colorMap->setDataRange(QCPRange(0, 100)); // 固定数据范围,避免重计算 - 添加颜色标尺(Legend)
cpp
QCPColorScale *colorScale = new QCPColorScale(customPlot);
customPlot->plotLayout()->addElement(0, 1, colorScale); // 右侧添加标尺
colorMap->setColorScale(colorScale);
colorScale->axis()->setLabel(“Amplitude (dB)”); - 支持鼠标交互(缩放/拖拽)
cpp
customPlot->setInteractions(QCP::iRangeDrag | QCP::iRangeZoom);
四、行业应用案例
音频分析:实时频谱瀑布图(如 Audacity)
通信系统:信道频率响应随时间变化
雷达/声呐:目标回波强度-距离-时间图
医疗设备:脑电图(EEG)时频分析
✅ 五、总结:最科学方案
Qt 瀑布图 = QCustomPlot + QCPColorMap + 数据滚动更新
优势:
✅ 10行代码快速出图
✅ 支持实时大数据(>10万点)
✅ 原生颜色映射 + 标尺
✅ 开源免费(GPL/商业许可可选)
✅ 活跃社区(GitHub 5k+ stars)
学习资源:
官网:https://www.qcustomplot.com/
GitHub:https://github.com/DerManu/QCustomPlot
示例:下载包中的 colorMapDemo 和 realtimeDataDemo