《潮汐调和分析原理和应用》之四S_Tide使用1
1、readme
% s_readme.m
%
% 潮汐分析工具箱 S_TIDE
% 由
% 潘海东(中国海洋大学)开发
% 现就职于第一海洋研究所
% 版本 1.23 2021年12月13日
%
% 请引用以下文献:
%1. Pan, H., X. Lv, Y. Wang, P. Matte, H. Chen, and G. Jin (2018), Exploration of Tidal-Fluvial Interaction in the Columbia River Estuary Using S_TIDE, J. Geophys. Res. Ocean., 123(9), 6598–6619, doi:10.1029/2018JC014146.
%2. Jin, G., H. Pan, Q. Zhang, X. Lv, W. Zhao, and Y. Gao (2018), Determination of Harmonic Parameters with Temporal Variations: An Enhanced Harmonic Analysis Algorithm and Application to Internal Tidal Currents in the South China Sea, J. Atmos. Ocean. Technol., 35(7), 1375-1398
%3. Pawlowicz, R., B. Beardsley, and S. Lentz (2002), Classical tidal harmonic analysis including error estimates in MATLAB using T_TIDE, Comput. Geosci., 28(8), 929–937
%
% 该工具箱目前包含以下 m 文件:
%
% ---用于分析
% s_tide.m - 使用增强谐波分析(EHA)对真实潮汐时间序列进行潮汐分析,不做交点订正。
% s_nodal_correction.m - 对振幅和相位进行交点订正。
%
% t_vuf.m - 计算交点订正参数(来自 T_TIDE 包)。
%
% t_astron.m - 计算天文参数(来自 T_TIDE 包)。
%
% t_getconsts.m - 获取分潮数据结构(来自 T_TIDE 包)。
%
% s_calculate_coefficient - 计算样条插值权重
%
% l_calculate_coefficient - 计算线性插值权重
%
% sinc_calculate_coefficient - 计算 sinc 插值权重
%
% s_tide_m1.m - s_tide.m 的一个修改版本
%
% s_tide_m2.m - s_tide.m 的一个修改版本
%
% s_tide_m3.m - s_tide.m 的一个修改版本(用于卫星数据)
%
% s_tide_m4.m - s_tide.m 的一个修改版本(用于卫星数据)
%
% s_tide_m5.m - s_tide_m2.m 的一个修改版本(用于非均匀数据)
%
% s_tide_m55.m - s_tide_m5.m 的一个修改版本(增加权重)
%
% s_tide_m6.m - s_tide_m4.m 的一个修改版本(用于非均匀卫星数据)
%
% s_tide_m66.m - s_tide_m6.m 的一个修改版本(增加权重)
%
% s_tide_m7.m - s_tide.m 的一个修改版本,专门用于估计潮汐振幅和相位的线性趋势
%
% s_tide_m8.m - s_tide_m3.m 的一个修改版本(仅使用中心时间的交点因子和角度进行交点订正)
%
% s_plot_tidal_ellipse.m - 绘制潮流椭圆
%
% s_plot_tidal_ellipse2.m - 绘制全水深潮流椭圆
%
% s_estimate_tidal_ellipse.m - 计算潮流椭圆参数
%
% s_construct.m - 根据给定的潮汐信息(无交点因子/角度)重构水位
%
% s_nodal_cal.m - 计算给定潮汐的交点因子和角度
%
% s_construct2.m - 根据给定的潮汐信息及交点因子/角度(中心时间)重构水位
%
% s_construct3.m - 根据给定的潮汐信息及交点因子/角度(每个时间点)重构水位
%
% s_tidalcharacter.m - 根据给定水位计算基本潮汐特征(如偏度、高潮和低潮)
%
% s_alias.m - 计算由长周期卫星采样引起的混叠周期
%
% s_minimumLOR.m - 计算解析给定分潮所需的最小记录长度
%
% s_quasi_HA.m - 准调和分析(适用于观测时长超过24小时但少于13天的数据)
%
% s_quasi_HA2.m - 针对非均匀观测的准调和分析
%
% s_eot.m - 读取 EOT20 潮汐模型的函数
%
% s_equilibrium_tide.m - 计算平衡潮水位
%
%s_estimate_max_tidalcurrent.m - 在给定 N 个分潮的情况下计算最大可能潮流速度
%
% s_tdd.m - 在给定 N 个分潮的情况下计算理论深度基准面
%
% s_rotation_spectra.m - 计算海流的旋转谱
%
% s_rtl.m - 根据给定水位计算乘潮(及减潮)水位
%
% s_rtl2.m - s_rtl.m 的一个修改版本
%
% s_modaldecomposition.m - 内潮的动力模态分解
%
% STIDE.mlapp - 可生成 S_TIDE 图形用户界面 (GUI) 的代码
%
% s_earthtide.m - 计算理论地球潮汐/海洋潮汐势的函数
%
% s_draw_tidalchart - 使用 EOT20 海洋潮汐模型绘制同潮图的功能
%
% s_inertial - 计算能产生与给定分潮频率相近的近惯性振荡的纬度
%
% s_highlowtides - 对高潮和低潮进行调和分析的函数
%
% ---用于文档
%
% s_readme.m - 本文件。
%
% ---用于演示
%
% s_demo.m - 一个使用钏路(Kushiro)验潮站数据的简短示例。
% S_TIDE 工具箱教程 / S_TIDE toolbox tutorial
% S_TIDE GUI.zip - 用于实现 S_TIDE 的图形用户界面 (GUI) 可执行文件
% mytide.m mytide2.m mytide3.m -用于演示和教学的经典潮汐调和分析简短代码
%
% 还包含各种数据文件:
%
% t_constituents.mat - 分潮数据结构。
%
% h572a.nc - 来自 UHSLC 的阿斯托利亚(Astoria)逐时水位数据
%
% kushiro.mat - 用作示例的逐时水位数据集(从 PSMSL 获取),数据从 1993/01/01 开始
% imf.mat - 对钏路水位数据进行经验模态分解 (EMD) 得到的模态。
% K1_amp_hilo.mat - 希洛(Hilo)站的 K1 分潮月振幅
% N2_amp_astoria.mat - 阿斯托利亚(Astoria)站的 N2 分潮月振幅
% wt_SIO.mat - 锡永(Sion)站的每日水温
% satellite.mat - 从卫星(T/P, J1, J2)获得的 14.1633N,113.6244E 处的海面高度
%
% tidalcurrents.mat - 南海(SCS)观测到的潮流速度(u 和 v 分量)
%
% Qingdao.mat - 青岛站的一个月水位数据。
% M2_ocean_eot20.mat - M2 分潮的 EOT20 潮汐模型
% S2_ocean_eot20.mat - S2 分潮的 EOT20 潮汐模型
% K1_ocean_eot20.mat - K1 分潮的 EOT20 潮汐模型
% O1_ocean_eot20.mat - O1 分潮的 EOT20 潮汐模型
% data.mat - 南海某站点的深度、密度和海流数据
%
% 问题或意见请联系:
% 潘海东(中国海洋大学) 2017/05/02 现就职于第一海洋研究所
% 邮箱:panhaidong@fio.org.cn panhaidong_phd@qq.com
% S_TIDE 用户 QQ 群号:485997351
%%%%== https://www.researchgate.net/profile/Haidong-Pan ================!!!!
%%%%========== https://space.bilibili.com/548420599 ================!!!
%%%%========== http://blog.sina.com.cn/panhaidongphd ================!!!
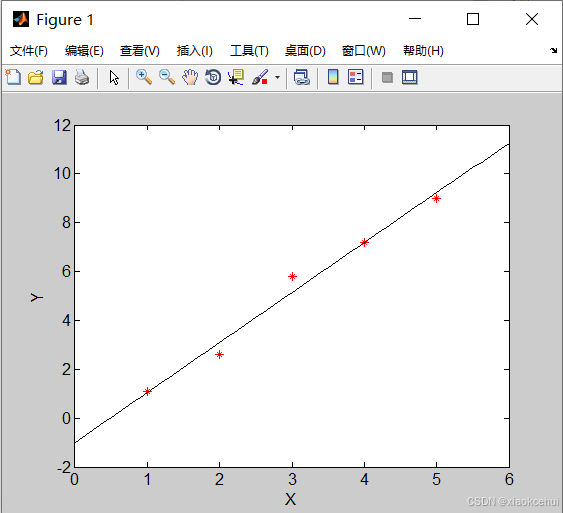
2、直线拟合
%直线拟合
X=[1;2;3;4;5];
Y=[1.1;2.6;5.8;7.2;9];
K=[1,1;2,1;3,1;4,1;5,1];
U=inv(K'*K)*K'*Y; %对应公式1-5,inv为求逆运算
%求得a为2.04,b为-0.98
plot(X,Y,'r*');hold on;
x1=0:0.1:6;
plot(x1,U(1)*x1+U(2),'k')
set(gca,'Fontsize',12,'linewidth',1.1);
xlabel('X');ylabel('Y');
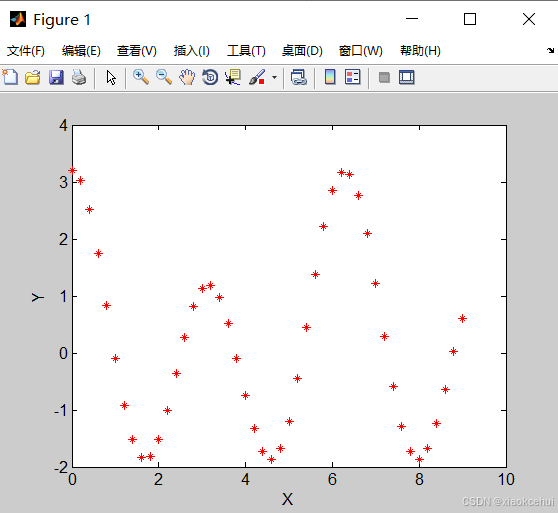
3、曲线拟合
%曲线拟合
t=0:0.2:9;t=t';
x1=cos(t);x2=2*cos(2*t);Z=0.2+x1+x2;
for i=1:length(t)
K(i,1)=1;
K(i,2)=cos(t(i)); %对应公式1-10
K(i,3)=cos(2*t(i));
end
U=inv(K'*K)*K'*Z; %求解振幅和平均水位
plot(t,Z,'r*');hold on;
set(gca,'Fontsize',12,'linewidth',1.1);
xlabel('X');ylabel('Y');
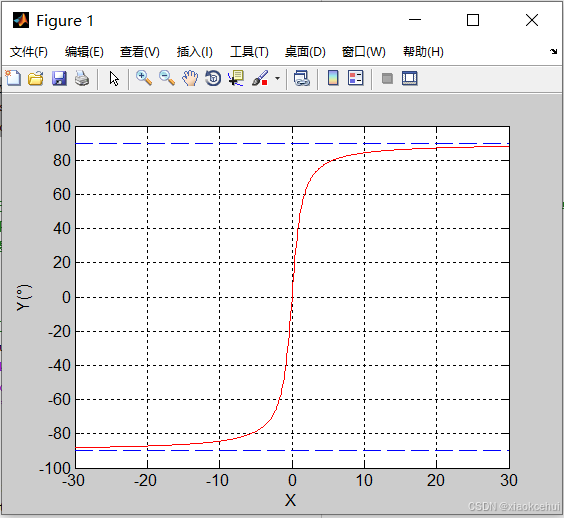
4、绘制反正切函数
当a小于0时,arctan函数输出的迟角需要加上180°,当b小于0且a大于0时,arctan函数输出的迟角需要加上360°。
%绘制反正切函数
t=-30:0.1:30;
Y=atand(t);
plot(t,Y,'r');hold on;grid on
line([-30 30],[90 90],'linestyle','--')
line([-30 30],[-90 -90],'linestyle','--')
set(gca,'Fontsize',12,'linewidth',1.1);
ylabel('Y(°)');xlabel('X')
5、不考虑交点改正,调和分析
%不考虑交点改正,调和分析函数
%输入参数xin是观测水位,缺测标记为NaN (not a number),tides是使用哪些分潮,ntides是分潮的个数,dt是观测的时间间隔(单位是小时)。
%输出参数xout是回报的水位,S是平均海平面,H是分潮振幅,G是分潮迟角。
%频率是度cph/360度,所以转成弧度时,需乘2pi
function [S,H,G,coef,xout,ju]=mytide(xin,tides,ntides,dt)
%潘海东(海洋一所)
%email:panhaidong@fio.org.cn;panhaidong_phd@qq.com
disp(['************* written by Haidong Pan(FIO) ******************** '])
load t_constituents %加载分潮信息(包括名称,频率等)
for i=1:ntides
ju(i)=strmatch(upper(tides(i)),const.name);
fu(i)=const.freq(ju(i)); %获取分潮频率
end
nobs=length(xin);
gd=find(isfinite(xin(1:nobs))); %识别缺测(NaN,或无穷大),缺测行最终要删除,返回有效行索引
nobsu=nobs-rem(nobs-1,2);
t=dt*([1:nobs]'-ceil(nobsu/2)); %平移到中间时刻,0-t变成-t/2-t/t
JJ=length(fu);
tc=zeros(nobs,1+2*JJ,'double');tc(:,1)=1;
for i=1:nobs
for j=1:JJ
tc(i,1+j)=cos((2*pi)*t(i)*fu(j));
tc(i,1+JJ+j)=sin((2*pi)*t(i)*fu(j)); %对应公式1-16
end
end
tci=tc';
coef=(tci(:,gd)*tc(gd,:))\(tci(:,gd)*xin(gd)); %对应公式1-17
S=coef(1);aa=coef(2:JJ+1);bb=coef(JJ+2:2*JJ+1);
H=sqrt(aa.^2+bb.^2);G=atand(bb./aa); %对应公式1-18
G(aa<0)=G(aa<0)+180;G(G<0)=G(G<0)+360; %迟角调整,反正切函数
xout=tc*coef;
varx=cov(xin(gd));varxp=cov(xout(gd));
disp(['var(x)= ',num2str(varx),' var(xp)= ',num2str(varxp)]);
disp(['percent var predicted/var original=',num2str(100*varxp/varx),'%']);
disp(['RMSE=',num2str(sqrt(nanmean((xout(gd)-xin(gd)).^2)))]);
disp(['Max error=',num2str(max(abs(xout(gd)-xin(gd))))]);
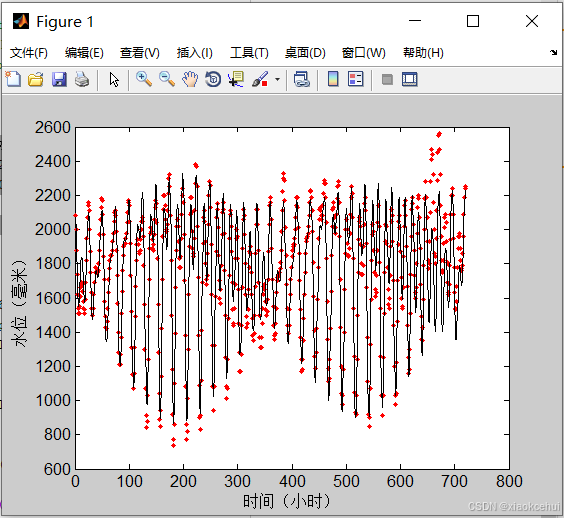
%调用mytide函数
load kushiro.mat %加载S_TIDE工具包提供的水位观测
[S,H,G,coef,xout,ju]=mytide(kushiro(1:720),{'M2';'S2';'K1';'O1';'M4'},5,1);
plot(kushiro(1:720),'r.','Markersize',10);hold on;plot(xout,'k','linewidth',1.1);
set(gca,'Fontsize',12,'linewidth',1.1);
ylabel('水位(毫米)');xlabel('时间(小时)')
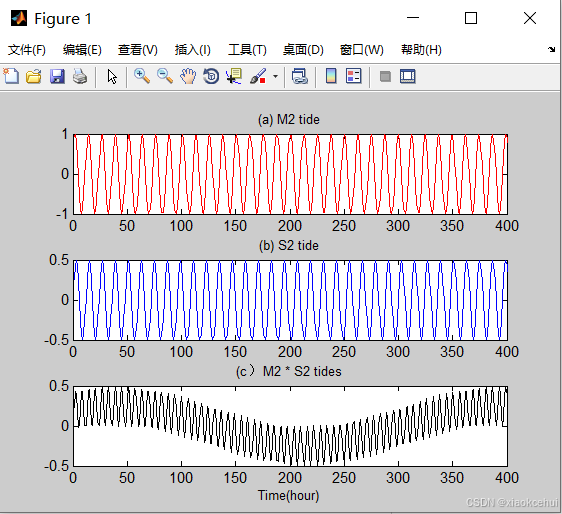
6、M2和S2非线性作用,M2,S2两个分潮相乘(matlab的点乘)
M2被称为太阴主要半日分潮,因为M2分潮是由月亮对地球海水的引力引起的半日分潮。同理,S2分潮是太阳对地球海水引力引起的半日分潮。MS4被称为太阴太阳浅水1/4日分潮,其主要是由太阴分潮M2和太阳分潮S2在浅水里发生非线性相互作用产生的。
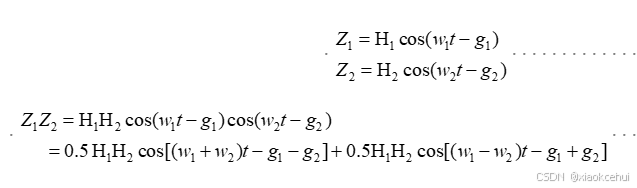
Z1和Z2分别代表M2和S2潮波,他们的非线性相互作用诞生了MS4分潮(即w1+w2项)和长周期分潮Msf(即w1-w2项,周期为14.76天)。
function [sumconsti,consti]=s_construct(tides,amp,pha,dt,length);
%Haidong Pan(Ocean University of China) 2020/12/24
%email:1027128116@qq.com panhaidong_phd@qq.com
% S_TIDE users QQ group number 485997351
%the input:
% tides:the names of input tidal constituents
% amp: the amplitudes of input tidal constituents
% pha: the phases of input tidal constituents
% dt: the interval of constructed time series (unit:hour)
% length: the total length of constructed tiem series
%
% the output:
% consti: the water levels induced by individual tidal constituent
% sumconsti: the sum of tidal water levels
%
%see s_demo.m for examples
nobsu=length-rem(length-1,2);% makes series odd to give a center point
t=dt*([1:length]')-ceil(nobsu/2); % Time vector for entire time series,
load t_constituents
J=size(amp);JJ=J(find(J>1));
if isempty(JJ)==1
JJ=1;
end
if iscell(tides)==1
for i=1:JJ
ju(i)=strmatch(upper(tides(i)),const.name);
fu(i)=const.freq(ju(i));
end
end
consti=zeros(JJ,length,'double');
t=t';
for j=1:JJ
aa=amp(j)*cosd(pha(j));bb=amp(j)*sind(pha(j));
consti(j,:)=aa*cos((2*pi)*t*fu(j))+bb*sin((2*pi)*t*fu(j));
end
sumconsti=sum(consti);
if JJ==1
sumconsti=consti;
end
%调用s_contruct
tides={'M2';'S2'};
amp=[1,0.5];pha=[180,90];dt=1;length=8760;
[sumconsti,consti]=s_construct(tides,amp,pha,dt,length);
subplot(3,1,1);plot(consti(1,:),'r-');xlim([0 400])
title('(a) M2 tide');
set(gca,'Fontsize',11,'linewidth',1.1);
subplot(3,1,2);plot(consti(2,:),'b-');xlim([0 400])
title('(b) S2 tide');
set(gca,'Fontsize',11,'linewidth',1.1);
subplot(3,1,3);plot(consti(1,:).*consti(2,:),'k-');
xlim([0 400])
title('(c)M2 * S2 tides');xlabel('Time(hour)')
set(gca,'Fontsize',11,'linewidth',1.1);