OCELOT 2023:细胞 - 组织相互作用场景下的细胞检测挑战赛|文献速递-深度学习人工智能医疗图像
Title
题目
OCELOT 2023: Cell detection from cell–tissue interaction challenge
OCELOT 2023:细胞 - 组织相互作用场景下的细胞检测挑战赛
01
文献速递介绍
深度学习在计算病理学中的应用及OCELOT 2023挑战赛背景 深度学习彻底革新了计算病理学领域,为全切片图像(Whole Slide Images, WSI)的分析与解读提供了前所未有的能力。这些技术进步使得研究人员能够在细胞层面(Coudray et al., 2018;Sirinukunwattana et al., 2016)和组织层面(Gelasca et al., 2008;Wang et al., 2016)更精准、高效地识别与疾病相关的特征(Komura & Ishikawa, 2018)。由此,该领域在癌症认知与治疗方面的潜力得以释放,例如发现并研发新型生物标志物(Mobadersany et al., 2018;Skrede et al., 2020)、简化癌症驱动突变的识别流程(Schaumberg et al., 2016)、实现肿瘤纯度量化(Gong et al., 2020),以及自动化癌症分级(Bulten et al., 2020)。归根结底,这些技术有望推动个性化医疗发展,改善患者预后。 在计算病理学中,细胞检测与组织分割是两项关键的量化任务。细胞检测需在组织学图像中定位并分类各类细胞,为理解细胞组成与分布提供核心信息(Sirinukunwattana et al., 2016),同时也是重要的量化生物标志物来源(Lara et al., 2021)。近年来,精准的肿瘤细胞检测已在临床应用中展现出显著价值,例如在结直肠癌分子分析中的肿瘤纯度评估(Schoenpflug et al., 2025),以及乳腺癌筛查中基于AI的HER2(人表皮生长因子受体2)评分(Kapil et al., 2024)。此外,淋巴细胞检测技术还可拓展至肿瘤浸润淋巴细胞评估与治疗反应预测领域(Choi et al., 2023)。 另一方面,组织分割需勾勒出不同的组织区域,为分析和识别组织结构提供支持(Ronneberger et al., 2015)。通过结合这两项任务,研究人员能够构建“复合生物标志物”——这类标志物可捕捉细胞特征与更大尺度组织特征之间的关联,为深入理解疾病机制与潜在治疗靶点提供更丰富的视角(Ma et al., 2017;Park et al., 2022)。 然而,传统细胞检测模型面临诸多挑战。由于全切片图像尺寸庞大,且需观察细胞的细微细节,这类模型通常在高放大倍数、有限视野(Field-of-View, FoV)的图像上运行,这使其难以将细胞类型置于更宏观的组织结构中进行情境化分析。这种局限导致模型过度依赖细胞的外观细节,却忽略了细胞在组织区域内的空间排列与相互作用。与之相反,病理学家在检查过程中会通过动态缩放镜头(放大或缩小)克服这一问题,整合宏观与微观视角以形成全面评估。这种多尺度分析方法让他们能够在周围组织的背景下理解细胞特征,但深度学习模型中却鲜有能实现该能力的设计。尽管部分方法尝试采用更大的视野(Van Rijthoven et al., 2021;Bai et al., 2020;Yuan et al., 2024),但正如Ryu等人(2023)所指出的,这些方法缺乏必要的标注以确保语义理解——而语义理解对于精准解读细胞-组织关系至关重要。 为解决“缺乏专门用于利用细胞-组织关系进行细胞检测的公共数据集”这一问题,并推动该研究领域发展,研究者发起了“OCELOT 2023:基于细胞-组织相互作用的细胞检测”(OCELOT 2023)挑战赛。该挑战赛旨在汇聚学术界的研究思路,验证“理解细胞-组织相互作用是在计算病理学任务中实现卓越性能的关键”这一假设。挑战赛数据集源自306张经苏木精-伊红(hematoxylin and eosin, H&E)染色的癌症基因组图谱(TCGA, Hutter & Zenklusen, 2018)全切片图像,涵盖6个器官,包含“细胞检测标注”与“组织分割标注”(两类标注存在重叠)。参赛团队需开发能够利用这些多尺度标注、加深对细胞-组织关系理解的模型。 最终,利用细胞-组织关系的模型方案显著提升了性能:表现最优的参赛模型在F1分数上实现大幅提升,相较于未利用该关系的“仅关注细胞”基准模型,最高提升了7.99分。这一结果证实了“融入细胞与组织间的关联可构建更精准、高效的模型”这一假设。本文将对参赛团队采用的方法进行对比分析,重点阐述OCELOT 2023挑战赛中涌现的创新性技术策略。 全文结构如下:第2节将介绍OCELOT 2023挑战赛,包括其目标、数据集及赛事组织方式;第3节将描述表现最优的参赛方案及其核心技术组件;第4节将呈现挑战赛的结果;最后,第5节将总结研究结论并展望未来方向。本文严格遵循生物医学图像分析挑战赛(BIAS)指南(Maier-Hein et al., 2020),对挑战赛的设计、实施与结果进行透明且标准化的阐述。
Abatract
摘要
Pathologists routinely alternate between different magnifications when examining Whole-Slide Images, allowing them to evaluate both broad tissue morphology and intricate cellular details to form comprehensivediagnoses. However, existing deep learning-based cell detection models struggle to replicate these behaviorsand learn the interdependent semantics between structures at different magnifications. A key barrier in the fieldis the lack of datasets with multi-scale overlapping cell and tissue annotations. The OCELOT 2023 challenge wasinitiated to gather insights from the community to validate the hypothesis that understanding cell and tissue(cell–tissue) interactions is crucial for achieving human-level performance, and to accelerate the research inthis field. The challenge dataset includes overlapping cell detection and tissue segmentation annotations fromsix organs, comprising 673 pairs sourced from 306 The Cancer Genome Atlas (TCGA) Whole-Slide Imageswith hematoxylin and eosin staining, divided into training, validation, and test subsets. Participants presentedmodels that significantly enhanced the understanding of cell–tissue relationships. Top entries achieved up toa 7.99 increase in F1-score on the test set compared to the baseline cell-only model that did not incorporatecell–tissue relationships. This is a substantial improvement in performance over traditional cell-only detectionmethods, demonstrating the need for incorporating multi-scale semantics into the models. This paper providesa comparative analysis of the methods used by participants, highlighting innovative strategies implemented inthe OCELOT 2023 challenge.
病理学家与深度学习细胞检测模型的多尺度分析及OCELOT 2023挑战赛研究 病理学家在检查全切片图像(Whole-Slide Images)时,通常会交替使用不同放大倍数的镜头。通过这种方式,他们既能评估宏观的组织形态,也能观察细微的细胞细节,进而形成全面的诊断结论。然而,现有的基于深度学习的细胞检测模型难以复现这类操作,也无法学习不同放大倍数下组织结构间相互关联的语义信息。该领域的一个核心障碍在于,缺乏带有多尺度重叠细胞与组织标注的数据集。 为解决这一问题,OCELOT 2023挑战赛应运而生。该挑战赛旨在汇聚学术界与工业界的研究思路,验证“理解细胞与组织(细胞-组织)间的相互作用是实现人类级检测性能的关键”这一假设,并推动该领域的研究进程。 挑战赛所用数据集包含来自6个器官的“细胞检测标注”与“组织分割标注”(两类标注存在重叠区域),共计673组标注对。这些数据源自306张经苏木精-伊红(hematoxylin and eosin,HE)染色的癌症基因组图谱(The Cancer Genome Atlas,TCGA)全切片图像,并被划分为训练集、验证集与测试集三个子集。 参赛团队提交的模型显著加深了对“细胞-组织关系”的理解。表现最优的模型在测试集上的F1分数,相较于未融入细胞-组织关系的“仅关注细胞”基准模型,最高提升了7.99。这一成果相较于传统的“仅检测细胞”方法,实现了性能上的大幅突破,也证明了在模型中融入多尺度语义信息的必要性。 本文对参赛团队所采用的方法进行了对比分析,重点阐述了OCELOT 2023挑战赛中涌现的创新性技术策略。
Conclusion
结论
In clinical practice, pathologists need to understand the context andtissue architectures when identifying cells. While this is common practice, there was limited work around modeling cell–tissue relationshipsin computational pathology, in particular, due to the lack of annotateddatasets for this purpose. The OCELOT 2023 challenge was organizedto gather insights from the community and foster research around thisproblem. Our analysis of the top-performing submissions reveals thatincorporating tissue context consistently enhances overall performanceacross all metrics and cell types, validating the hypothesis proposedby Ryu et al. (2023). Notably, the integration of cell–tissue relationships yielded more substantial improvements in precision compared torecall, suggesting that tissue context primarily aids in reducing falsepositive detection rather than increasing sensitivityThe solutions generally exhibited better performance for TumorCells (TC) than Background Cells (BC), but they also demonstrated atrade-off in handling atypical cell–tissue pairings. This was observed inthe marginal improvement, or even degraded performance, in detectingBC on Cancer Area (CA) and TC on Background (BG) tissues. Thisfinding highlights the challenge of developing models that effectivelybalance the use of tissue context with cell-specific features, particularlyin less common scenarios. However, such cases may hold significantclinical importance. Therefore, this is still an area for future research.The challenge saw a diverse range of methodologies for leveragingcell–tissue relationships. While it is challenging to clearly attributeperformance differences to specific methodological choices, we cangather some insights. For instance, teams that integrated cell–tissuerelationships during the training process generally achieved higherprecision and overall F1 scores. On the other hand, teams that appliedheuristics during post-training showed better recall, but comparablylower F1 scores.
Future research could focus on developing more sophisticated methods for integrating cell and tissue information that maintain high performance in both typical and atypical cell–tissue pairings. In particular,improving model sensitivity to rare but clinically important cell–tissuecombinations without compromising overall performance would be animportant area for investigation. Additionally, refining the definitionsof tissue contexts and cell classes may prove beneficial, potentiallyallowing models to leverage known biological priors more effectively.This approach could not only enhance the performance of the model,but also improve interpretability, which is crucial for clinical applications in computational pathology. Additionally, for this challenge weselected high-quality ROIs to validate the algorithmic advantages ofmodeling cell–tissue relationships. Hence, future work could furtherevaluate how the proposed methods perform in low-quality scenarios(e.g., ROIs with artifacts) that may exist in clinical practice, bringingthese methods one step closer to real-world applications.In conclusion, the OCELOT 2023 challenge has demonstrated thepotential of leveraging cell–tissue relationships in computational pathology, while also highlighting important challenges that need to beaddressed for reliable application in clinical settings. These insights willserve as a valuable foundation for future research and development incell detection and classification in histopathology images.
临床实践与OCELOT 2023挑战赛研究结论 在临床实践中,病理学家识别细胞时需理解其所处的背景环境与组织结构。尽管这是常规操作,但在计算病理学领域,围绕“细胞-组织关系建模”的研究却相对有限,这在很大程度上是由于缺乏用于此目的的标注数据集。为此,研究者组织了OCELOT 2023挑战赛,旨在汇聚学术界的研究思路,推动该问题的相关研究。 对表现最优的参赛方案分析显示,融入组织背景信息后,模型在所有指标与所有细胞类型上的整体性能均得到稳定提升,这验证了Ryu等人(2023)提出的假设。值得注意的是,细胞-组织关系的整合对“精确率”的提升幅度显著大于“召回率”,这表明组织背景信息主要有助于减少假阳性检测,而非提高灵敏度。 从细胞类型来看,各参赛方案对肿瘤细胞(TC)的检测性能普遍优于背景细胞(BC);但在处理“非典型细胞-组织配对”时,模型表现出性能权衡。具体而言,在检测“癌区(CA)中的背景细胞(BC)”与“背景组织(BG)中的肿瘤细胞(TC)”时,模型性能仅实现小幅提升,甚至出现性能下降。这一发现凸显了一个核心挑战:如何开发能在“组织背景信息”与“细胞特异性特征”之间实现有效平衡的模型,尤其是在这类少见场景中。然而,这类场景可能具有重要的临床意义,因此仍是未来的研究方向之一。 在利用细胞-组织关系的方法上,参赛方案呈现出多样性。尽管难以将性能差异明确归因于特定方法选择,但仍可得出一些关键结论:例如,在训练过程中整合细胞-组织关系的团队,其模型通常能获得更高的精确率与整体F1分数;而在训练后采用启发式方法(post-training heuristics)的团队,模型召回率表现更优,但F1分数相对较低。 未来研究可聚焦于开发更复杂的细胞与组织信息整合方法,确保模型在“典型”与“非典型”细胞-组织配对场景中均能保持高性能。尤其值得关注的是,如何在不影响整体性能的前提下,提高模型对“罕见但具有临床重要性的细胞-组织组合”的灵敏度——这将是重要的研究方向。此外,优化组织背景与细胞类别的定义也可能带来益处,有望使模型更有效地利用已知的生物学先验知识。这种方法不仅能提升模型性能,还能增强其可解释性,而可解释性对于计算病理学的临床应用至关重要。 另外,本挑战赛选取了高质量感兴趣区域(ROI)来验证“细胞-组织关系建模”的算法优势。因此,未来研究可进一步评估这些方法在“临床实践中可能存在的低质量场景”(如含伪影的ROI)中的表现,推动这些方法向实际应用更近一步。 综上,OCELOT 2023挑战赛不仅证明了在计算病理学中利用细胞-组织关系的潜力,也揭示了该领域要实现可靠临床应用仍需解决的关键挑战。这些研究发现将为“组织学图像中细胞检测与分类”的未来研发提供宝贵基础。
Results
结果
This section presents the cell detection performance and analysisof the challenge submissions. We evaluate the results in the test setusing multiple metrics: F1 score, precision, and recall. Furthermore, wepresent the results per individual cell class and inspect how the methods perform in the different tissue regions. All performance measuresare reported with their 95% confidence intervals computed throughbootstrapping with 10,000 iterations
本节将呈现挑战赛参赛方案的细胞检测性能及相关分析。我们采用F1分数、精确率和召回率等多项指标,对测试集上的结果进行评估。此外,我们还将展示各细胞类别对应的单独结果,并分析这些方法在不同组织区域中的表现。所有性能指标均附带其95%置信区间,该置信区间通过10,000次迭代的自助法(bootstrapping)计算得出。
Figure
图
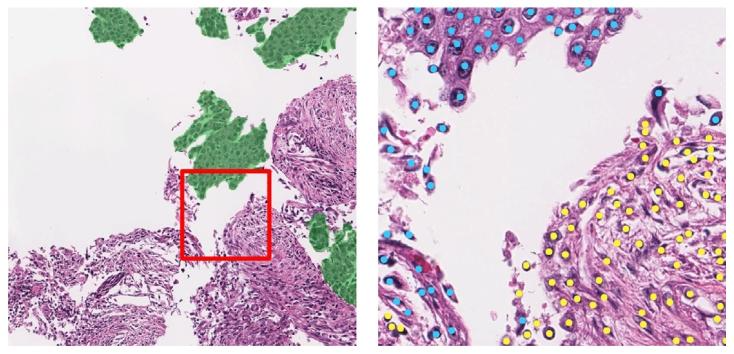
Fig. 1. A sample from the OCELOT dataset includes two input patches with theirrespective annotations. The left side shows a large FoV patch with tissue segmentation(green indicating cancer), while the right side displays a small FoV patch with cellpoint annotations (blue dots for tumor cells, yellow for background cells). A red boxoutlines the small FoV patch’s position within the large FoV patch
图 1 OCELOT 数据集样本示例,包含两个输入补丁及其各自的标注
左侧为大视野(FoV)补丁,附带组织分割标注(绿色表示癌症区域);右侧为小视野(FoV)补丁,附带细胞点标注(蓝色圆点代表肿瘤细胞,黄色圆点代表背景细胞)。红色方框标注了小视野补丁在大视野补丁中的位置。
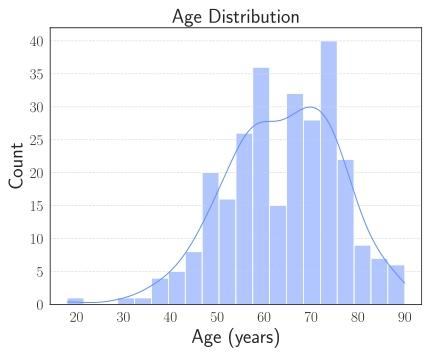
Fig. 2. Age distribution of challenge cohort.
图 2 挑战赛队列的年龄分布
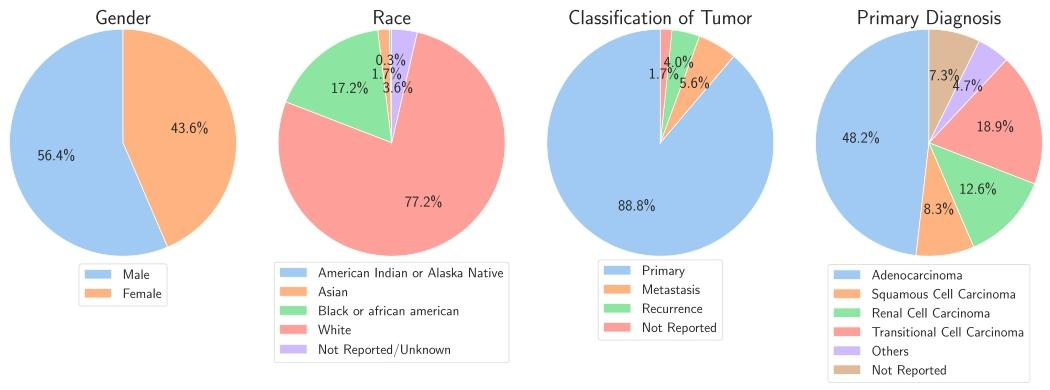
Fig. 3. Population characteristics of the challenge cohort. From left to right, pie charts display the distribution of gender, race, classification of tumor and primary diagnosis.Some detailed categories have been grouped into larger categories.
图3 挑战赛队列的人群特征 从左至右,饼图依次展示了性别分布、种族分布、肿瘤分类分布及原发诊断分布。部分细分类别已归并至更宽泛的大类中。
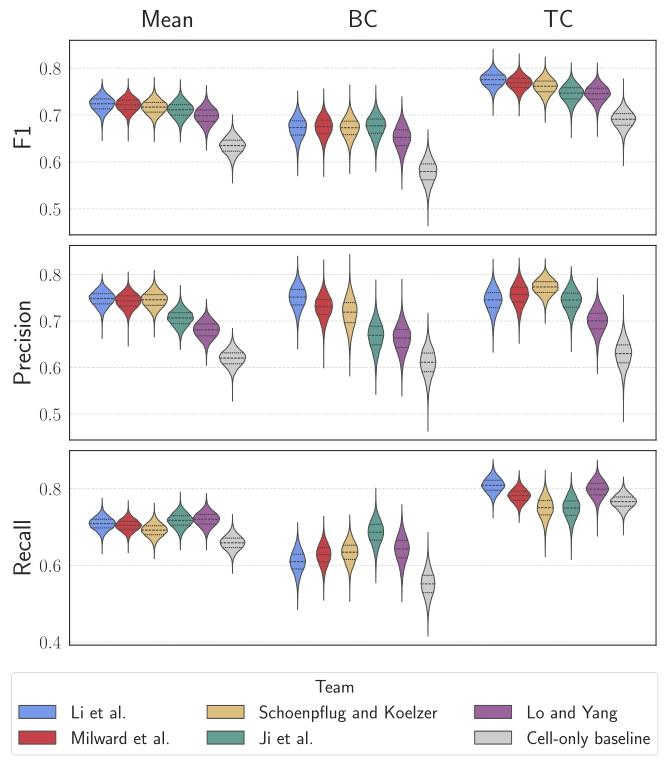
Fig. 4. Violin plots representing the F1-scores, Precision, and Recall across the fivetop-performing teams and the cell-only baseline. Columns depict the mean, BackgroundCell (BC), and Tumor Cell (TC) results, respectively
图 4 小提琴图:展示前五名团队与 “仅关注细胞” 基准模型的 F1 分数、精确率及召回率
列分别呈现平均值、背景细胞(BC)相关结果与肿瘤细胞(TC)相关结果。
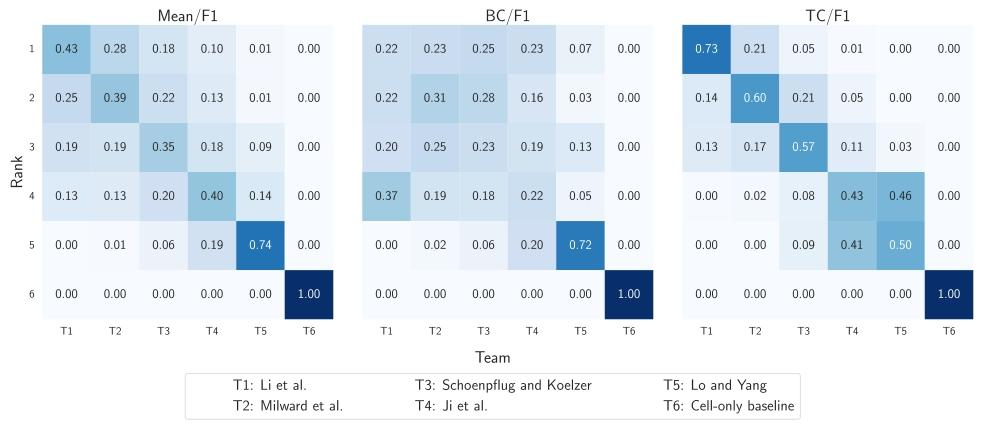
Fig. 5. Heatmaps showing the probability distribution of team rankings based on bootstrapping analysis. The panels display ranking probabilities for each team according to (left)mean F1 score across all cell classes, (middle) F1 score for Background Cells (BC), and (right) F1 score for Tumor Cells (TC). We observe the probability of each team (columns)being placed in each specific rank (rows)
图5 热力图:展示基于自助法(bootstrapping)分析的团队排名概率分布 各子图分别呈现不同评价指标下各团队的排名概率:(左图)所有细胞类别平均F1分数对应的排名概率、(中图)背景细胞(BC)F1分数对应的排名概率、(右图)肿瘤细胞(TC)F1分数对应的排名概率。通过该热力图可观察到每个团队(列)处于各特定排名(行)的概率。
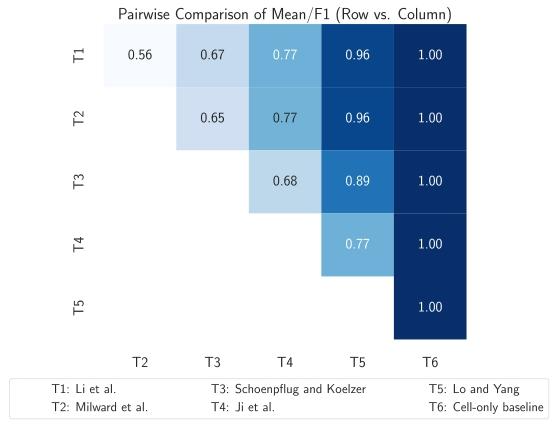
Fig. 6. Heatmap displaying pairwise ranking probabilities, where each cell represents
the probability that the row team outperforms the column team.
图6 热力图:展示两两团队间的排名概率 图中每个单元格代表“行对应团队表现优于列对应团队”的概率。
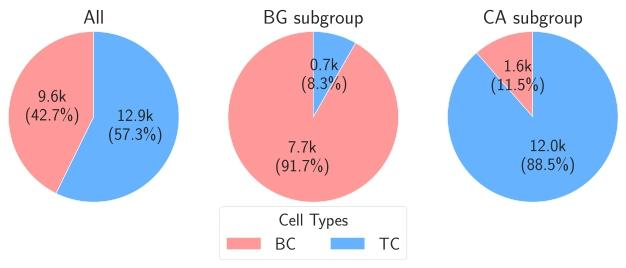
Fig. 7. Cell counts according to the tissue region class (subgroups) where the cells arelocated. The counts are based on the cell and tissue annotations. The cells located inUnknown (UNK) tissue regions are excluded. BC, TC, BG, and CA refer to BackgroundCell, Tumor Cell, Background, and Cancer Area, respectively
图7 按细胞所在组织区域类别(亚组)统计的细胞数量 该统计结果基于细胞标注与组织标注得出,其中位于未知(UNK)组织区域的细胞已被排除。图中BC、TC、BG、CA分别代表背景细胞(Background Cell)、肿瘤细胞(Tumor Cell)、背景组织(Background)及癌区(Cancer Area)。
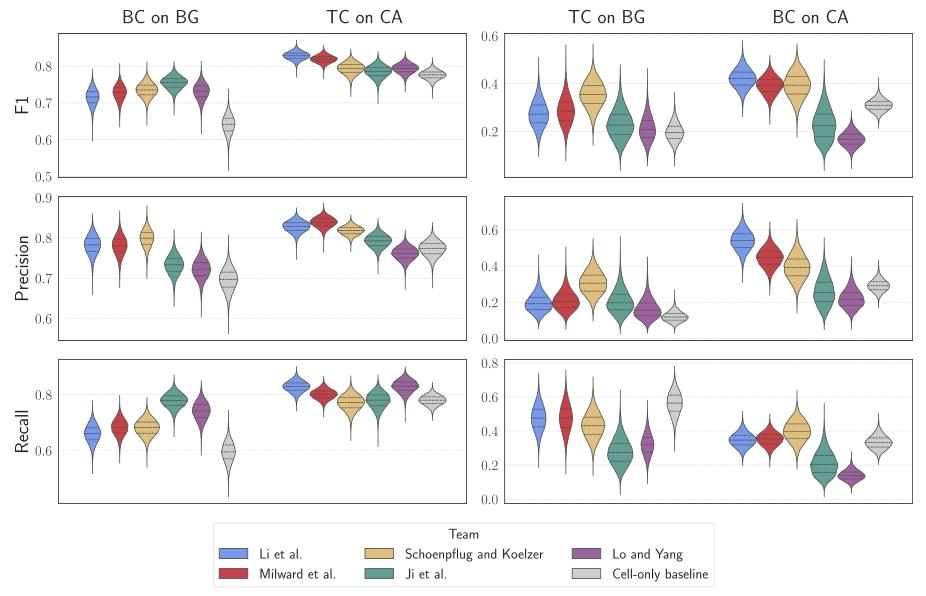
Fig. 8. Violin plots showing per-team F1-scores, precision, and recall metrics for specific cell class predictions across annotated tissue regions. The left panels illustrate the commonscenarios where Background Cells (BC) are located on Background regions (BG) and Tumor Cells (TC) are located on Cancer Areas (CA). The right panels represent the less commonscenarios where Tumor Cells (TC) are found on Background regions (BG) and Background Cells (BC) appear in Cancer Areas (CA)
图8 小提琴图:展示各团队在不同标注组织区域内特定细胞类别预测任务的F1分数、精确率及召回率 左图组呈现常见场景:背景细胞(BC)位于背景组织区域(BG)、肿瘤细胞(TC)位于癌区(CA);右图组呈现少见场景:肿瘤细胞(TC)位于背景组织区域(BG)、背景细胞(BC)出现在癌区(CA)。
Table
表
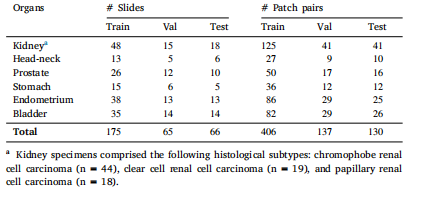
Table 1Number of slides and cell–tissue patch pairs per organ in the OCELOT dataset
表 1 OCELOT 数据集中各器官对应的切片数量与细胞 - 组织补丁对数量
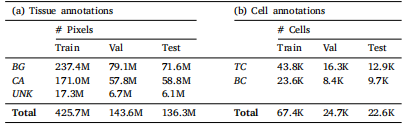
Table 2Number of annotated pixels for the tissue segmentation task and number of annotated
cells for the cell detection task in the OCELOT dataset
表2 OCELOT数据集中组织分割任务的标注像素数量与细胞检测任务的标注细胞数量
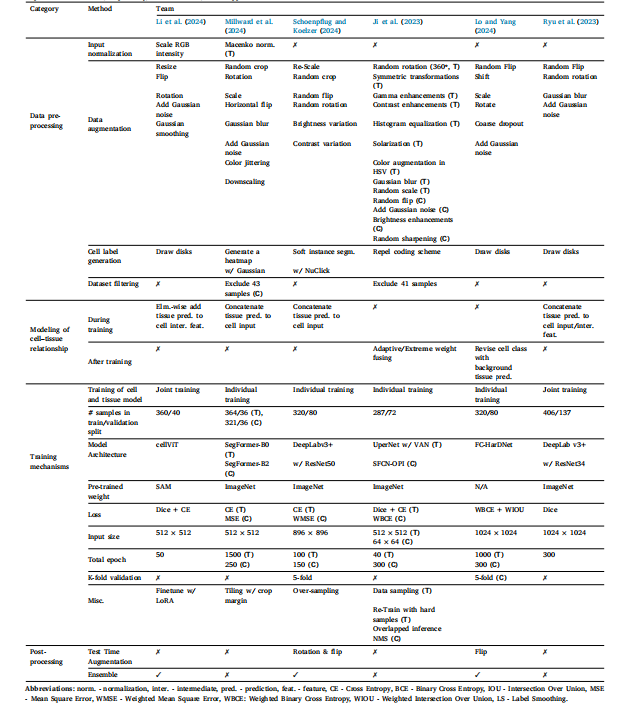
Table 3An overview of the top performing methods submitted to the OCELOT challenge. If a given operation or technique is applied to only one of the cell or tissue models, it is indicatedin parenthesis as C or T, respectively; if not indicated, it was applied to both models.
表3OCELOT挑战赛中表现最优的参赛方法概览 若某一操作或技术仅应用于细胞模型或组织模型中的任意一种,则会在括号内分别标注为C(代表细胞模型)或T(代表组织模型);若未标注,则表示该操作或技术对两种模型均适用。
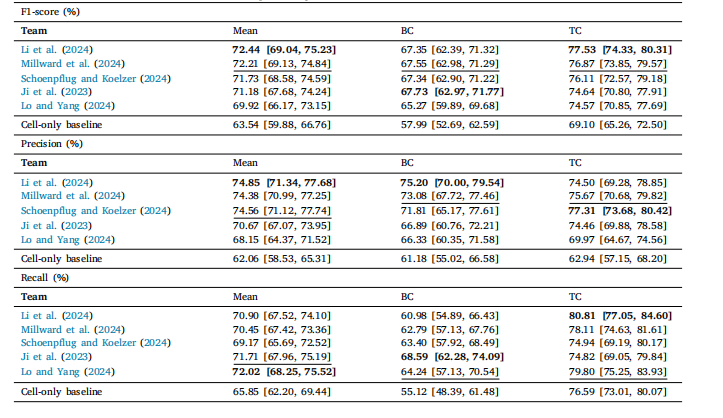
Table 4Cell detection performance of the challenge submissions and the cell-only baseline in terms of F1 score (%). The first column shows the meanacross classes, followed by the score of each class. BC and TC stand for Background Cell and Tumor Cell, respectively. Values in brackets arethe 95% confidence intervals. In the table, the best performing score in each column is marked in bold, while the second best is underlined.
表4 挑战赛参赛方案与“仅关注细胞”基准模型的细胞检测性能(以F1分数百分比计) 第一列展示各类别(细胞)的平均F1分数,后续列依次展示每个类别的F1分数。其中,BC代表背景细胞(Background Cell),TC代表肿瘤细胞(Tumor Cell)。括号内数值为95%置信区间。表中每列性能最优的分数以粗体标注,次优分数以下划线标注。
