容器方式安装Prometheus以及Grafana
推荐方案:Spring Boot + Micrometer + Prometheus + Grafana
-
后端埋点:使用 Micrometer + Prometheus
略 -
prometheus安装和配置:
- prometheus安装:
prometheus.yml :
global:scrape_interval: 15sscrape_configs:- job_name: 'ai-backend'metrics_path: '/prometheus'static_configs:- targets: [ '192.168.18.7:8083' ] sudo docker run -d -p 9090:9090 \-v $(pwd)/prometheus.yml:/etc/prometheus/prometheus.yml \prom/prometheus
是使用 Docker 来运行 Prometheus 容器,它的工作原理如下:
docker run:启动一个容器。
-d:后台运行。
-p 9090:9090:将宿主机的 9090 端口映射到容器内部的 9090 端口(Prometheus 默认端口)。
-v $(pwd)/prometheus.yml:/etc/prometheus/prometheus.yml:将本地当前目录下的 prometheus.yml 挂载为容器内的配置文件。
prom/prometheus:这是官方提供的 Prometheus 镜像名,如果本地没有会自动从 Docker Hub 下载。
✅ 所以,不需要提前安装 Prometheus,Docker 会自动拉取并运行它的镜像。
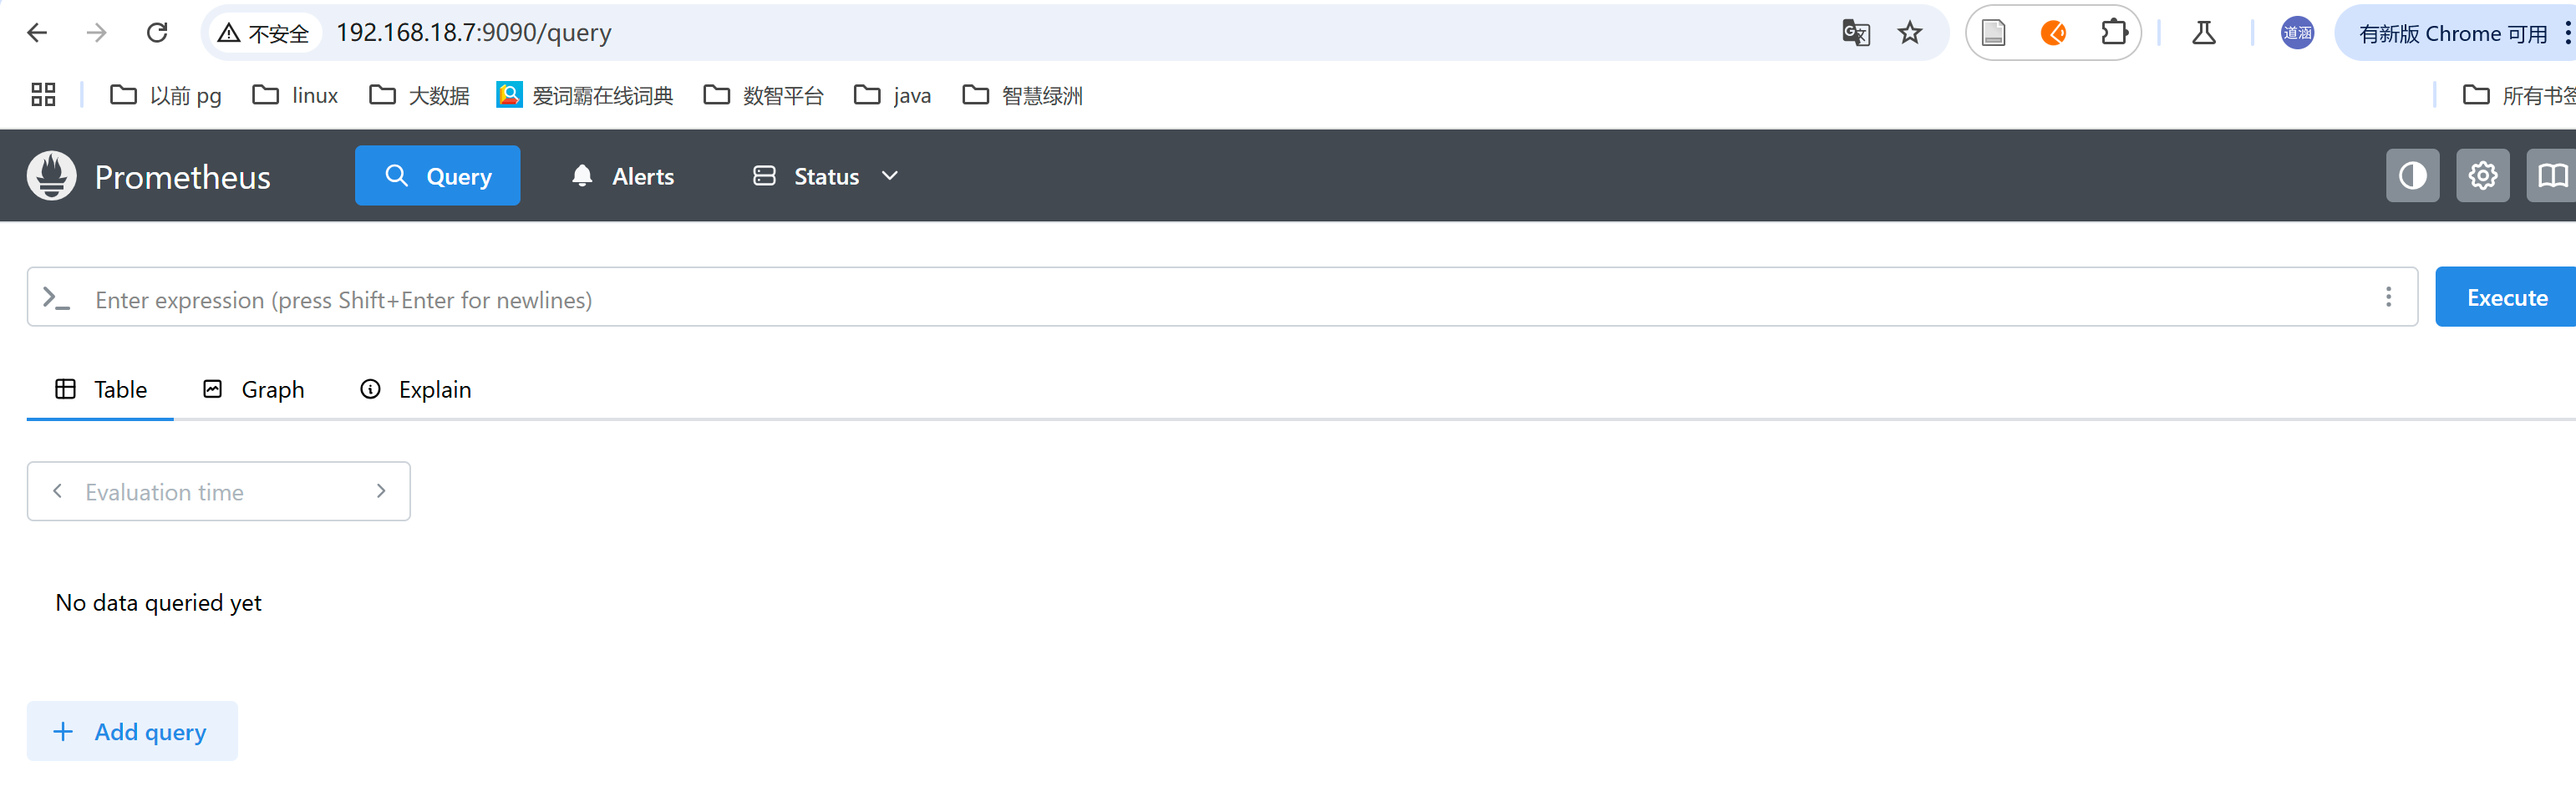
此时就已可以访问到Prometheus Web UI了,只是还没有任何数据:
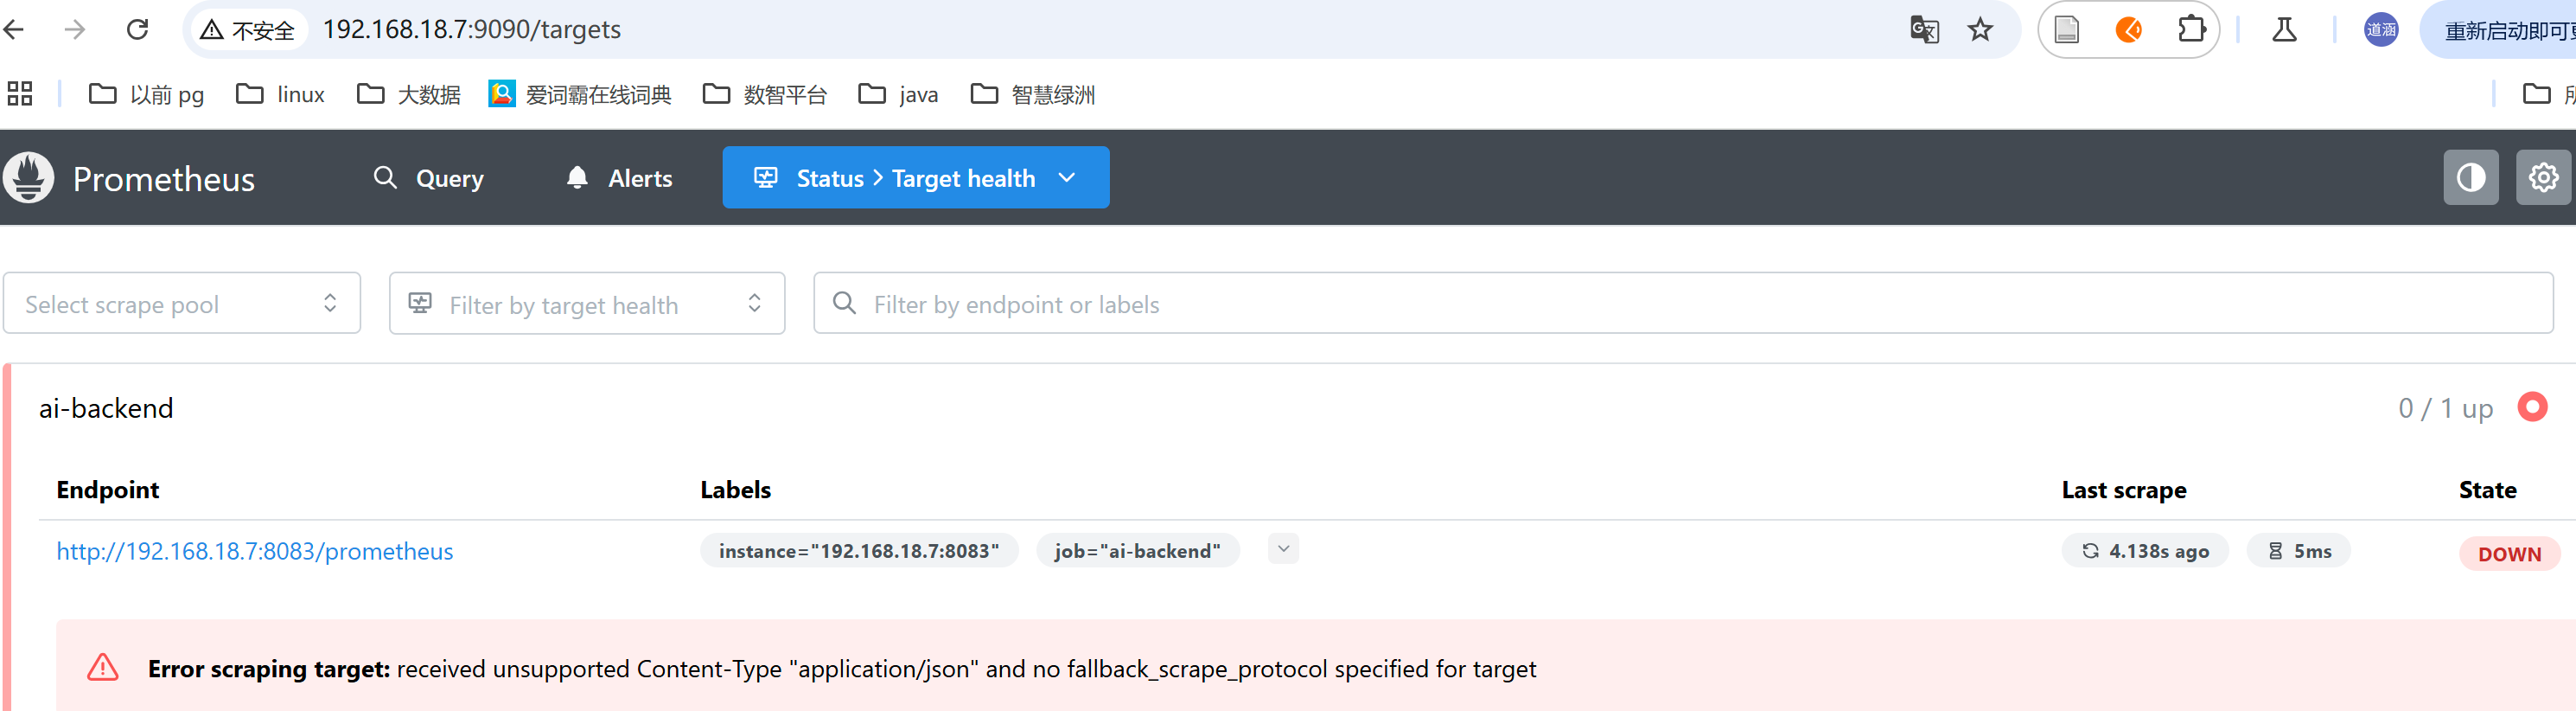
Prometheus 的 Targets 页面也显示配置的监控目标(job_name)也还没有UP:
后来我改了prometheus.yml, 保存数据为10年, 据说不设的话默认只保存15天, 以及挂载本地目录到容器内(为了持久化)
global:scrape_interval: 15sscrape_configs:- job_name: 'ai-backend' #后来改为test了metrics_path: '/prometheus'static_configs:- targets: [ '192.168.18.7:8083' ]- job_name: 'sdh'metrics_path: '/prometheus'static_configs:- targets: [ '192.168.18.113:8083' ]你运行 Prometheus 容器时要这么做:
mkdir -p ./prometheus-data
sudo chown -R 65534:65534 /home/yrd/ai-backend/monitor/prometheus-datasudo docker run -d \-p 9090:9090 \-v $(pwd)/prometheus.yml:/etc/prometheus/prometheus.yml \-v $(pwd)/prometheus-data:/prometheus/data \prom/prometheus \--config.file=/etc/prometheus/prometheus.yml \--storage.tsdb.path=/prometheus/data \--storage.tsdb.retention.time=10y \--web.enable-admin-api   #为了通过http接口 delete
- Prometheus http api
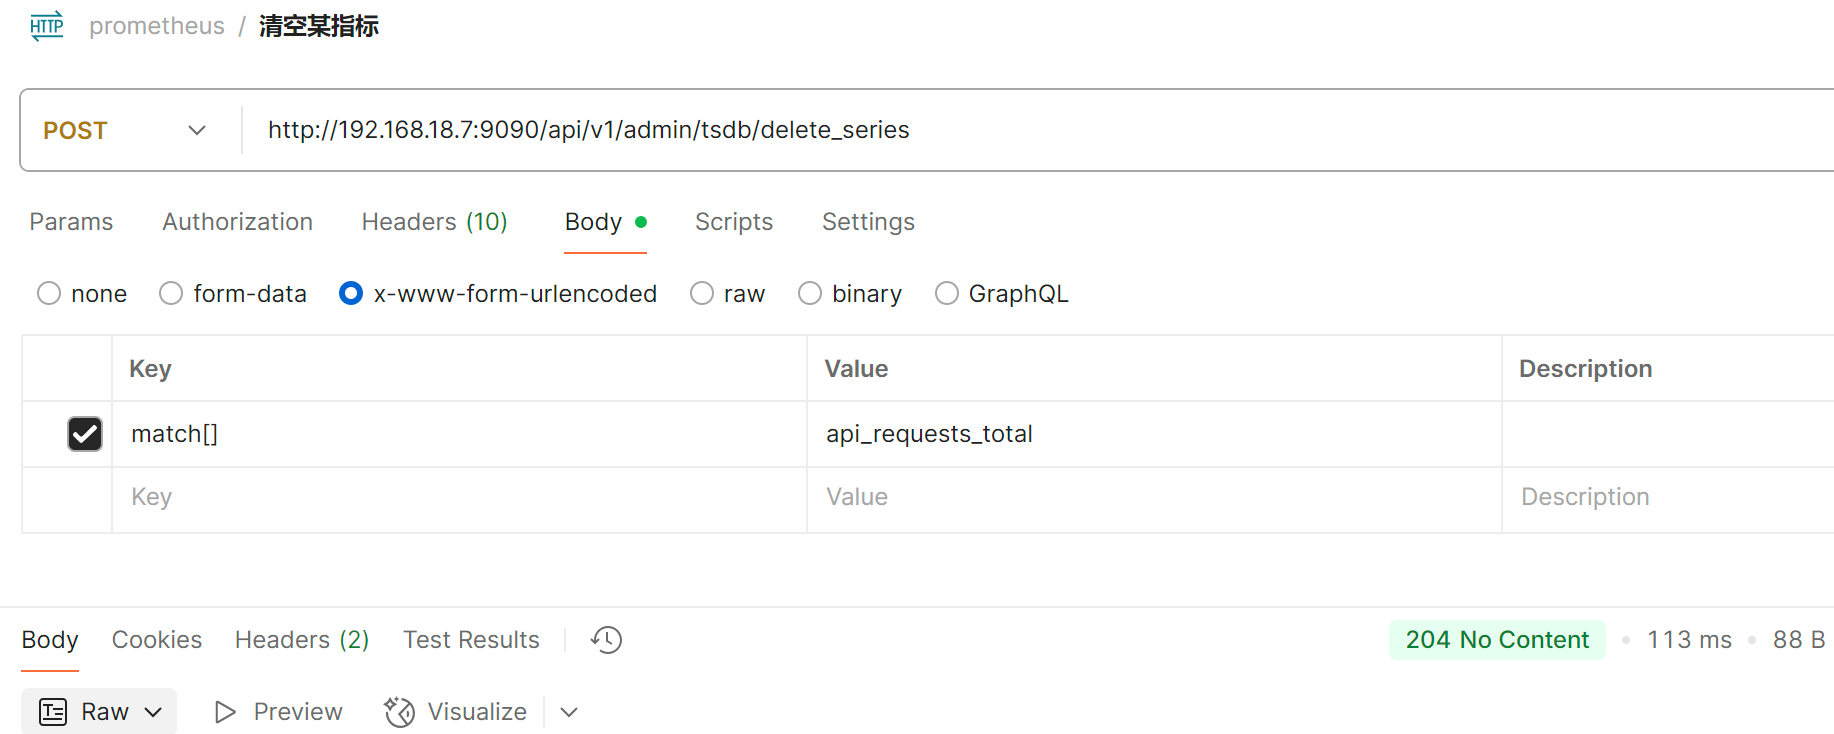
比如清空Prometheus中的某指标 :
curl -X POST http://localhost:9090/api/v1/admin/tsdb/delete_series \-H 'Content-Type: application/x-www-form-urlencoded' \--data-urlencode 'match[]=api_requests_total'
如下图所示,没有任何有效返回,但是可以验证api_requests_total数据已经删除
- Prometheus Web UI 的一些查询
过去50分钟内的api调用次数查询:
changes(api_requests_seconds_count[50m])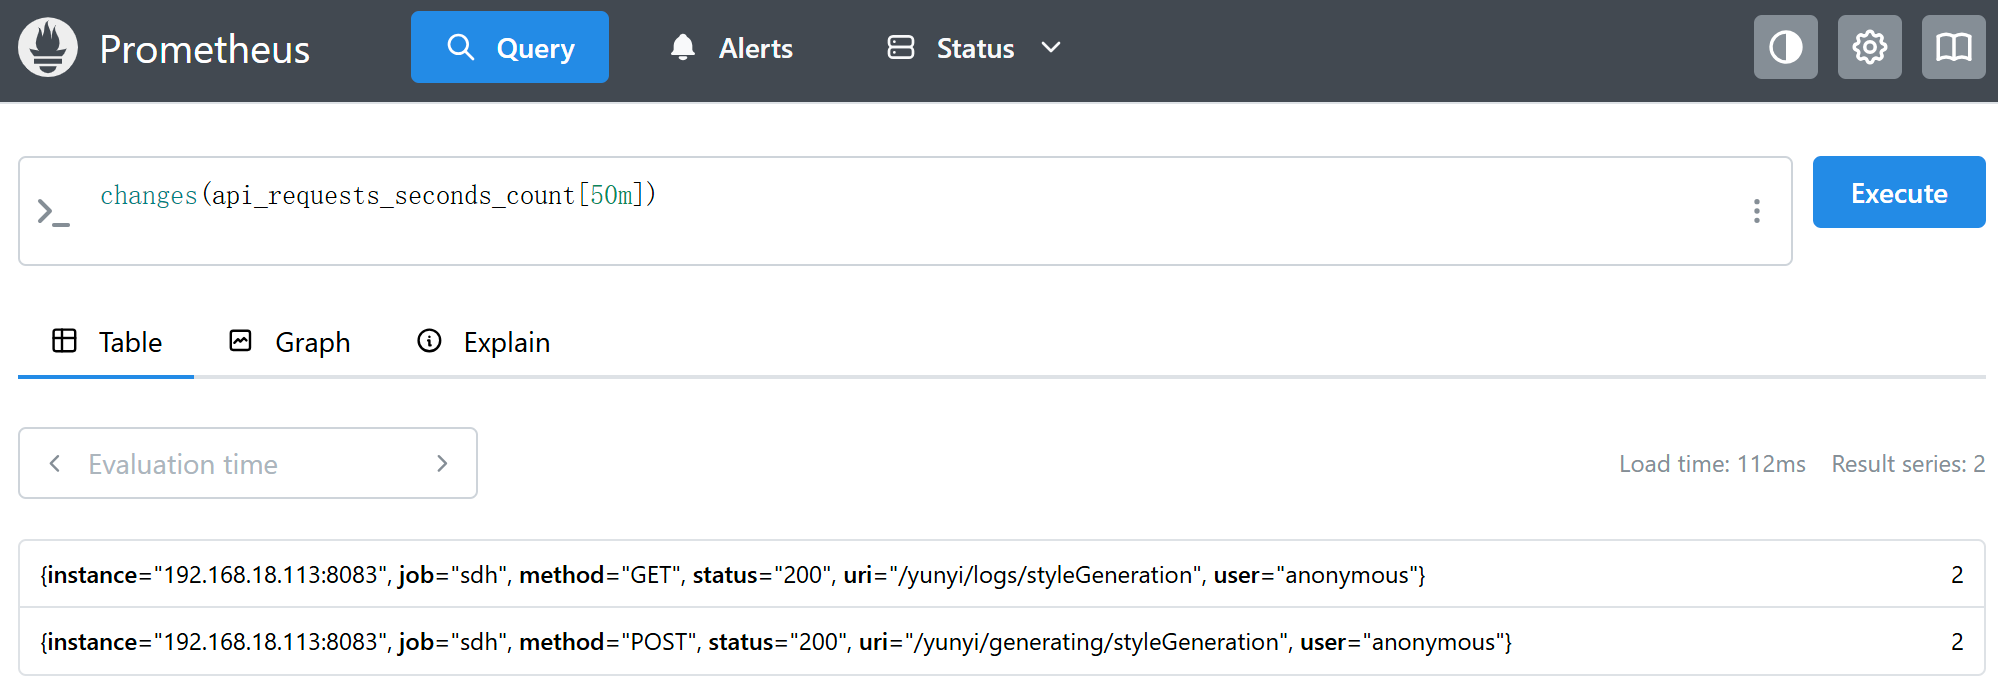
- 启动 Grafana :
sudo docker run -d -p 3000:3000 grafana/grafana
访问地址:http://localhost:3000,默认账号密码为 admin/admin
登录后,Add data source , 输入Prometheus的URL:http://192.168.18.7:9090
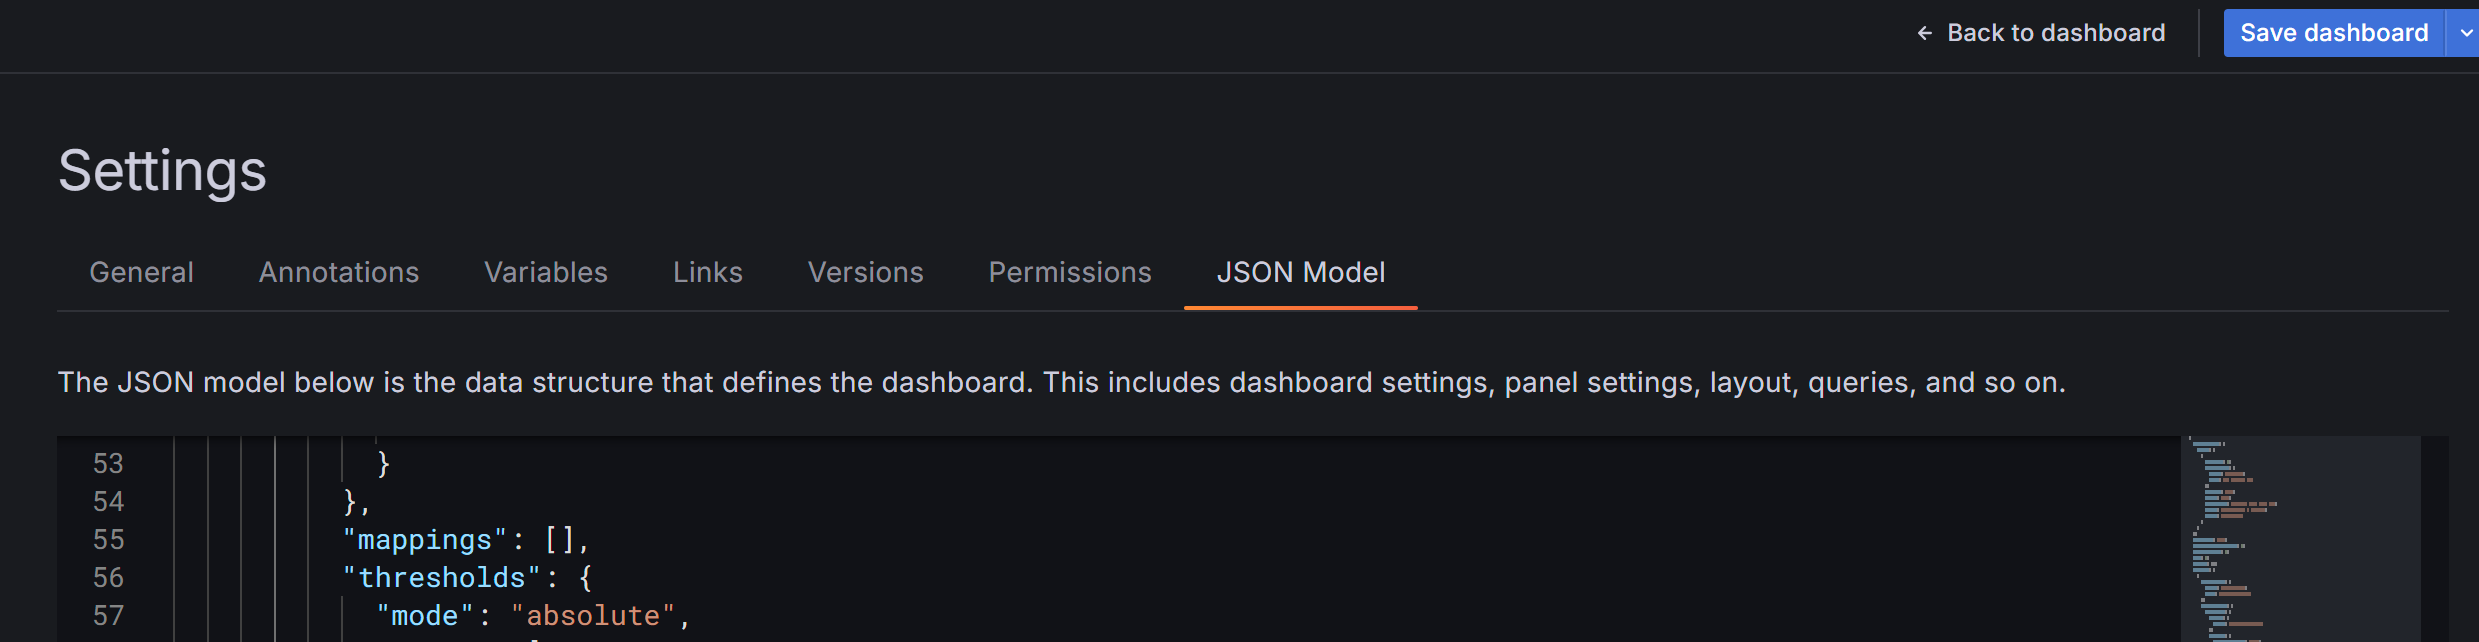
改dashboard json处如下图,其中Prometheus数据源的UID, 通过Grafana UI查询数据源时会在浏览器地址栏中显示:
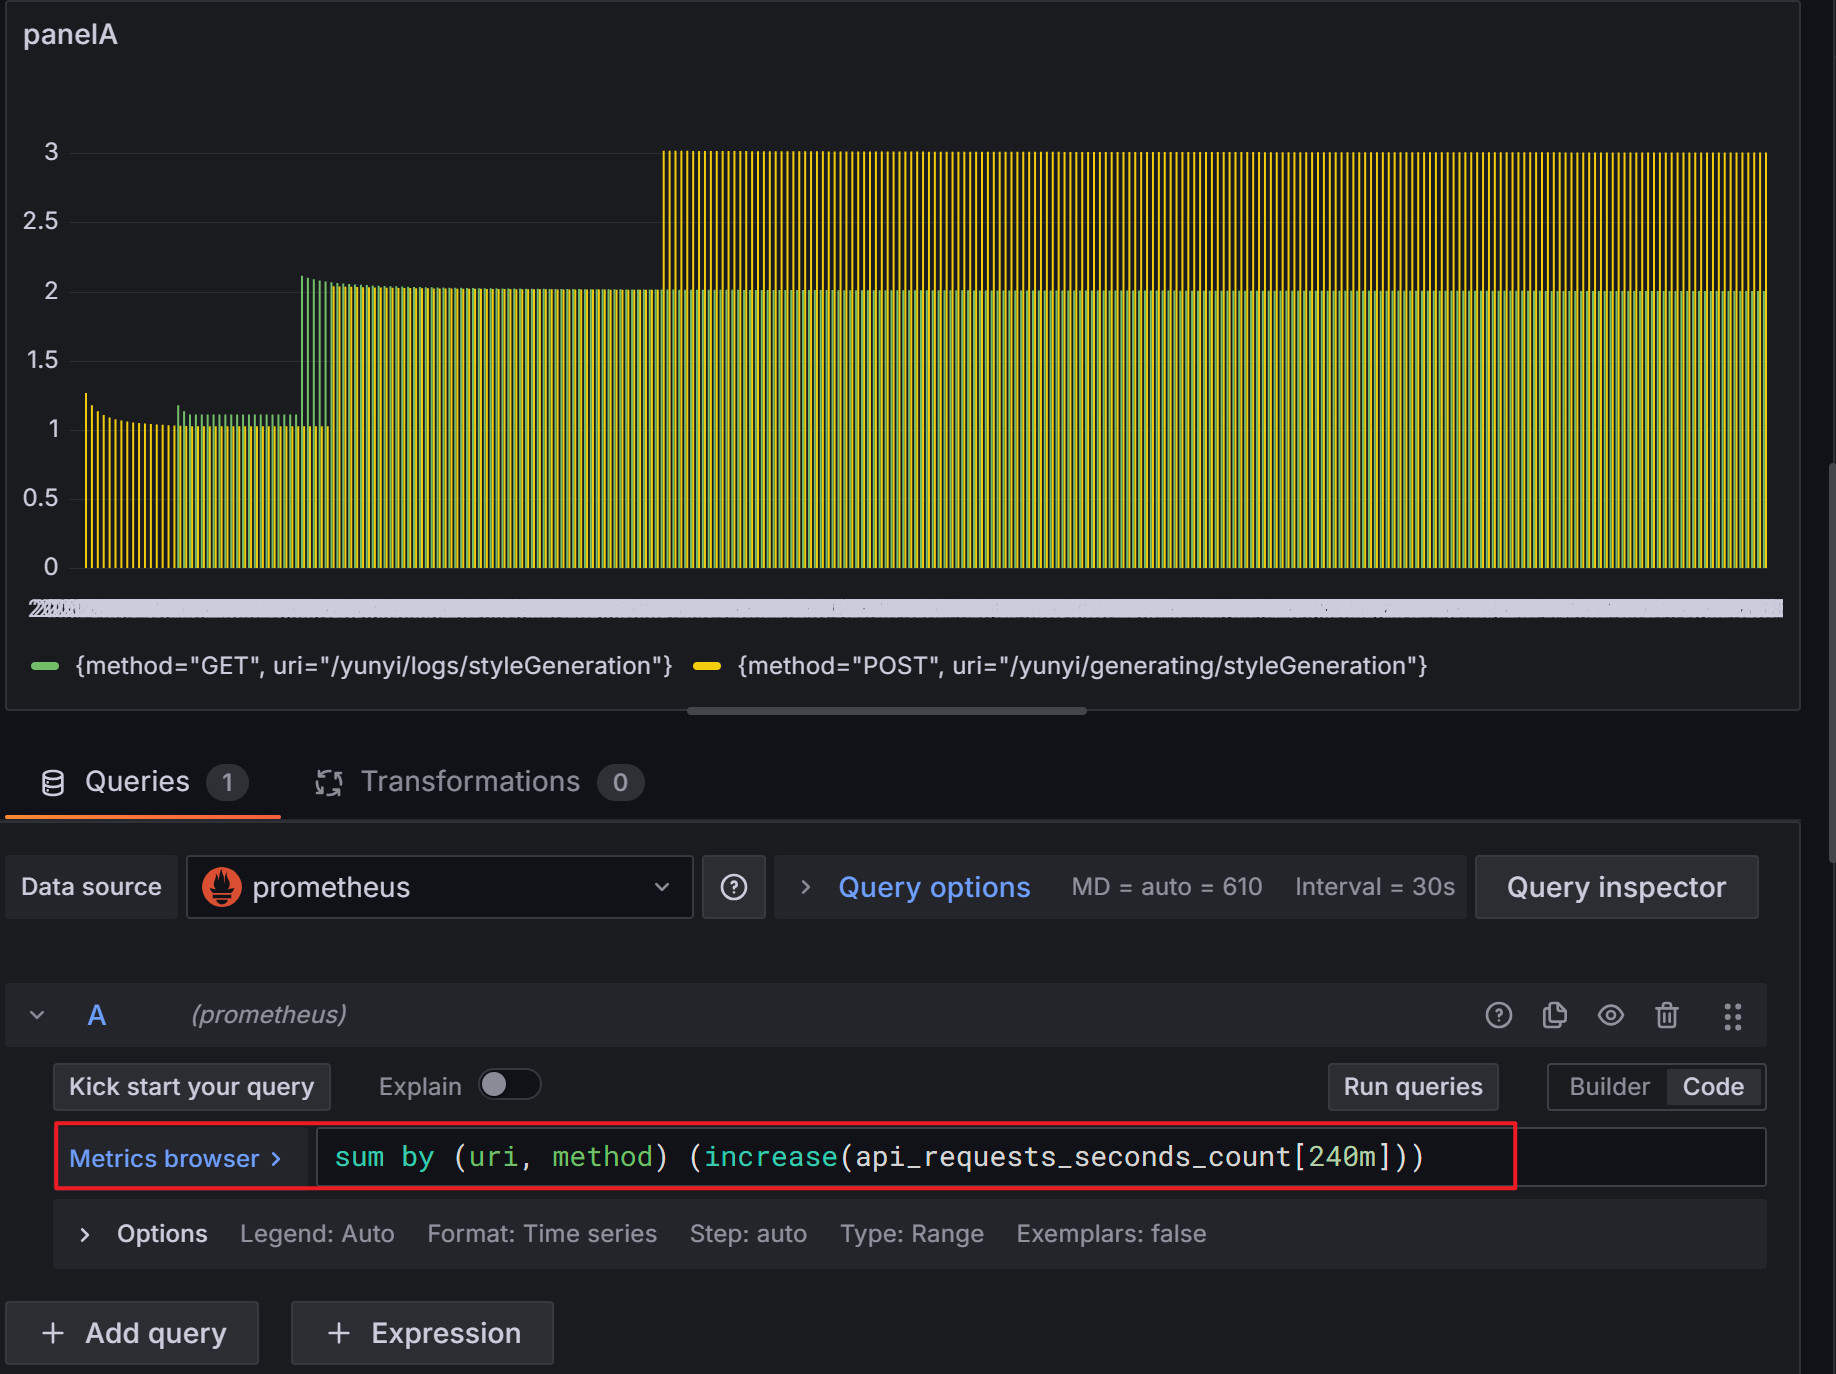
设置panel query处:
- Prometheus 抓取机制简要说明
对于 Gauge:
Prometheus 每隔 scrape_interval(如 15s)就会抓取一次当前值
即使没有接口调用,Prometheus 也会记录一个旧值(可能重复)
对我来说会导致存储很多不必要的重复值
对于 Counter:
Prometheus 只会记录每次 increment() 的事件
存储效率高,只在变化时产生数据点