一劳永逸解决Mayplotlib绘图中中文字体显示乱码的问题
一劳永逸解决Mayplotlib绘图中中文字体显示乱码的问题
import matplotlib
import os# 找到matplotlib的缓存目录
cache_dir = matplotlib.get_cachedir()
print(f"Matplotlib 缓存目录: {cache_dir}")# 检查目录下是否有字体缓存文件(通常是 fontlist-vXXX.json)
font_cache_file = os.path.join(cache_dir, 'fontlist-v390.json') # 文件名中的版本号可能不同if os.path.exists(font_cache_file):print(f"正在删除字体缓存文件: {font_cache_file}")os.remove(font_cache_file)print("缓存已清除。请重启你的Jupyter Notebook内核。")
else:print("未找到字体缓存文件 (可能文件名不同或已被删除)。请手动检查缓存目录。")
接着在Windows系统字体目录下安装SimHei.ttf字体
import matplotlib.font_manager# fontManager 会在第一次访问时重建缓存
font_list = matplotlib.font_manager.fontManager.get_font_names()found = False
for font_name in font_list:if 'simhei' in font_name.lower(): # 不区分大小写查找print(f"找到了!Matplotlib 识别的字体名是: {font_name}")found = Trueif not found:print("致命错误:Matplotlib 的字体库中仍然没有找到 SimHei。")print("请回到第1步,确认字体真的安装成功了。")
import torch
import torch.nn as nn
import matplotlib.pyplot as plt# 确保这两行设置在所有绘图代码之前
plt.rcParams['font.sans-serif'] = ['SimHei']
plt.rcParams['axes.unicode_minus'] = False # 创建一个简单的测试图
plt.figure()
plt.title("中文标题测试")
plt.xlabel("X轴标签")
plt.ylabel("Y轴标签")
plt.plot([1, 2, 3], [4, 5, 6])
plt.show()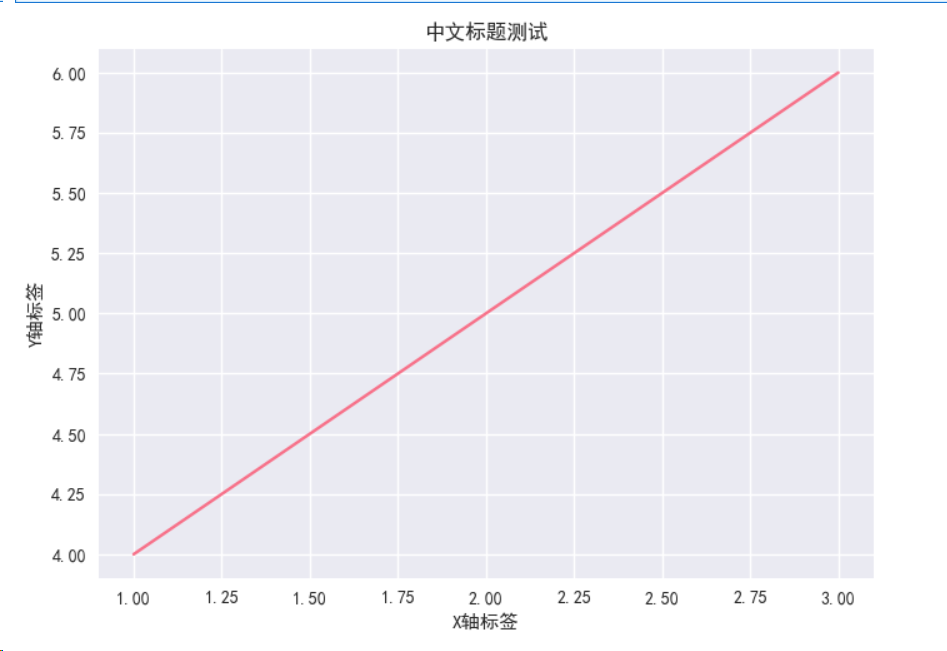
import torch
import torch.nn as nn
import torch.nn.functional as F
import matplotlib.pyplot as plt
from matplotlib.gridspec import GridSpec
import numpy as np
import seaborn as sns
# 确保这两行设置在所有绘图代码之前
plt.rcParams['font.sans-serif'] = ['SimHei']
plt.rcParams['axes.unicode_minus'] = False # 设备选择函数
def get_device():if torch.cuda.is_available():device = torch.device('cuda')print(f"使用GPU: {torch.cuda.get_device_name(0)}")else:device = torch.device('cpu')print("使用CPU")return devicedevice = get_device()# ReLU激活函数演示
class ReLUDemo(nn.Module):def __init__(self):super(ReLUDemo, self).__init__()self.relu = nn.ReLU()def forward(self, x):return self.relu(x)# 创建测试数据
x = torch.linspace(-5, 5, 100).to(device)
relu_demo = ReLUDemo().to(device)# 计算ReLU输出
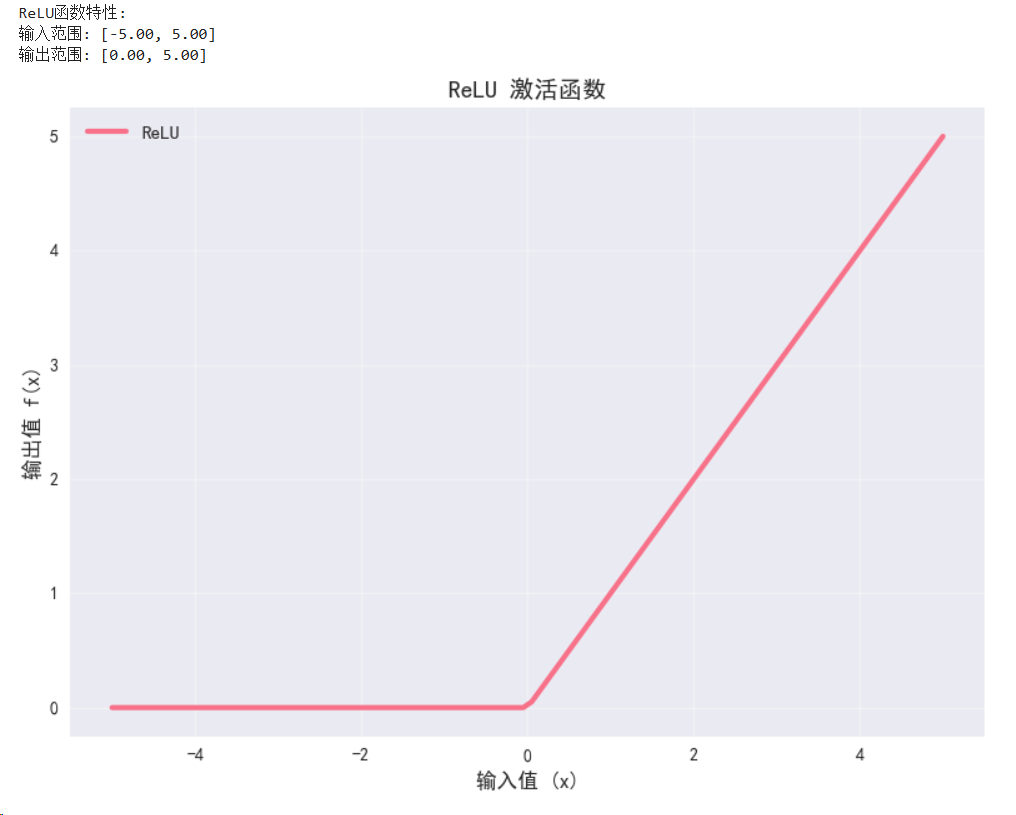
with torch.no_grad():y_relu = relu_demo(x)print("ReLU函数特性:")
print(f"输入范围: [{x.min():.2f}, {x.max():.2f}]")
print(f"输出范围: [{y_relu.min():.2f}, {y_relu.max():.2f}]")# 可视化ReLU函数
def plot_activation_function(x, y, title, ax=None):"""绘制激活函数"""if ax is None:plt.figure(figsize=(8, 6))ax = plt.gca()x_np = x.cpu().numpy()y_np = y.cpu().numpy()ax.plot(x_np, y_np, linewidth=3, label=title)ax.grid(True, alpha=0.3)ax.set_xlabel('输入值 (x)', fontsize=12)ax.set_ylabel('输出值 f(x)', fontsize=12)ax.set_title(f'{title} 激活函数', fontsize=14, fontweight='bold')ax.legend(fontsize=11)return ax# 绘制ReLU
plot_activation_function(x, y_relu, 'ReLU')
plt.tight_layout()
plt.show()