机器学习——决策树(DecisionTree)+ 过采样 + 交叉验证 案例:电信客户流失数据
详细学习可点击上方专栏。
此外:
决策树简单使用案例:
机器学习——决策树(DecisionTree)-CSDN博客![]() https://blog.csdn.net/2302_78022640/article/details/149865749过采样详细说明:
https://blog.csdn.net/2302_78022640/article/details/149865749过采样详细说明:
机器学习——过采样(OverSampling),解决类别不平衡问题,案例:逻辑回归 信用卡欺诈检测-CSDN博客![]() https://blog.csdn.net/2302_78022640/article/details/149857550交叉验证学习:
https://blog.csdn.net/2302_78022640/article/details/149857550交叉验证学习:
机器学习——K 折交叉验证(K-Fold Cross Validation),案例:逻辑回归 交叉寻找最佳惩罚因子C-CSDN博客![]() https://blog.csdn.net/2302_78022640/article/details/149854798
https://blog.csdn.net/2302_78022640/article/details/149854798
决策树 + SMOTE 过采样 + 交叉验证调参:电信客户流失预测案例
在处理如客户流失预测这类正负样本极度不平衡的问题时,仅使用普通的决策树模型会导致模型偏向多数类(即非流失类)。本文将引入:
-
决策树模型(
DecisionTreeClassifier) -
数据不平衡处理(SMOTE 过采样)
-
超参数调节(网格搜索 + 交叉验证)
1. 导入依赖库
import pandas as pd
import numpy as np
from sklearn.metrics import classification_report
from sklearn.model_selection import train_test_split, cross_val_score
from sklearn.tree import DecisionTreeClassifier
2. 数据加载与预处理
# 读取 Excel 数据,假设为“电信客户流失数据.xlsx”
data = pd.read_excel('电信客户流失数据.xlsx')# 特征与标签拆分
X = data.drop('流失状态', axis=1)
y = data['流失状态']
3. 数据集划分 + 过采样(SMOTE)
过采样代码:
oversampler = SMOTE(random_state=100)
X_train_os, y_train_os = oversampler.fit_resample(X_train, y_train)
from imblearn.over_sampling import SMOTE# 拆分训练集和测试集(80%训练 + 20%测试)
X_train, X_test, y_train, y_test = train_test_split(X, y, test_size=0.2, random_state=42)# 查看“流失状态”标签的分布情况
labels_count = pd.value_counts(y_train)
print("流失状态数据量组成:\n", labels_count)# 对训练集与测试集分别进行 SMOTE 过采样处理
oversampler = SMOTE(random_state=100)
X_train_os, y_train_os = oversampler.fit_resample(X_train, y_train)
# X_test_os, y_test_os = oversampler.fit_resample(X_test, y_test)  # 注意:测试集通常不应过采样,此处仅仅展示# 查看过采样后“流失状态”标签的分布情况
labels_count_os = pd.value_counts(y_train_os)
print("过采样后,流失状态数据量组成:\n", labels_count_os)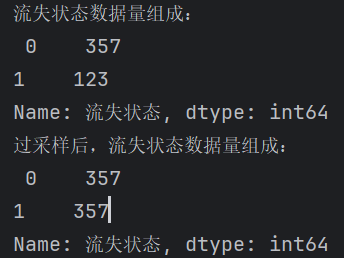
可以看到数量少的标签变得和多的一样多了
原理说简单点就是:在两两同类别的点之间插入新点,新点也同样是此类别
⚠️ 一般只对训练集做过采样。此处对测试集也进行了过采样,目的是让你看到“模型在平衡测试集”上的表现对比。
实际部署中,测试集应保留真实分布。
4. 决策树参数组合搜索 + 交叉验证
交叉验证代码:
score = cross_val_score(model, X_train_os, y_train_os, cv=8, scoring='recall')
scores = []# 四层嵌套循环遍历参数组合
for d in range(4,15):  # max_depthfor l in range(2,13):  # min_samples_leaffor s in range(4,15):  # min_samples_splitfor n in range(5,15):  # max_leaf_nodesmodel = DecisionTreeClassifier(criterion='gini',max_depth=d,min_samples_leaf=l,min_samples_split=s,max_leaf_nodes=n,random_state=42)# 8折交叉验证,评价指标使用 recall(适合看少数类召回情况)score = cross_val_score(model, X_train_os, y_train_os, cv=8, scoring='recall')score_mean = sum(score) / len(score)scores.append([d, l, s, n, score_mean])
# 将得分结果转为 NumPy 数组便于处理
scores = np.array(scores)
score_column = scores[:, 4]  # 取 recall 得分列# 找出 recall 得分最高的参数组合
max_score = scores[np.argmax(score_column)]
print("最优参数组合及得分:", max_score)
![]()
max_score[0] = 5
max_score[1] = 5
max_score[2] = 4
max_score[3] = 8
5. 使用最优参数训练模型
# 使用找到的最优参数构造决策树模型
model = DecisionTreeClassifier(criterion='gini',max_depth=int(max_score[0]),min_samples_leaf=int(max_score[1]),min_samples_split=int(max_score[2]),max_leaf_nodes=int(max_score[3]),random_state=100
)# 在过采样后的训练集上训练模型
model.fit(X_train_os, y_train_os)
6. 模型评估(训练集 & 测试集)
# 对训练集自测
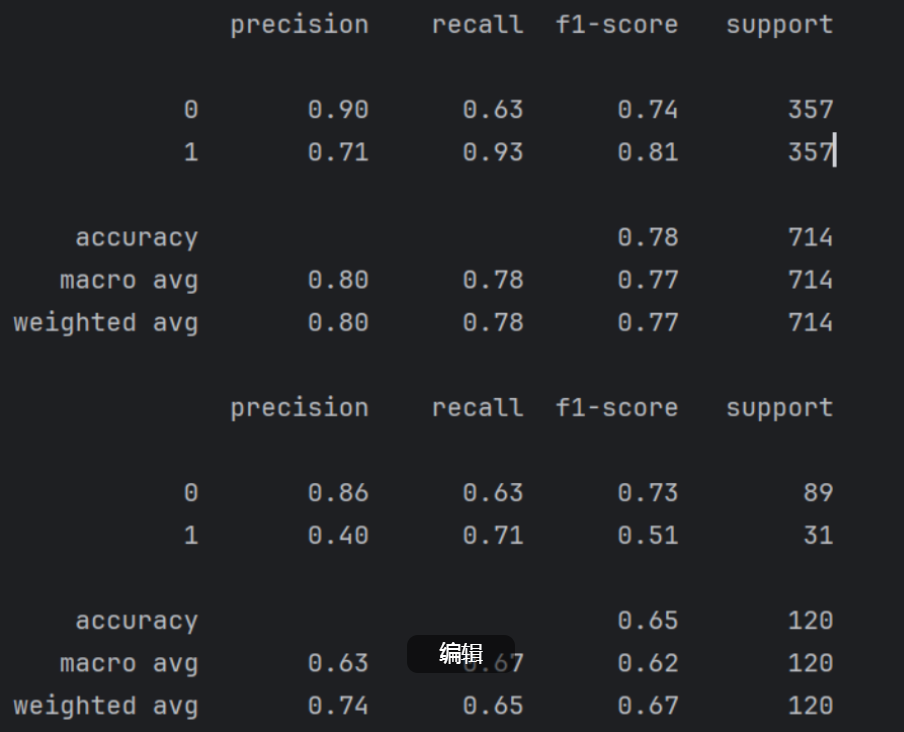
print("过采样后训练集的分类报告:")
print(classification_report(y_train_os, model.predict(X_train_os)))# 对测试集的测试 注意:测试机不要过采样
print("原始测试集的分类报告:")
print(classification_report(y_test, model.predict(X_test)))
并没有做对比。
一个是对训练出模型的训练集(过采样后的训练集)的自测
一个是对测试集的测试 (测试机不要过采样,过采样只是为了训练出模型)
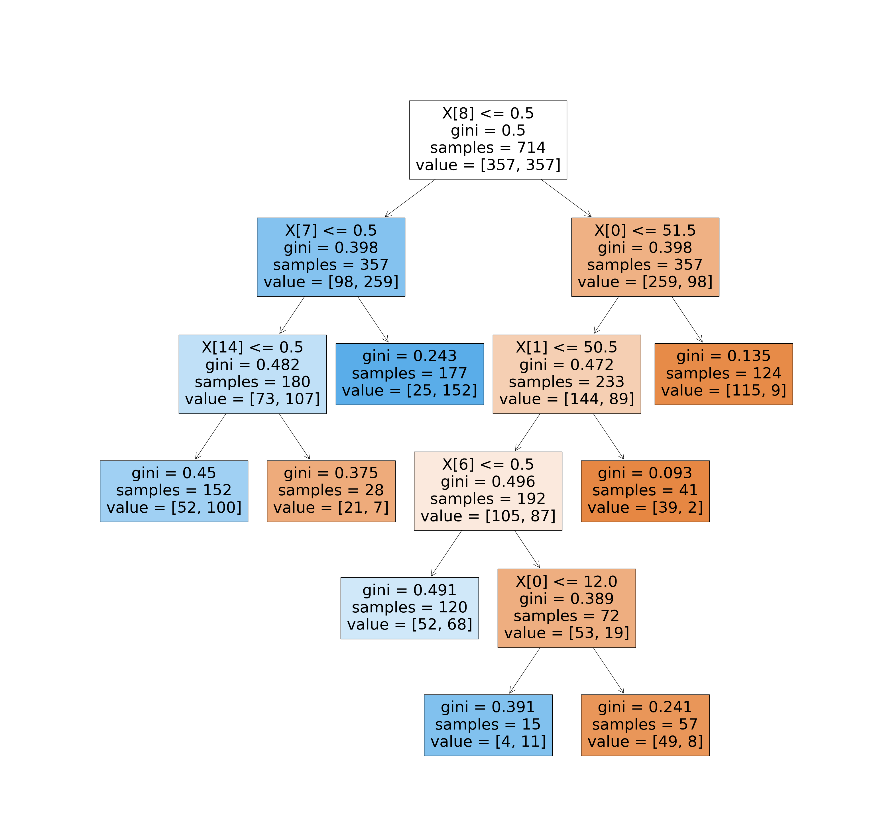
7. 决策树可视化
import matplotlib.pyplot as plt
from sklearn.tree import plot_tree# 画出决策树结构
fig, ax = plt.subplots(figsize=(32, 32))
plot_tree(model, filled=True, ax=ax)
plt.show()
总结
| 步骤 | 技术要点 |
|---|---|
| 数据预处理 | train_test_split 拆分,查看类别分布 |
| 处理不平衡 | SMOTE 过采样解决少数类样本不足 |
| 参数调节 | max_depth 等多个超参数 + cross_val_score |
| 模型评估 | 使用 classification_report 检查 Recall、Precision、F1 |
| 模型可视化 | 使用 plot_tree 显示决策路径 |
完整代码:
import pandas as pd
import numpy as np
from sklearn.metrics import classification_report
from sklearn.model_selection import train_test_split, cross_val_score
from sklearn.tree import DecisionTreeClassifierdata = pd.read_excel('电信客户流失数据.xlsx')
X = data.drop('流失状态', axis=1)
y = data['流失状态']X_train, X_test, y_train, y_test = train_test_split(X, y, test_size=0.2, random_state=42)labels_count = pd.value_counts(y_train)
print("流失状态数据量组成:\n", labels_count)from imblearn.over_sampling import SMOTE
oversampler = SMOTE(random_state=100)
X_train_os, y_train_os = oversampler.fit_resample(X_train, y_train)
# X_test_os, y_test_os = oversampler.fit_resample(X_test, y_test)labels_count_os = pd.value_counts(y_train_os)
print("过采样后,流失状态数据量组成:\n", labels_count_os)scores = []
for d in range(4,15):for l in range(2,13):for s in range(4,15):for n in range(5,15):model = DecisionTreeClassifier(criterion='gini', max_depth=d, min_samples_leaf=l, min_samples_split=s, max_leaf_nodes=n, random_state=42)score = cross_val_score(model, X_train_os, y_train_os, cv=8, scoring='recall')score_mean = sum(score) / len(score)scores.append([d,l,s,n,score_mean])
scores = np.array(scores)
score_column = scores[:, 4]
max_score = scores[np.argmax(score_column)]
print(max_score)model = DecisionTreeClassifier(criterion='gini', max_depth=int(max_score[0]), min_samples_leaf=int(max_score[1]), min_samples_split=int(max_score[2]), max_leaf_nodes=int(max_score[3]) ,random_state=100)
model.fit(X_train_os, y_train_os)print(classification_report(y_train_os, model.predict(X_train_os)))print(classification_report(y_test, model.predict(X_test)))import matplotlib.pyplot as plt
from sklearn.tree import plot_tree
fig, ax = plt.subplots(figsize=(32, 32))
plot_tree(model, filled=True, ax=ax)
plt.show()