决策树分类实战:从数据到模型优化
分类决策树代码实战
代码部分
import pandas as pd
from sklearn.model_selection import train_test_splitdata=pd.read_excel(r"D:\培训\机器学习\决策树分类\网卡\电信客户流失数据.xlsx",)
# print(data.head())
X=data.drop(["流失状态"],axis=1)
y=data["流失状态"]train_X,test_X,train_y,test_y=train_test_split(X,y,test_size=0.2,random_state=42)from imblearn.over_sampling import SMOTE#imblearn这个库里面调用,
oversampler =SMOTE(random_state=0)#保证数据拟合效果,随机种子
train_X, train_y = oversampler.fit_resample(train_X,train_y)#人工拟合数据from sklearn.tree import DecisionTreeClassifierfrom sklearn.model_selection import cross_val_score
import numpy as np
scores=[]
sd=[4,5,6,7,8,9,10,11,12]
ms=[2,3,4,5,6,7,8,9]
ml=[12,13,14,15,16,17,18]
mn=[9,10,11,12,13,14,15]
sc=0
best=[]
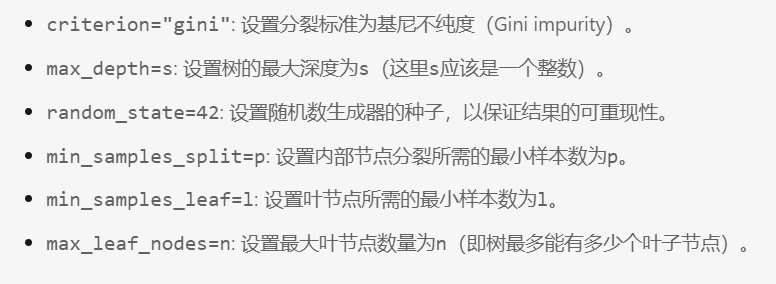
for n in mn:for l in ml:for p in ms:for s in sd:lr=DecisionTreeClassifier(criterion="gini",max_depth=s,random_state=42,min_samples_split=p,min_samples_leaf=l,max_leaf_nodes=n)score=cross_val_score(lr,train_X,train_y,cv=8,scoring='recall')scores_mean=sum(score)/len(score)if scores_mean>sc:sc=scores_meanprint(scores_mean)scores_mean=scores_meanbest=[s,p,l,n]
print(best)model=DecisionTreeClassifier(criterion="gini",max_depth=best[0],random_state=42,min_samples_split=best[1],min_samples_leaf=best[2],max_leaf_nodes=best[3])# model=DecisionTreeClassifier(criterion="gini",max_depth=8,random_state=42)
model.fit(train_X,train_y)from sklearn import metricsprint(metrics.classification_report(train_y,model.predict(train_X)))
print(metrics.classification_report(test_y,model.predict(test_X)))thresholds=[0.1,0.2,0.3,0.4,0.5,0.6,0.7,0.8,0.9]
recalls=[]
re=0
for i in thresholds: # 缺少冒号(:)和缩进y_predict_proba=model.predict_proba(test_X)y_predict_proba = pd.DataFrame(y_predict_proba)y_predict_proba=y_predict_proba.drop([0],axis=1)y_predict_proba[y_predict_proba[[1]] > i] = 1y_predict_proba[y_predict_proba[[1]] <= i] = 0recall =metrics.recall_score(test_y, y_predict_proba[1])recalls.append(recall)if recall>re:re=recallbest_threshold=iprint("{} Recall metric...".format(recall)) # 缺少.format值from sklearn.metrics import classification_report
print(best_threshold)
# 首先,获取模型预测的正类概率(第二列)
y_pred_proba = model.predict_proba(test_X)[:, 1]# 根据最优阈值生成预测标签
y_pred_optimal = (y_pred_proba >= best_threshold).astype(int)# 计算分类报告
report = classification_report(test_y, y_pred_optimal)
print(report)代码详解
1 导入数据并划分
data=pd.read_excel(r"D:\培训\机器学习\决策树分类\网卡\电信客户流失数据.xlsx",)
# print(data.head())
X=data.drop(["流失状态"],axis=1)
y=data["流失状态"]train_X,test_X,train_y,test_y=train_test_split(X,y,test_size=0.2,random_state=42)
先导入了数据,然后根据数据特征划分特征和标签,然后以2/8划分训练集测试集。
2 过采样
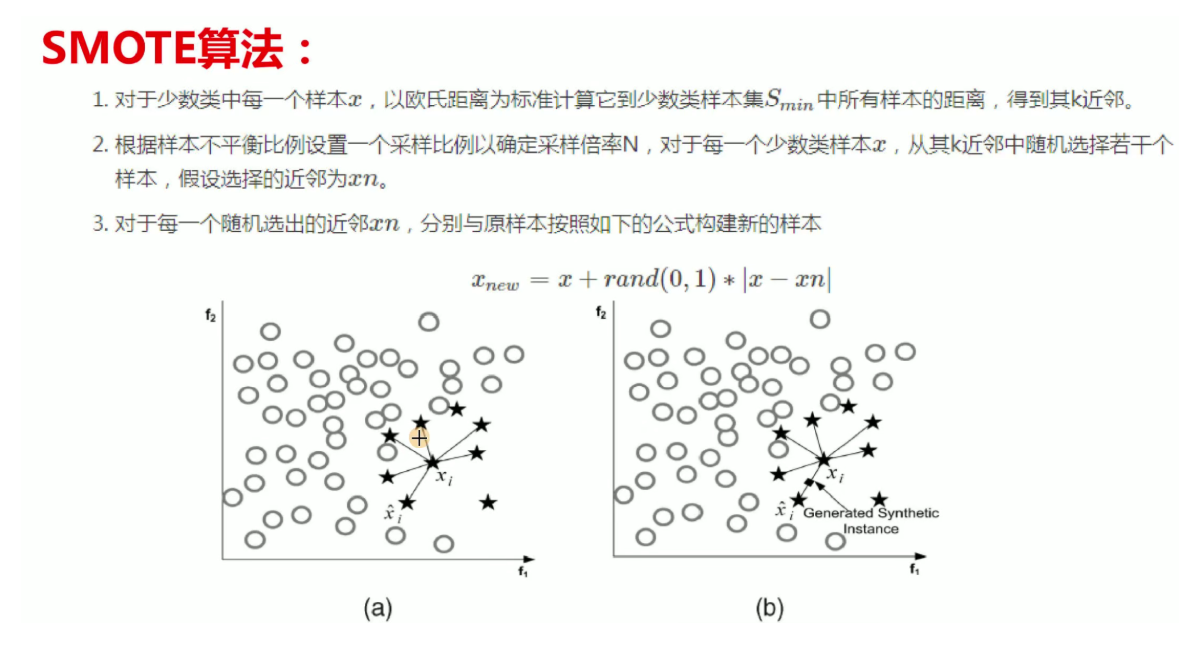
from imblearn.over_sampling import SMOTE#imblearn这个库里面调用,
oversampler =SMOTE(random_state=0)#保证数据拟合效果,随机种子
train_X, train_y = oversampler.fit_resample(train_X,train_y)#人工拟合数据
由于数据的不均衡性,我们对少的数据进行过采样,这类方法的讲解在上一篇有提到
3 调参
from sklearn.model_selection import cross_val_score
import numpy as np
sd=[4,5,6,7,8,9,10,11,12]
ms=[2,3,4,5,6,7,8,9]
ml=[12,13,14,15,16,17,18]
mn=[9,10,11,12,13,14,15]
sc=0
best=[]
for n in mn:for l in ml:for p in ms:for s in sd:lr=DecisionTreeClassifier(criterion="gini",max_depth=s,random_state=42,min_samples_split=p,min_samples_leaf=l,max_leaf_nodes=n)score=cross_val_score(lr,train_X,train_y,cv=8,scoring='recall')scores_mean=sum(score)/len(score)if scores_mean>sc:sc=scores_meanprint(scores_mean)scores_mean=scores_meanbest=[s,p,l,n]
print(best)
这里我用for循环对下面的四个参数进行调试找出最好的参数。进行交叉验证找出最好
4 建立模型训练
model=DecisionTreeClassifier(criterion="gini",max_depth=best[0],random_state=42,min_samples_split=best[1],min_samples_leaf=best[2],max_leaf_nodes=best[3])# model=DecisionTreeClassifier(criterion="gini",max_depth=8,random_state=42)
model.fit(train_X,train_y)from sklearn import metricsprint(metrics.classification_report(train_y,model.predict(train_X)))
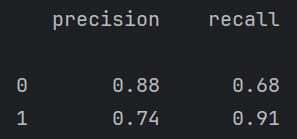
print(metrics.classification_report(test_y,model.predict(test_X)))根据上面最好的参数建立模型并训练,然后得出训练集和测试集的报告
5 调阈值
thresholds=[0.1,0.2,0.3,0.4,0.5,0.6,0.7,0.8,0.9]
recalls=[]
re=0
for i in thresholds: # 缺少冒号(:)和缩进y_predict_proba=model.predict_proba(test_X)y_predict_proba = pd.DataFrame(y_predict_proba)y_predict_proba=y_predict_proba.drop([0],axis=1)y_predict_proba[y_predict_proba[[1]] > i] = 1y_predict_proba[y_predict_proba[[1]] <= i] = 0recall =metrics.recall_score(test_y, y_predict_proba[1])recalls.append(recall)if recall>re:re=recallbest_threshold=iprint("{} Recall metric...".format(recall)) # 缺少.format值from sklearn.metrics import classification_report
print(best_threshold)
# 首先,获取模型预测的正类概率(第二列)
y_pred_proba = model.predict_proba(test_X)[:, 1]# 根据最优阈值生成预测标签
y_pred_optimal = (y_pred_proba >= best_threshold).astype(int)# 计算分类报告
report = classification_report(test_y, y_pred_optimal)
print(report)
这里其实有点歪门邪道了,因为调阈值是在牺牲一个类的情况下,来提高另一个类的召回率。对模型整体性能并没有提高。
例如下面调阈值虽然1的召回率提高了很多,但是0的几乎降为0了,但这个有点过来,需要再调。
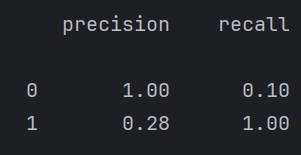
但是在某些情况下,例如我们设计一个医院检查疾病的大模型。最重要的就是有病的人一定要检查出来,因为没病的人检查为有病有医生可以复查,没病的可能就直接走了。所以对于这个我们要调阈值,让有病的人更容易被检查出来。