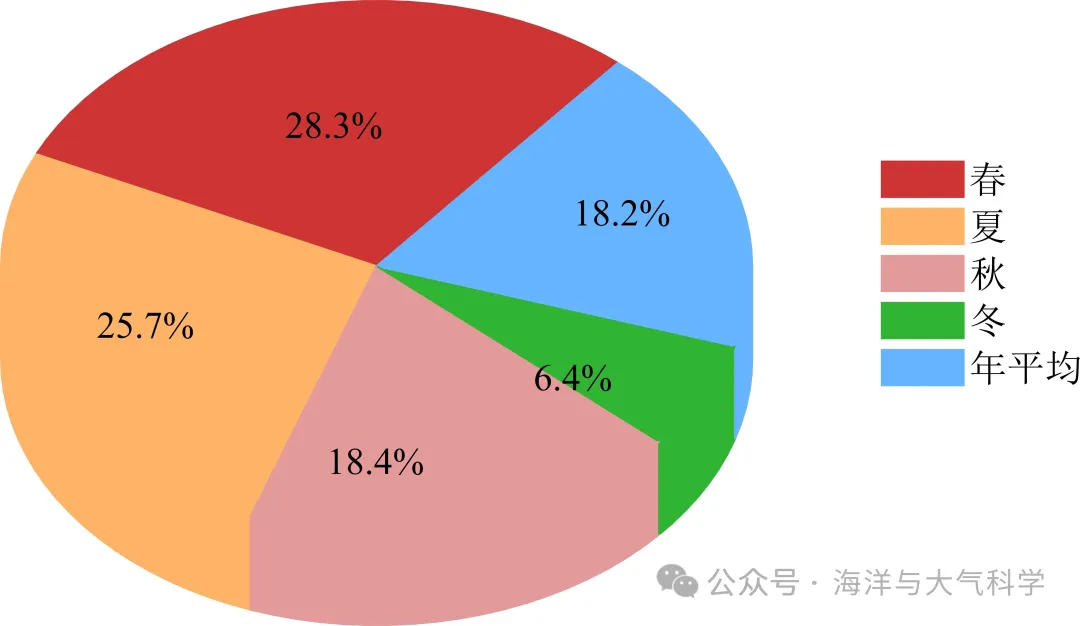
matlab画温度季节和年平均占比的三维柱状图
matlab画温度季节和年平均占比的三维柱状图
matlab画温度季节和年平均占比的三维柱状图
图片

code :
clear; clc; close all;
% 数据
data = [27.3, 26.7, 16.4, 11.4, 18.2];
labels = {‘春’, ‘夏’, ‘秋’, ‘冬’, ‘年平均’};
% 创建三维饼图(百分比标签保留一位小数)
figure(‘color’, ‘w’, ‘position’, [100, 100, 900, 600]);
h = pie3(data);
% 直接设置指定的百分比文本
textObjs = findobj(h, ‘Type’, ‘text’);
newStr = {‘27.3%’, ‘26.7%’, ‘16.4%’, ‘11.4%’, ‘18.2%’}; % 改为cell数组
for i = 1:length(textObjs)
set(textObjs(i), 'String', newStr{i}); % 使用大括号访问cell元素
end
% 设置颜色(RGB 0~1)
colors = [
0.8 0.2 0.2; % 红色 → 内蒙古0.9 0.6 0.6; % 粉色 → 山西0.2 0.7 0.2; % 绿色 → 陕西0.4 0.7 1.0; % 浅蓝 → 新疆1.0 0.7 0.4; % 橙色 → 其它];
% 确保颜色按 data 顺序分配
n = length(data);
for i = 1:n
startIdx = (i-1)*4 + 1;endIdx = i*4;currentObjs = h(startIdx:endIdx);
for obj = currentObjs
if isa(obj, ‘matlab.graphics.primitive.Patch’) || …
isa(obj, 'matlab.graphics.primitive.Surface')set(obj, 'FaceColor', colors(i,:), 'EdgeColor', colors(i,:), 'LineWidth', 1);
end
end
end
% 添加图例
legend(labels, ‘Location’, [0.8 0.45 0.1 0.2], ‘Box’, ‘off’, ‘FontSize’, 14, ‘FontName’, ‘宋体’);
% 精细调整文本标签位置(手动指定每个标签位置)
textPositions = [
-0.4, 0.3, 0.4; % 内蒙古-0.3, -0.6, 0.4; % 山西0.5, -0.6, 0.4; % 陕西0.7, -0.02, 0.4; % 新疆0.4, 0.54, 0.4 % 其它];
textObjs = findobj(h, ‘Type’, ‘text’);
for i = 1:length(textObjs)
set(textObjs(i), 'Position', textPositions(i,:), ...
‘FontSize’, 14, ‘FontName’, ‘Times New Roman’);
end
% 设置坐标轴
set(gca, ‘FontSize’, 14, ‘FontName’, ‘Times New Roman’, ‘LineWidth’, 1.3);
view(40, 45);
grid on;
export_fig(‘Three.jpg’,‘-r1000’)
