【人工智能】【Python】各种评估指标,PR曲线,ROC曲线,过采样,欠采样(Scikit-Learn实践)
案例——信用卡交易数据异常检测
案例背景以及数据集
信用卡欺诈是指以非法占有为目的,故意使用伪造、作废的信用卡,冒用他人的信用卡骗取财物,或用本人信用卡进行恶意透支的行为。
数据集“creditcard.csv”中的数据来自2013年9月由欧洲持卡人通过信用卡进行的交易。共284807行交易记录,其中数据文件中Class==1表示该条记录是欺诈行为,总共有 492 笔。输入数据中存在28个特征V1到V28(通过PCA变换得到,不用知道其具体含义),以及交易时间Time和交易金额Amount。
目标:构建一个信用卡欺诈分析的分类器。通过以往的交易数据分析出每笔交易是否正常,是否存在盗刷风险。
导入库和数据集
# 导入库和数据集
import pandas as pddata = pd.read_csv("../datasets/creditcard.csv")
print(data.head())
pd.value_counts(data['Class'], sort = True)
Time V1 V2 V3 V4 V5 V6 V7 \
0 0.0 -1.359807 -0.072781 2.536347 1.378155 -0.338321 0.462388 0.239599
1 0.0 1.191857 0.266151 0.166480 0.448154 0.060018 -0.082361 -0.078803
2 1.0 -1.358354 -1.340163 1.773209 0.379780 -0.503198 1.800499 0.791461
3 1.0 -0.966272 -0.185226 1.792993 -0.863291 -0.010309 1.247203 0.237609
4 2.0 -1.158233 0.877737 1.548718 0.403034 -0.407193 0.095921 0.592941 V8 V9 ... V21 V22 V23 V24 V25 \
0 0.098698 0.363787 ... -0.018307 0.277838 -0.110474 0.066928 0.128539
1 0.085102 -0.255425 ... -0.225775 -0.638672 0.101288 -0.339846 0.167170
2 0.247676 -1.514654 ... 0.247998 0.771679 0.909412 -0.689281 -0.327642
3 0.377436 -1.387024 ... -0.108300 0.005274 -0.190321 -1.175575 0.647376
4 -0.270533 0.817739 ... -0.009431 0.798278 -0.137458 0.141267 -0.206010 V26 V27 V28 Amount Class
0 -0.189115 0.133558 -0.021053 149.62 0
1 0.125895 -0.008983 0.014724 2.69 0
2 -0.139097 -0.055353 -0.059752 378.66 0
3 -0.221929 0.062723 0.061458 123.50 0
4 0.502292 0.219422 0.215153 69.99 0 [5 rows x 31 columns]Class
0 284315
1 492
Name: count, dtype: int64
取特征和目标标签
# 取特征和目标标签
X = data.iloc[:,:-1]
y = data.iloc[:,-1]
print(X.head())
print(y.head())
   Time        V1        V2        V3        V4        V5        V6        V7  \
0   0.0 -1.359807 -0.072781  2.536347  1.378155 -0.338321  0.462388  0.239599
1   0.0  1.191857  0.266151  0.166480  0.448154  0.060018 -0.082361 -0.078803
2   1.0 -1.358354 -1.340163  1.773209  0.379780 -0.503198  1.800499  0.791461
3   1.0 -0.966272 -0.185226  1.792993 -0.863291 -0.010309  1.247203  0.237609
4   2.0 -1.158233  0.877737  1.548718  0.403034 -0.407193  0.095921  0.592941   V8        V9  ...       V20       V21       V22       V23       V24  \
0  0.098698  0.363787  ...  0.251412 -0.018307  0.277838 -0.110474  0.066928
1  0.085102 -0.255425  ... -0.069083 -0.225775 -0.638672  0.101288 -0.339846
2  0.247676 -1.514654  ...  0.524980  0.247998  0.771679  0.909412 -0.689281
3  0.377436 -1.387024  ... -0.208038 -0.108300  0.005274 -0.190321 -1.175575
4 -0.270533  0.817739  ...  0.408542 -0.009431  0.798278 -0.137458  0.141267   V25       V26       V27       V28  Amount
0  0.128539 -0.189115  0.133558 -0.021053  149.62
1  0.167170  0.125895 -0.008983  0.014724    2.69
2 -0.327642 -0.139097 -0.055353 -0.059752  378.66
3  0.647376 -0.221929  0.062723  0.061458  123.50
4 -0.206010  0.502292  0.219422  0.215153   69.99  [5 rows x 30 columns]
0    0
1    0
2    0
3    0
4    0
Name: Class, dtype: int64
过采样与欠采样
过采样——以数据量多的一方的样本数量为标准,把样本数量较少的类的样本数量生成和样本数量多的一方相同。
SMOTE(Synthetic Minority Oversampling Technique),即合成少数类过采样技术,它是基于随机过采样算法的一种改进方案,由于随机过采样采取简单复制样本的策略来增加少数类样本,这样容易产生模型过拟合的问题(反复过同样的题目)。
SMOTE算法的思想是合成新的少数类样本,合成的策略是对每个少数类样本a,从它的最近邻中随机选一个样本b,然后在a、b之间的连线上随机选一点作为新合成的少数类样本
SMOTE算法流程:
采样最邻近算法,计算出每个少数类样本的K个近邻
从K个近邻中随机挑选N个样本进行随机线性插值
构造新的少数类样本
将新样本与原数据合成,产生新的训练集
欠采样是一种数据采样方法。在数据处理和分析中,当数据集中某个类别或特征的样本数量过多,而其他类别或特征的样本数量相对较少时,为了平衡数据分布、提高模型性能或减少计算成本等目的,可以采用欠采样方法。欠采样通过减少数量较多的类别或特征的样本数量,使其与数量较少的类别或特征的样本数量相对平衡。例如,在一个二分类问题中,类别 A 有 1000 个样本,而类别 B 只有 100 个样本,为了平衡数据,可以对类别 A 进行欠采样,随机选取一部分样本,使得类别 A 的样本数量与类别 B 接近。
简单来说,过采样就是把少的数据扩充(不管是复制还是什么其他算法);欠采样就是把多的数据变少。
# SMOTE过采样
from imblearn.over_sampling import SMOTEoversampled = SMOTE(random_state = 42)
os_data,os_labels = oversampled.fit_resample(X, y)
print(os_data)
print(os_labels)
                 Time        V1        V2        V3        V4        V5  \
0            0.000000 -1.359807 -0.072781  2.536347  1.378155 -0.338321
1            0.000000  1.191857  0.266151  0.166480  0.448154  0.060018
2            1.000000 -1.358354 -1.340163  1.773209  0.379780 -0.503198
3            1.000000 -0.966272 -0.185226  1.792993 -0.863291 -0.010309
4            2.000000 -1.158233  0.877737  1.548718  0.403034 -0.407193
...               ...       ...       ...       ...       ...       ...
568625  144838.659385 -6.379157  1.672637 -5.885670  2.068340 -0.668576
568626   65965.011763 -2.479028  0.958932 -1.782249  1.541783 -1.191990
568627   34592.129093 -1.799894  2.368957 -2.673997  1.705968 -1.355923
568628  129683.002907  0.255234  2.432041 -5.388252  3.793925 -0.230814
568629   91471.277869 -4.453646  3.210469 -5.294410  1.449911 -1.264653   V6        V7        V8        V9  ...       V20       V21  \
0       0.462388  0.239599  0.098698  0.363787  ...  0.251412 -0.018307
1      -0.082361 -0.078803  0.085102 -0.255425  ... -0.069083 -0.225775
2       1.800499  0.791461  0.247676 -1.514654  ...  0.524980  0.247998
3       1.247203  0.237609  0.377436 -1.387024  ... -0.208038 -0.108300
4       0.095921  0.592941 -0.270533  0.817739  ...  0.408542 -0.009431
...          ...       ...       ...       ...  ...       ...       ...
568625 -3.336450 -4.995823  2.632847 -2.275158  ... -0.709398  0.641337
568626 -0.466794 -1.957161  0.312580 -0.433956  ... -0.263193  0.351983
568627 -1.121788 -2.057832 -1.677459 -0.659287  ...  0.468282  1.473371
568628 -1.382725 -1.572929  0.748305 -1.600633  ...  0.197287  0.316760
568629 -0.493626 -3.130644 -4.165957  0.998760  ... -1.603764  4.414468   V22       V23       V24       V25       V26       V27       V28  \
0       0.277838 -0.110474  0.066928  0.128539 -0.189115  0.133558 -0.021053
1      -0.638672  0.101288 -0.339846  0.167170  0.125895 -0.008983  0.014724
2       0.771679  0.909412 -0.689281 -0.327642 -0.139097 -0.055353 -0.059752
3       0.005274 -0.190321 -1.175575  0.647376 -0.221929  0.062723  0.061458
4       0.798278 -0.137458  0.141267 -0.206010  0.502292  0.219422  0.215153
...          ...       ...       ...       ...       ...       ...       ...
568625 -0.249308 -2.311290 -0.159402  1.190079 -0.258067  0.777265 -0.728919
568626  0.208869 -0.235986 -0.404446  0.220454  0.685263 -0.890346  0.598736
568627 -0.581778 -0.013899 -0.144597  0.120315  0.242272 -0.121166 -0.534238
568628 -0.036858  0.182968  0.190701 -0.339250 -0.272824  0.315507 -0.091005
568629 -1.065864  0.798149  0.299668  0.064660 -0.446730 -0.363233  1.018147   Amount
0       149.620000
1         2.690000
2       378.660000
3       123.500000
4        69.990000
...            ...
568625    7.334751
568626   74.507571
568627  102.486823
568628   58.346854
568629  143.872749  [568630 rows x 30 columns]
0         0
1         0
2         0
3         0
4         0..
568625    1
568626    1
568627    1
568628    1
568629    1
Name: Class, Length: 568630, dtype: int64
划分数据集
from sklearn.model_selection import train_test_split
from collections import Counter
# 取特征和目标标签
# X_train,X_test,y_train,y_test=train_test_split(X,y,random_state=2,stratify=y)
# 使用过采样扩充的数据集
X_train,X_test,y_train,y_test=train_test_split(os_data,os_labels,random_state=42,stratify=os_labels)
print(Counter(y_train))
print(Counter(y_test))
Counter({0: 213236, 1: 213236})
Counter({1: 71079, 0: 71079})
这里使用过采样来扩充较少样本类别,扩充后效果飙升,召回率原来是80%多,扩充完召回率直接99.9%。
训练模型
# 采用决策树算法来训练模型
from sklearn.tree import DecisionTreeClassifier
dtc=DecisionTreeClassifier()
dtc.fit(X_train,y_train)
y_pred=dtc.predict(X_test)
print(dtc.score(X_test,y_test))
0.9983961507618284
混淆矩阵和模型性能度量指标
# 混淆矩阵
from sklearn.metrics import confusion_matrix
# 打印混淆矩阵
print(confusion_matrix(y_test,y_pred,labels=[0,1]))
[[70919 160][ 68 71011]]
# 模型性能度量指标
# Accuracy
from sklearn.metrics import accuracy_score
print(dtc.score(X_test,y_test)) # 默认就是用Acc
print("Accuracy:", accuracy_score(y_test, y_pred))
# Precision
from sklearn.metrics import precision_score
print("Precision:", precision_score(y_test,y_pred))
# Recall
from sklearn.metrics import recall_score
print("Recall:", recall_score(y_test,y_pred))
# F1-score
from sklearn.metrics import f1_score
print("F1:", f1_score(y_test,y_pred))
# 分类报告
from sklearn.metrics import classification_report
report=classification_report(y_test,y_pred,labels=[0,1],target_names=['正常','欺诈'])
print(report)
0.9983961507618284
Accuracy: 0.9983961507618284
Precision: 0.9977518933273384
Recall: 0.9990433179982836
F1: 0.9983971880492091precision    recall  f1-score   support正常       1.00      1.00      1.00     71079欺诈       1.00      1.00      1.00     71079accuracy                           1.00    142158macro avg       1.00      1.00      1.00    142158
weighted avg       1.00      1.00      1.00    142158
P-R曲线和ROC曲线
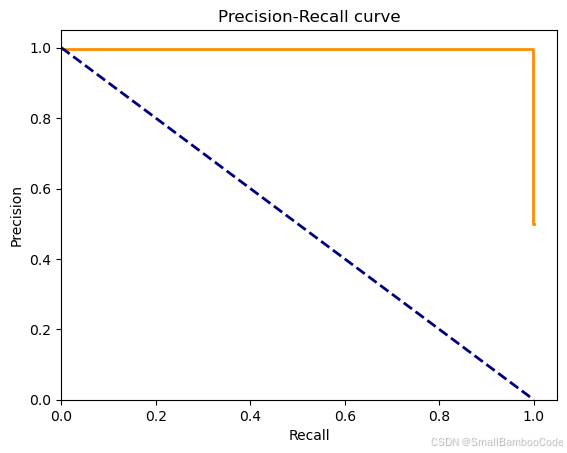
# 绘制P-R图
y_hat = dtc.predict_proba(X_test)[:,1]
from sklearn.metrics import precision_recall_curve,average_precision_score
import matplotlib.pyplot as plt
precision, recall, thresholds = precision_recall_curve(y_test, y_hat)
pr_avg = average_precision_score(y_test, y_hat)plt.figure()
plt.step(recall, precision, color='darkorange', lw=2, where='post')
plt.plot([0, 1], [1, 0], color='navy', lw=2, linestyle='--')
plt.xlabel('Recall')
plt.ylabel('Precision')
plt.ylim([0.0, 1.05])
plt.xlim([0.0, 1.05])
plt.title('Precision-Recall curve')
plt.show()
print("avg:", pr_avg)

<Figure size 640x480 with 1 Axes>
avg: 0.9972757030496718
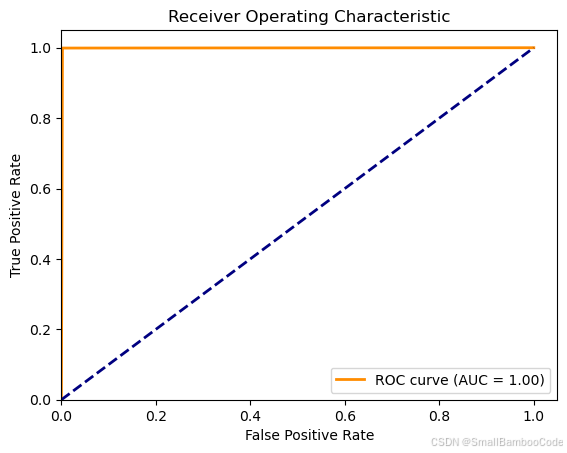
# ROC - AUC
from sklearn.metrics import roc_curve, aucfpr, tpr, thresholds2 = roc_curve(y_test, y_hat)
roc_auc = auc(fpr, tpr)
import matplotlib.pyplot as plt
# 绘制ROC曲线
#plt.figure()
plt.plot(fpr, tpr, color='darkorange', lw=2, label=f'ROC curve (AUC = {roc_auc:.2f})')
plt.plot([0, 1], [0, 1], color='navy', lw=2, linestyle='--')
plt.xlim([0.0, 1.05])
plt.ylim([0.0, 1.05])
plt.xlabel("False Positive Rate")
plt.ylabel("True Positive Rate")
plt.title("Receiver Operating Characteristic")
plt.legend(loc="lower right")
plt.show()
print("AUC:",roc_auc)

<Figure size 640x480 with 1 Axes>
AUC: 0.9983961507618284
小说明:由于ROC和P-R曲线非常相似,如何决定选择使用哪种曲线呢?
当正负样本差距不大的情况下,ROC和PR的趋势是差不多的,但是当负样本很多的时候,两者就截然不同了,ROC效果依然看似很好,但是PR上反映效果一般。解释起来也简单,假设就1个正例,100个负例,那么基本上TPR可能一直维持在100左右,然后突然降到0。这就说明PR曲线在正负样本比例悬殊较大时更能反映分类的性能。
在正负样本分布得极不均匀(highly skewed datasets)的情况下,ROC曲线变化不大,此时用PR曲线更加能反映出分类器性能的好坏。
所以在实际学习中,我们可以使用ROC来判断两个分类器的优良,然后进行分类器的选择,然后可以根据PR表现出来的结果衡量一个分类器面对不平衡数据进行分类时的能力,从而进行模型的改进和优化。
有一个经验法则:当正类非常少或你更关注假正类而不是假负类时,应选择使用P-R曲线,反之则是ROC曲线。
