prometheus UI 和node_exporter节点图形化Grafana
prometheus UI 和node_exporter节点图形化Grafana
先简单的安装一下
- 进行时间的同步操作
安装Prometheus之前必须要先安装ntp时间同步,因为prometheus server对系统时间的准确性要求很高,必须保证本机时间实时同步。
# 用crontab进行定时的时间的同步
yum install ntpdate -y#写一个定时器
crontab -e
* * * * * ntpdate ntp.aliyun.com - 安装Prometheus之前必须要先安装ntp时间同步,因为prometheus server对系统时间的准确性要求很高,必须保证本机时间实时同步。
安装和启动Prometheus server
- prometheus的安装非常简单,无需要解压,然后执行命令即可。
tar -xvzf prometheus-2.44.0.linux-amd64.tar.gz
mv prometheus-2.44.0.linux-amd64  /usr/local/prometheus
cd /usr/local/prometheus
- 这里我们写一个systemctl管理的脚本来启动这个服务。
[root@prometheus-server data]# cat /usr/lib/systemd/system/prometheus.service
[Unit]
Description=Prometheus: the alerting system
Documentation=http://prometheus.io/docs/
After=prometheus.service[Service]
ExecStart=/usr/local/prometheus/prometheus --web.enable-lifecycle --storage.tsdb.retention=90d --storage.tsdb.path=/usr/local/prometheus/data --config.file=/usr/local/prometheus/prometheus.yml
Restart=always
RestartSec=15s[Install]
WantedBy=multi-user.target
-
介绍几个参数
- –config.file加载prometheus的配置文件
- –web.listen-address #监听prometheus的web地址和端口,默认是9090.
- –storage.tsdb.path #数据持久化的保存路径
- –storage.tsdb.retention #数据持久化的时间
-
就可以使用systemctl来管理prometheus 服务,操作如下
systemctl daemon-reload systemctl restart prometheus systemctl enable prometheus # 开机自启 -
我们就可以检查这个服务了
[root@prometheus-66 ~]# systemctl status prometheus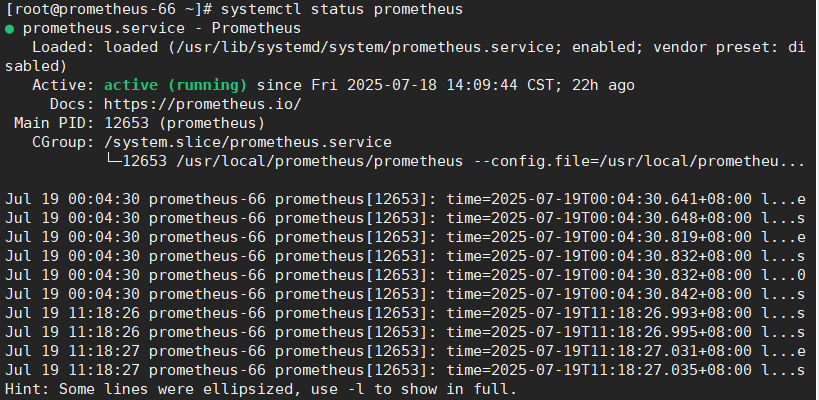
打开prometheus UI界面和详细使用
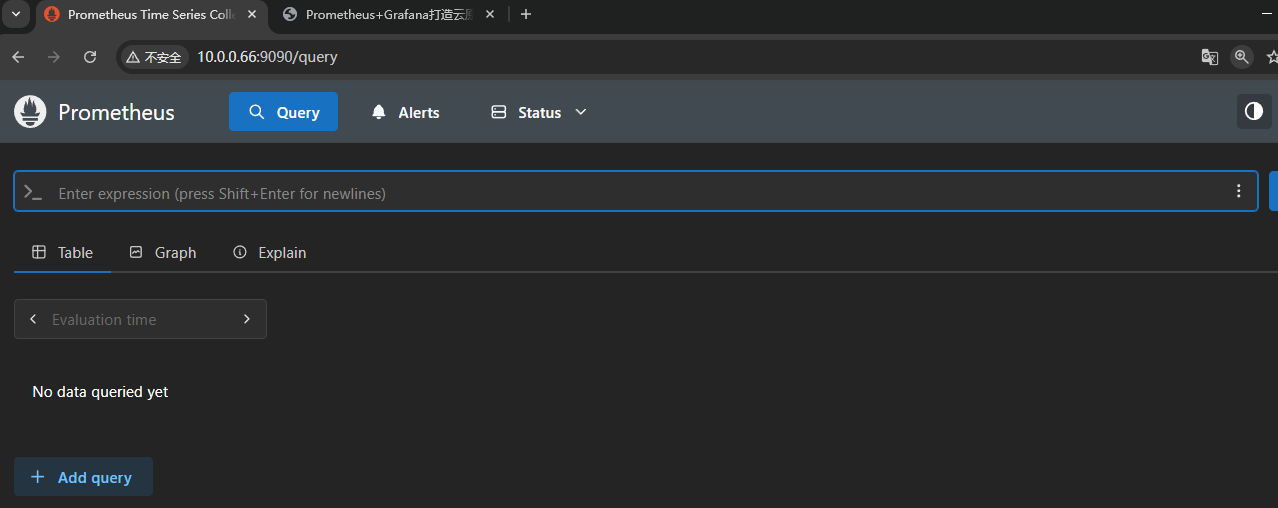
访问你当前使用启动服务主机和ip loaclhost:9090
-
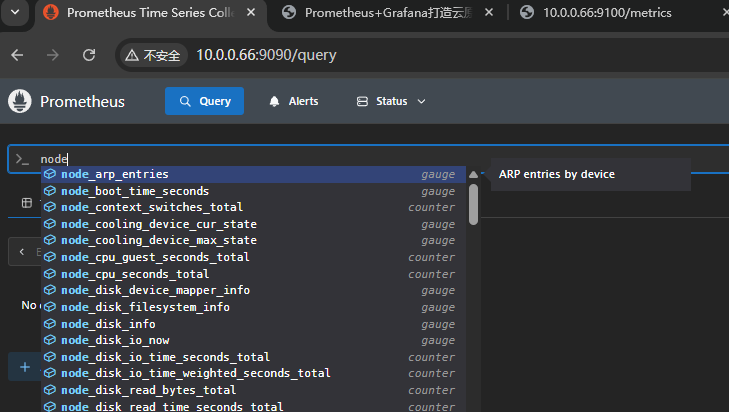
Prometheus UI是Prometheus内置的一个可视化管理界面,通过Prometheus UI,用户能够轻松的了解Prometheus当前的配置,监控任务运行状态等。 通过Graph面板,用户还能直接使用PromQL实时查询监控数据。
-
Promtheus作为一个时间序列数据库,其采集的数据会以文件的形似存储在本地中,默认的存储路径为执行命令的当前data目录下,会自动创建,用户也可以通过参数–storage.tsdb.path="data/"修改本地数据存储的路径。
-
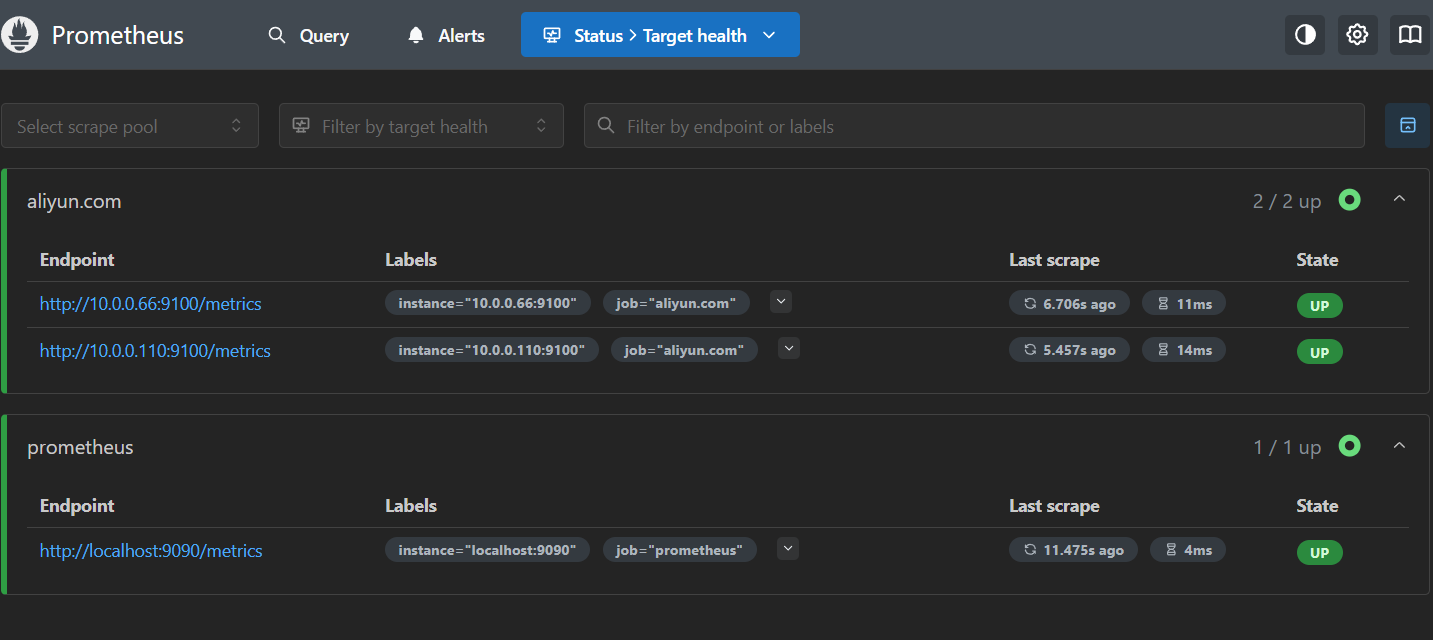
在查询up命令 1是存活,0是检测失败
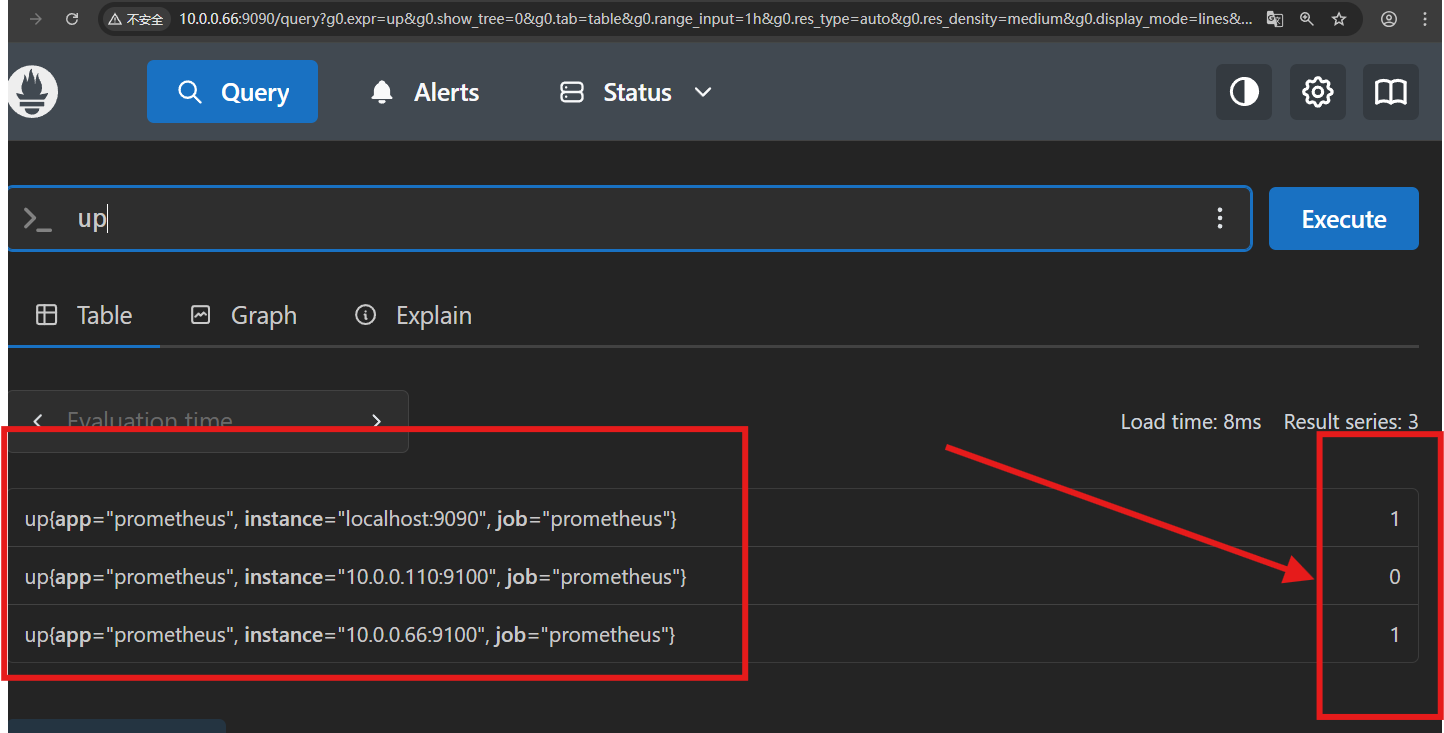
查看监控的有哪些的主机
prometheus server配置文件介绍
-
Prometheus的主配置文件prometheus.yml,其实prometheus解压安装之后,就默认自带了一个基本的配置文件,简单修改后的prometheus.yml文件内容如下:
[root@prometheus-66 prometheus]# vim prometheus.yml # my global config global:scrape_interval: 15s # Set the scrape interval to every 15 seconds. Default is every 1 minute.evaluation_interval: 15s # Evaluate rules every 15 seconds. The default is every 1 minute.# scrape_timeout is set to the global default (10s).# Alertmanager configuration alerting:alertmanagers:- static_configs:- targets:# - alertmanager:9093# Load rules once and periodically evaluate them according to the global 'evaluation_interval'. rule_files:# - "first_rules.yml"# - "second_rules.yml"# A scrape configuration containing exactly one endpoint to scrape: # Here it's Prometheus itself. scrape_configs:# The job name is added as a label `job=<job_name>` to any timeseries scraped from this config.- job_name: "prometheus"# metrics_path defaults to '/metrics'# scheme defaults to 'http'.static_configs:- targets: ["localhost:9090","10.0.0.110:9100","10.0.0.66:9100"]# The label name is added as a label `label_name=<label_value>` to any timeseries scraped from this config.labels:app: "prometheus"- 介绍一下如下:
scrape_interval: 15s #每隔15秒向目标抓取一次数,默认为一分钟 evaluation_interval: 15s #每隔15秒执行一次告警规则检查,默认为一分钟- scrape_configs指定的是prometheus要监控的目标,这里是整个prometheus的核心部分,在srape_config中每一个监控是一个job,但job的类型有很多。可以是最简单的static_config,即静态文件指定的每一个目标
- job_name: prometheusstatic_configs:- targets: ['localhost:9090']- 也可以自己定义要监控主机的节点,这里指定的是一个prometheus本机的一个监控节点对应的9090端口,也可以继续扩展需要监控的节点,例如:
- job_name: 'aliyun'static_configs:- targets:['server1:9100','IP:9100','nginxserver:9100','web01:9100','redis:9100','logserver:9100','redis2:9100']对于prometheus.yml语法的检查
prometool是prometheus自带的检测prometheus.yml的工具
[root@prometheus-66 prometheus]# ll
total 373876
-rw-r--r-- 1 root root  72649805 Dec 14  2021 grafana-8.3.3-1.x86_64.rpm
-rw-r--r-- 1 1001  118     11357 Jul 15 00:36 LICENSE
-rw-r--r-- 1 1001  118      3773 Jul 15 00:36 NOTICE
-rwxr-xr-x 1 1001  118 159425376 Jul 15 00:17 prometheus
-rw-r--r-- 1 1001  118      1128 Jul 18 14:09 prometheus.yml
-rwxr-xr-x 1 1001  118 150746286 Jul 15 00:17 promtool
[root@prometheus-66 prometheus]# ./promtool check config prometheus.yml
Checking prometheus.ymlSUCCESS: prometheus.yml is valid prometheus config file syntaxprometheus.yml 文件编辑完成后,进行校验配置非常重要,如果有配置错误,也会给出错误提示.
prometheus监控Linux主机状态
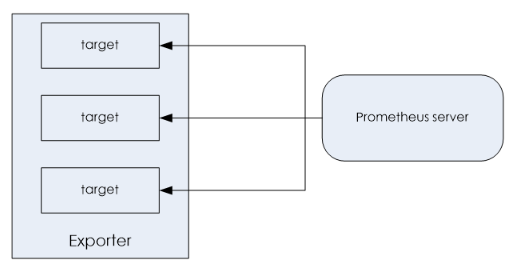
Exporter介绍
- 所有可以向Prometheus提供监控样本数据的程序都可以被称为一个Exporter。而Exporter的一个实例称为target,如下图所示,Prometheus通过轮询的方式定期从这些target中获取样本数据:
(2)、用户自定义的
我们除了可以直接使用社区提供的Exporter以外,还可以基于Prometheus提供的Client Library创建适合自己的Exporter程序,目前Promthues社区官方提供了对以下编程语言的支持:Python 、Go、Java/Scala、Ruby等。同时还有第三方实现的如:Bash、C++、Lua、Node.js、PHP、Rust等。
官方推荐的Exporter列表:https://prometheus.io/docs/instrumenting/exporters/
node_exporter介绍
-
Node exporte主要用于采集被监控主机上的cpu负载,内存的使用情况,网络等数据,并上报数据给Prometheus server。Node_exporter 其实是一个以http_server方式运行在后台,并且持续不断采集 Linux系统中各种操作系统本身相关的监控参数的程序,其采集量是很快很全的,默认的采集项目就远超过了我们的实际需求。
-
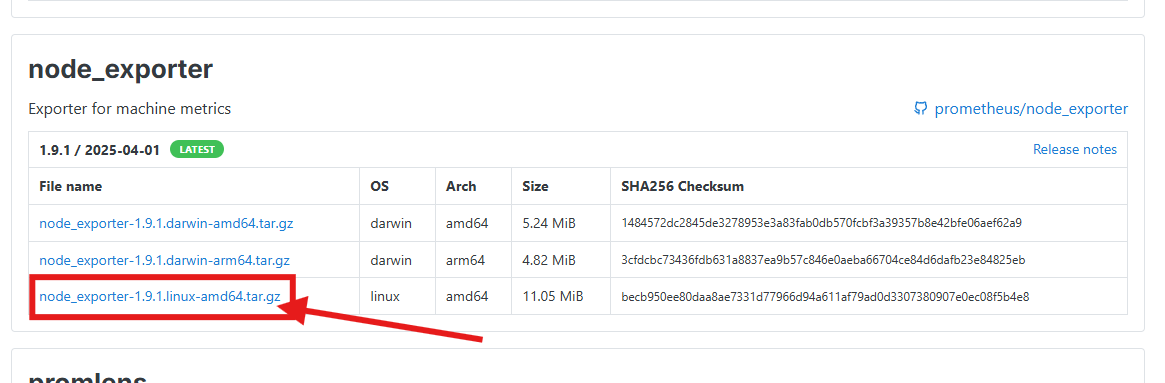
这里我们从官网下载node_exporter
-
Prometheus官网https://prometheus.io/download/ 下载node_exporter
[root@localhost ~]# tar zxvf node_exporter-1.5.0.linux-amd64.tar.gz
[root@localhost ~]# mv node_exporter-1.5.0.linux-amd64  /usr/local/node_exporter
[root@localhost ~]# cd  /usr/local/node_exporter
这里我们也编写systemctl的脚本启动这个服务
[root@prometheus-server data]# cat /usr/lib/systemd/system/prometheus.service
[Unit]
Description=Prometheus: the alerting system
Documentation=http://prometheus.io/docs/
After=prometheus.service[Service]
ExecStart=/usr/local/node_exporter/node_exporter
Restart=always
RestartSec=15s[Install]
WantedBy=multi-user.target
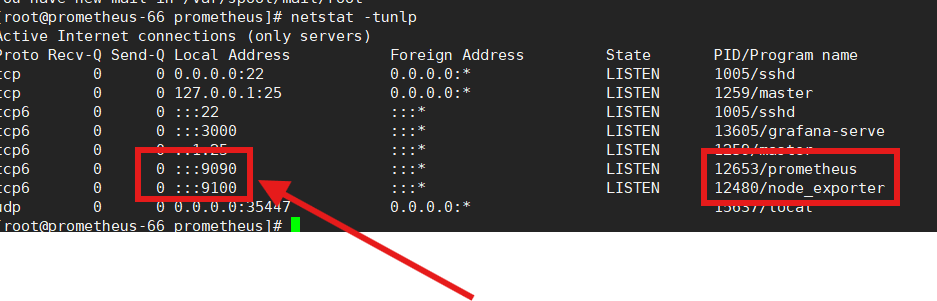
- 启动这个服务并且检测端口
获取对应的监控数据
http://localhost:9100
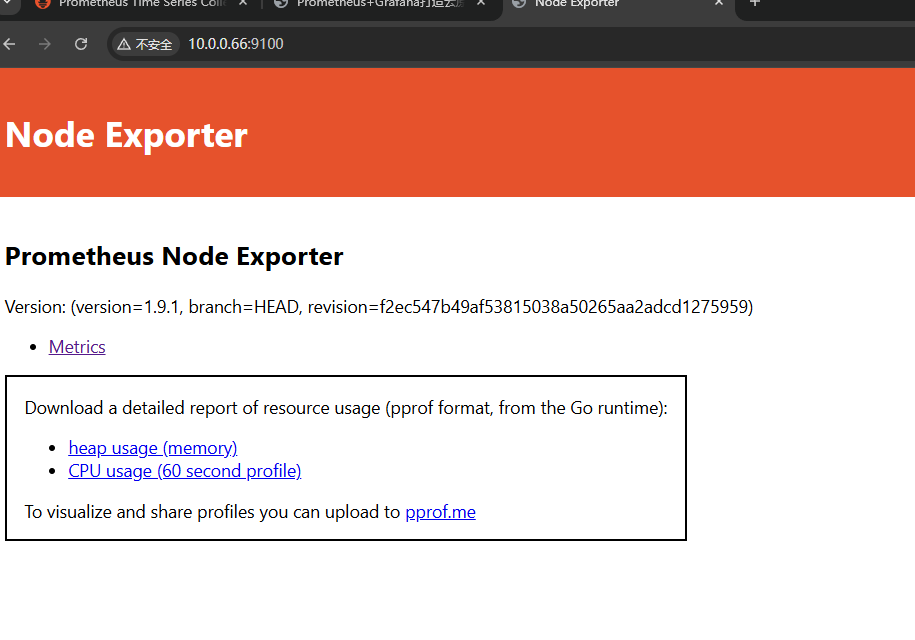
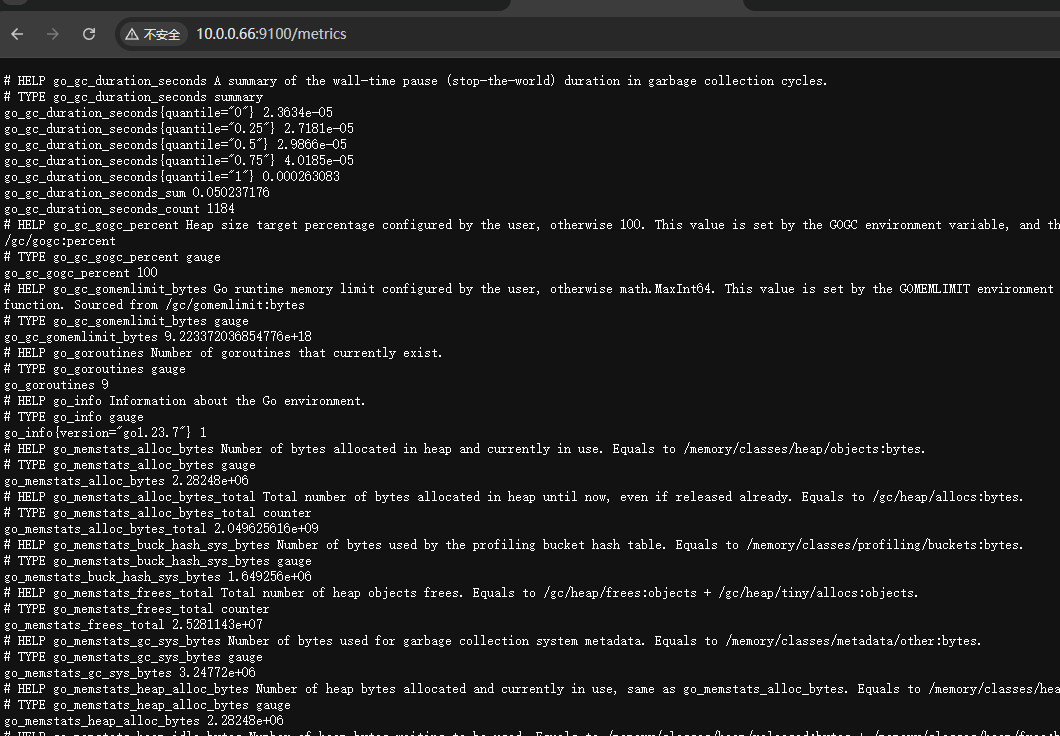
通过这个页面可以看到Prometheus的抓取到的数据
这个node节点的数据
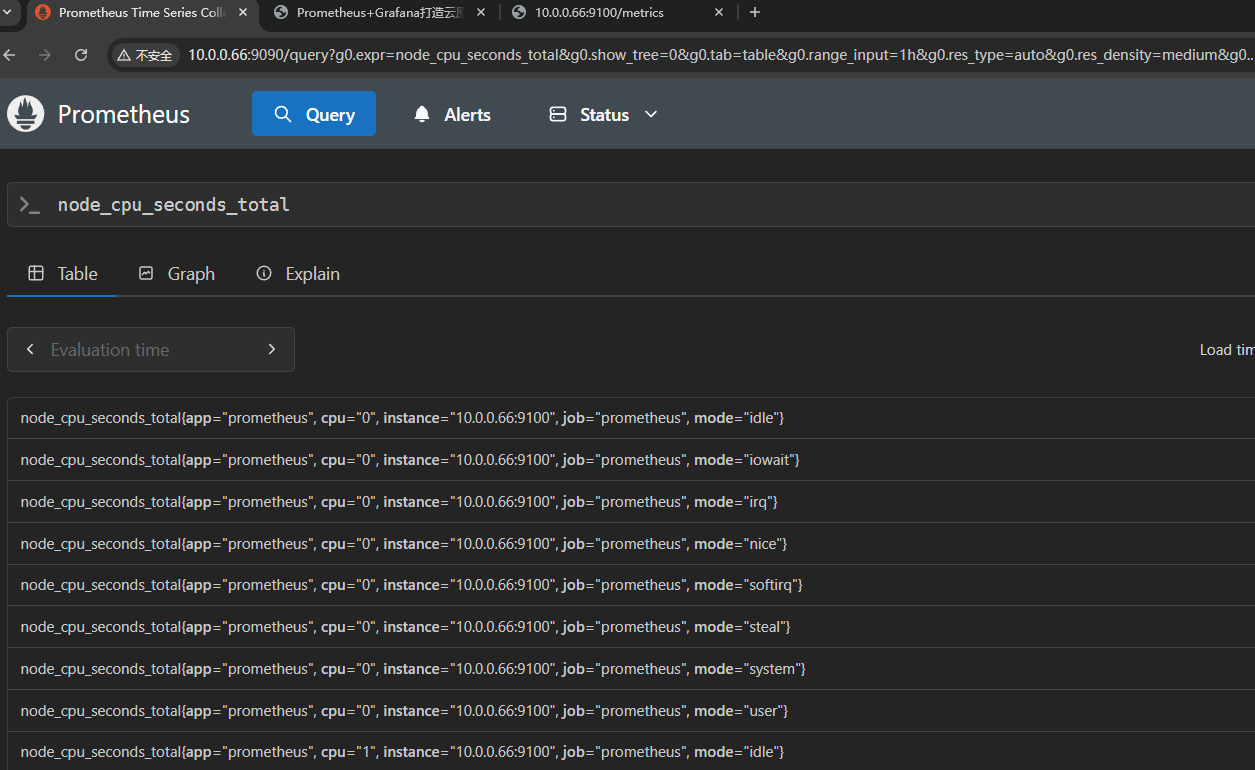
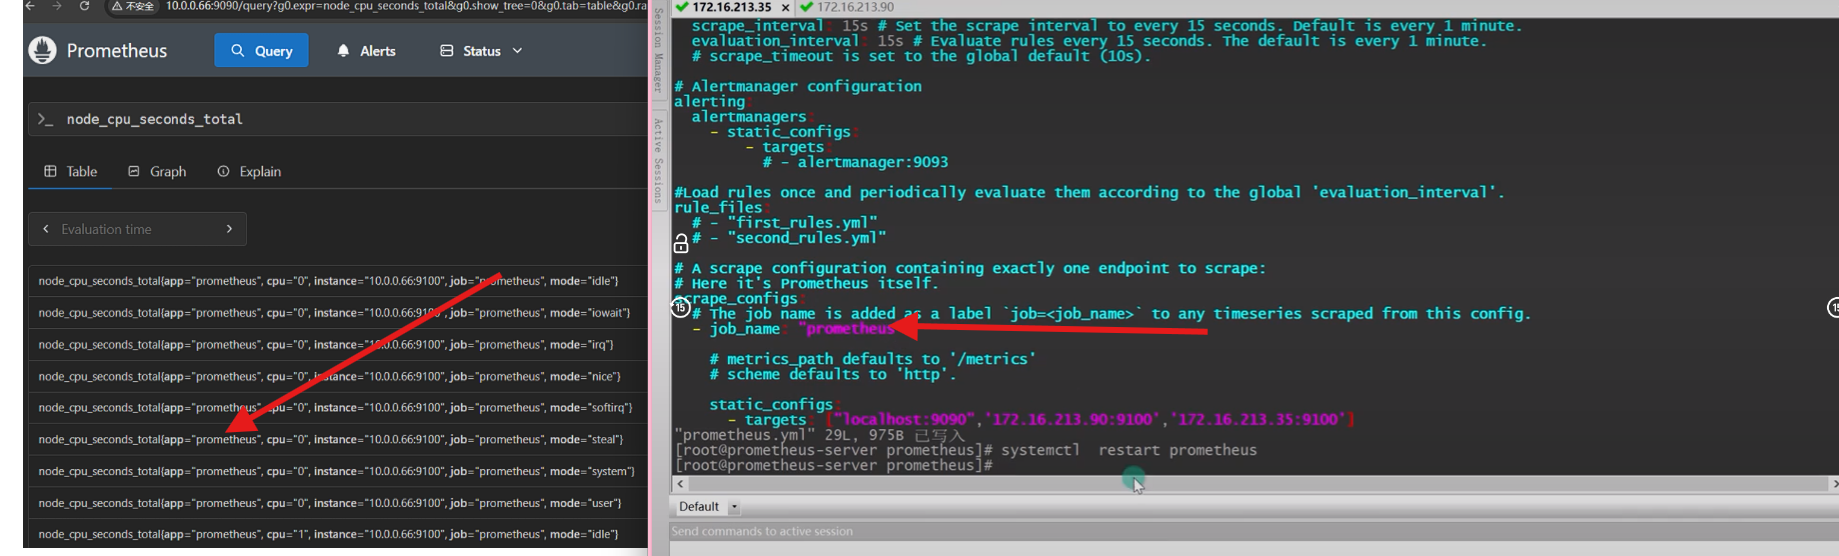
这个是我们在prometheus.yml上定义的标签,这个是可以修改的我们也可以修改为aliyun
在这个组下的都加上了这个组名字的标签。
我们对于prometheus.yml进行修改
我们修改的配置文件
scrape_configs:- job_name: "prometheus"# metrics_path defaults to '/metrics'# scheme defaults to 'http'.static_configs:- targets: ["localhost:9090"]- job_name: "aliyun.com"static_configs:- targets: ["loaclhost:9100","10.0.0.110:9100"]
我们学习查询的语句
- 我们只要关于aliyun组的信息
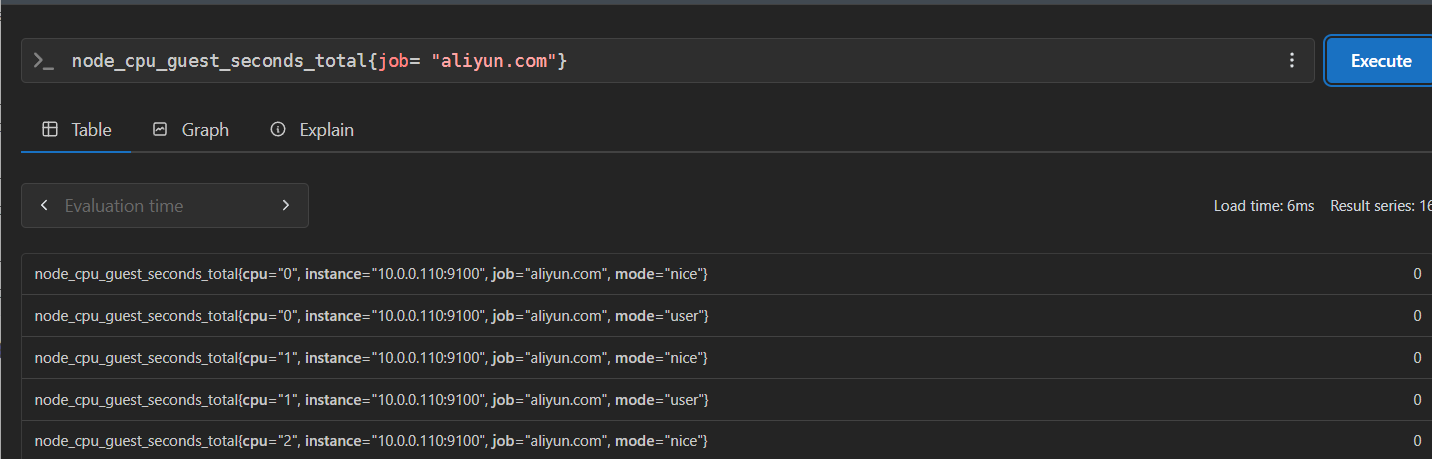
这里我们就差不多因该学会了prometheus配置文件的修改和部署,
但是这样的仪表盘并不是很好的查看我们就需要使用图形化工具来表示
Gragana对prometheus实现监控可视化
-
Grafana是一个开源的指标监测和可视化工具。官方网站为:https://grafana.com/, 常用于展示基础设施的时序数据和应用程序运行分析。Grafana的dashboard展示非常炫酷,绝对是运维提升可视化监控的一大利器。
-
数据源(datasource )
数据的存储源,它定义了将用什么方式来查询数据展示在grafana上面,不同的datasource拥有不同的查询语法,grafana支持多种数据源,官方支持以下数据源:Graphite,InfluxDB,OpenTSDB,Prometheus,Elasticsearch,CloudWatch。
每个数据源的查询语言和能力各不同,我们可以将来自多个数据源的数据组合到一个仪表盘中,但是每个面板都绑定到属于特定组织的特定数据源。
-
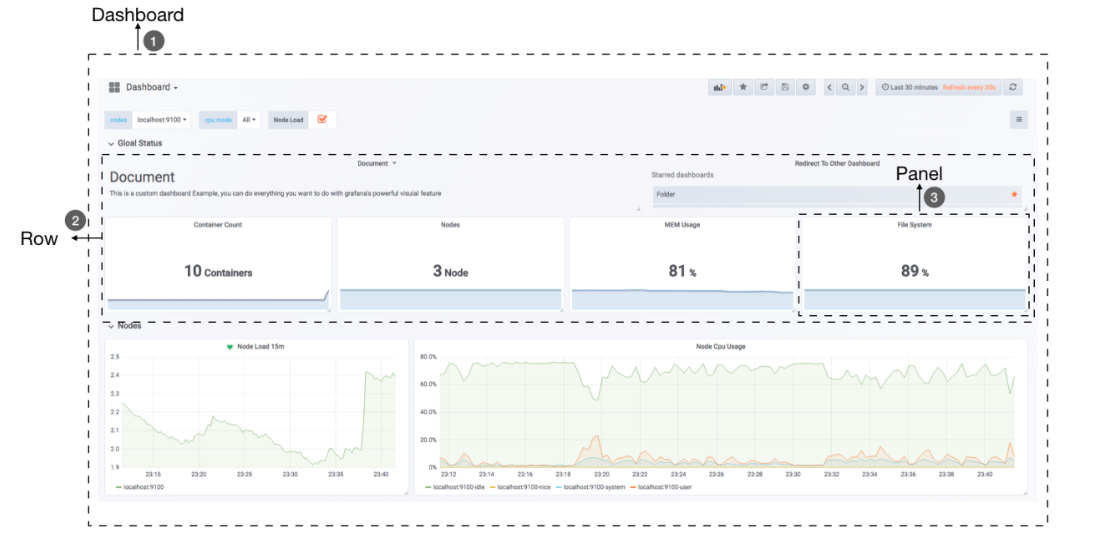
仪表盘(Dashboard )
通过数据源定义好可视化的数据来源之后,对于用户而言最重要的事情就是实现数据的可视化。在Grafana中,我们通过Dashboard来组织和管理我们的数据可视化图表。
(2)、Grafana的安装与配置
Grafana的安装非常简单,官方就有软件仓库可以直接使用,也可以通过docker镜像等方式直接本地启动。还可以直接下载rpm包、二进制包进行安装。
大家可以从 https://grafana.com/get 下载Grafana安装包,然后根据需要的系统平台及性能下载即可,官方给出了非常详细的安装方法,例如,要通过rpm包安装在Redhat & Centos平台,可直接执行如下命令:
[root@localhost ~]# wget https://dl.grafana.com/oss/release/grafana-8.3.3-1.x86_64.rpm
[root@localhost ~]#  yum localinstall grafana-8.3.3-1.x86_64.rpm
安装完毕后,启动grafana,访问 http://your-host:3000 就可以看到登录界面了。默认的用户名和密码都是admin。
本文是在centos7.x版本下进行的安装,安装方法与上面相同,安装完毕后,设置一些服务自启动即可,操作如下:
[root@localhost ~]# systemctl enable grafana-server #开启自启动
[root@localhost ~]# systemctl start grafana-server #启动服务
[root@localhost ~]# systemctl status grafana-server #查看服务是否正常启动
Grafana的配置文件位于/etc/grafana/grafana.ini,一般情况下无需修改配置文件。这样,安装就完成了。非常简单。
配置promethes的信息
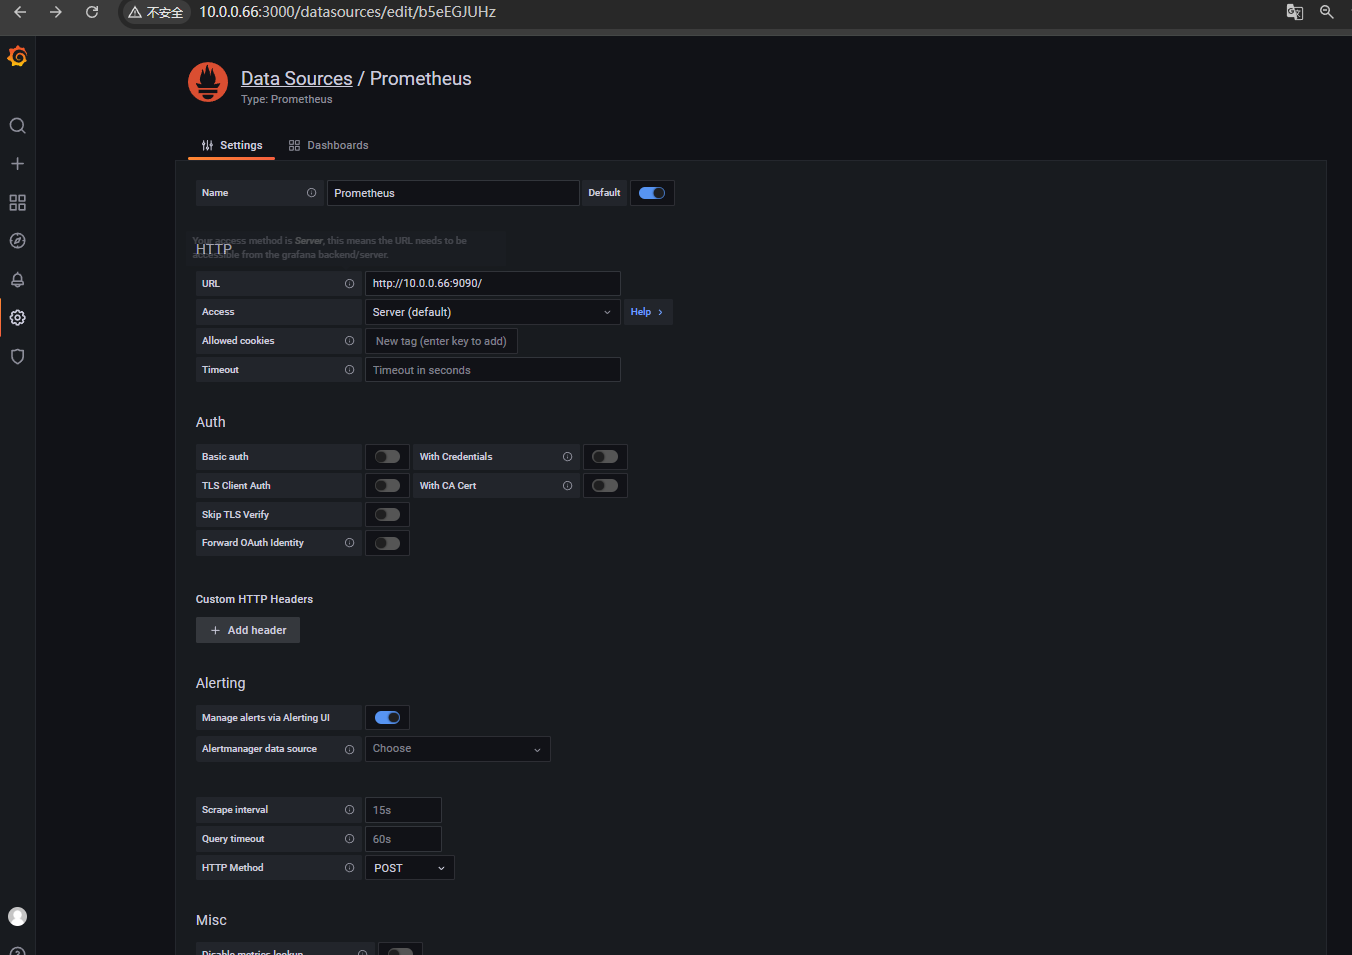
(4)、配置prometheus数据源
Grafana已经默认自带了Prometheus数据源,所以无需安装插件,直接使用即可。这里将添加Prometheus作为数据源,如下图所示,指定数据源类型为Prometheus并且设置Prometheus的访问地址即可:
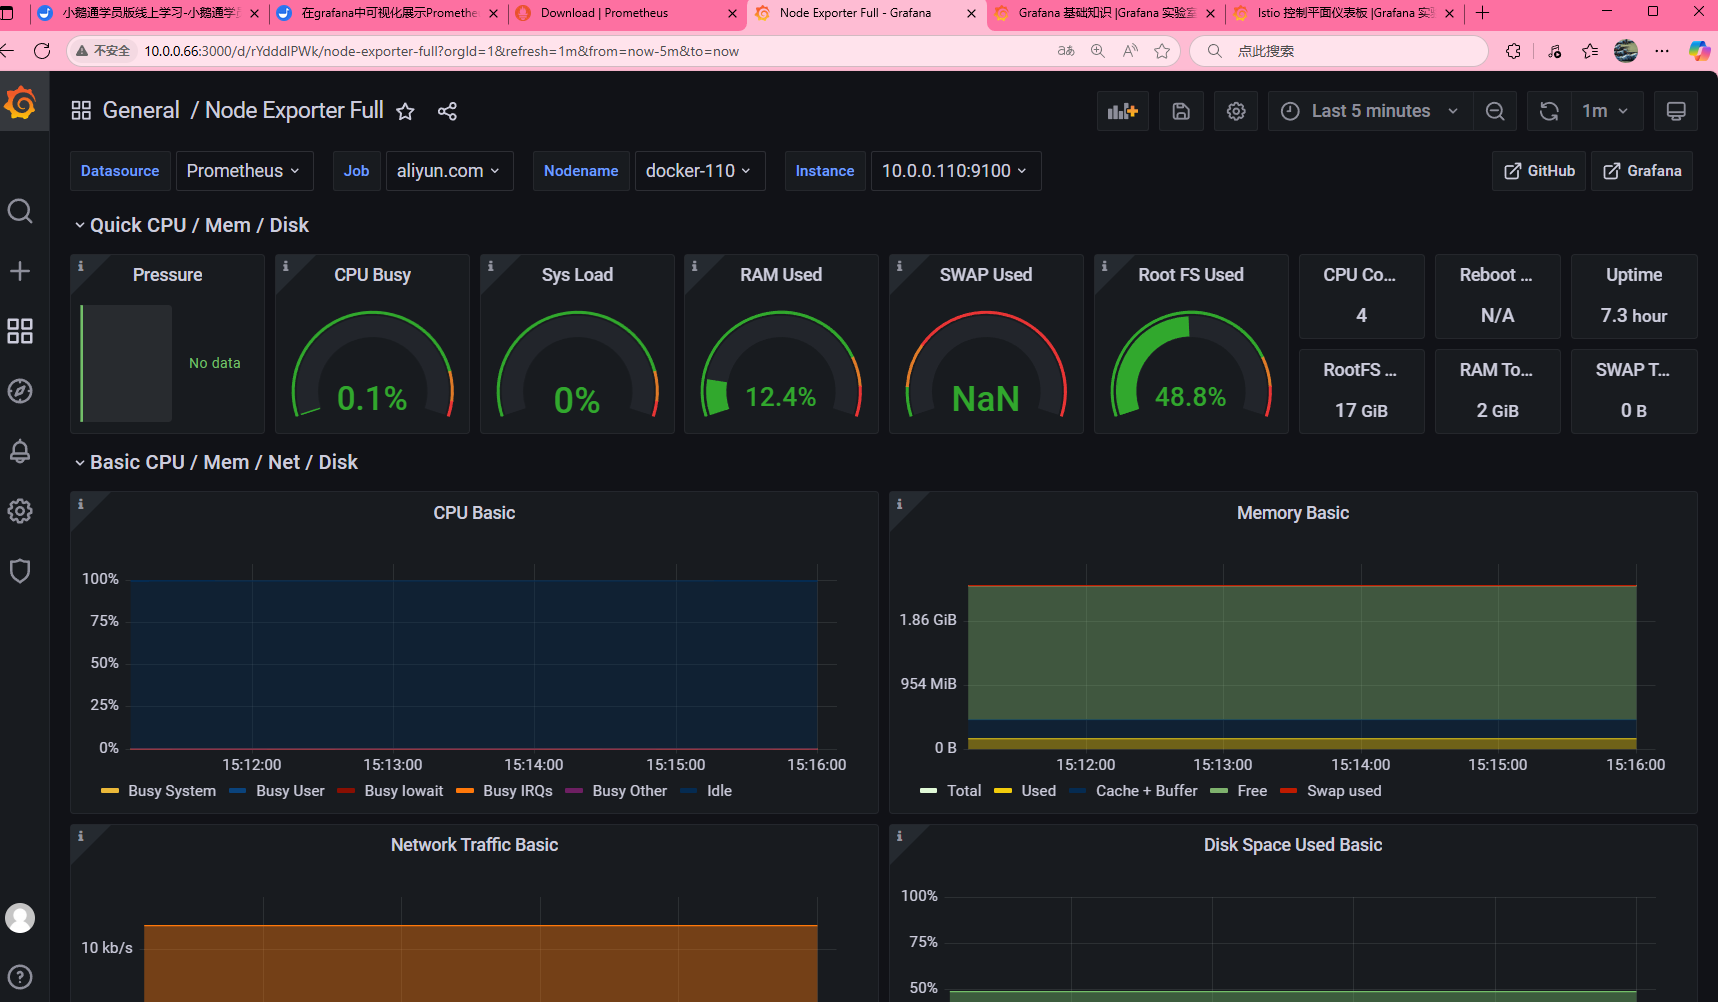
配置展示模板
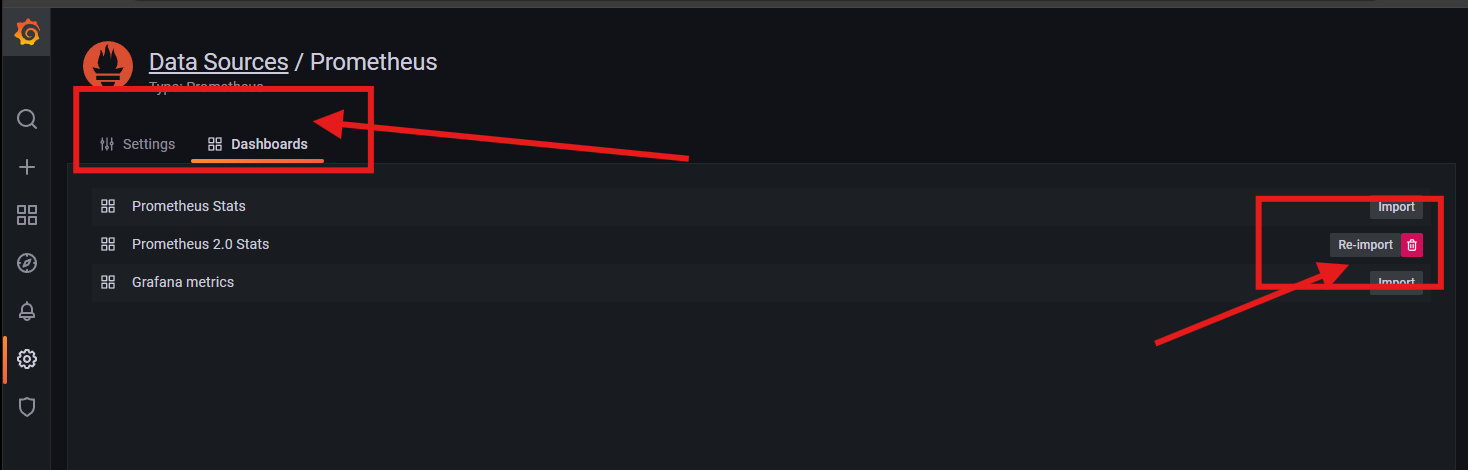
查看展示页面
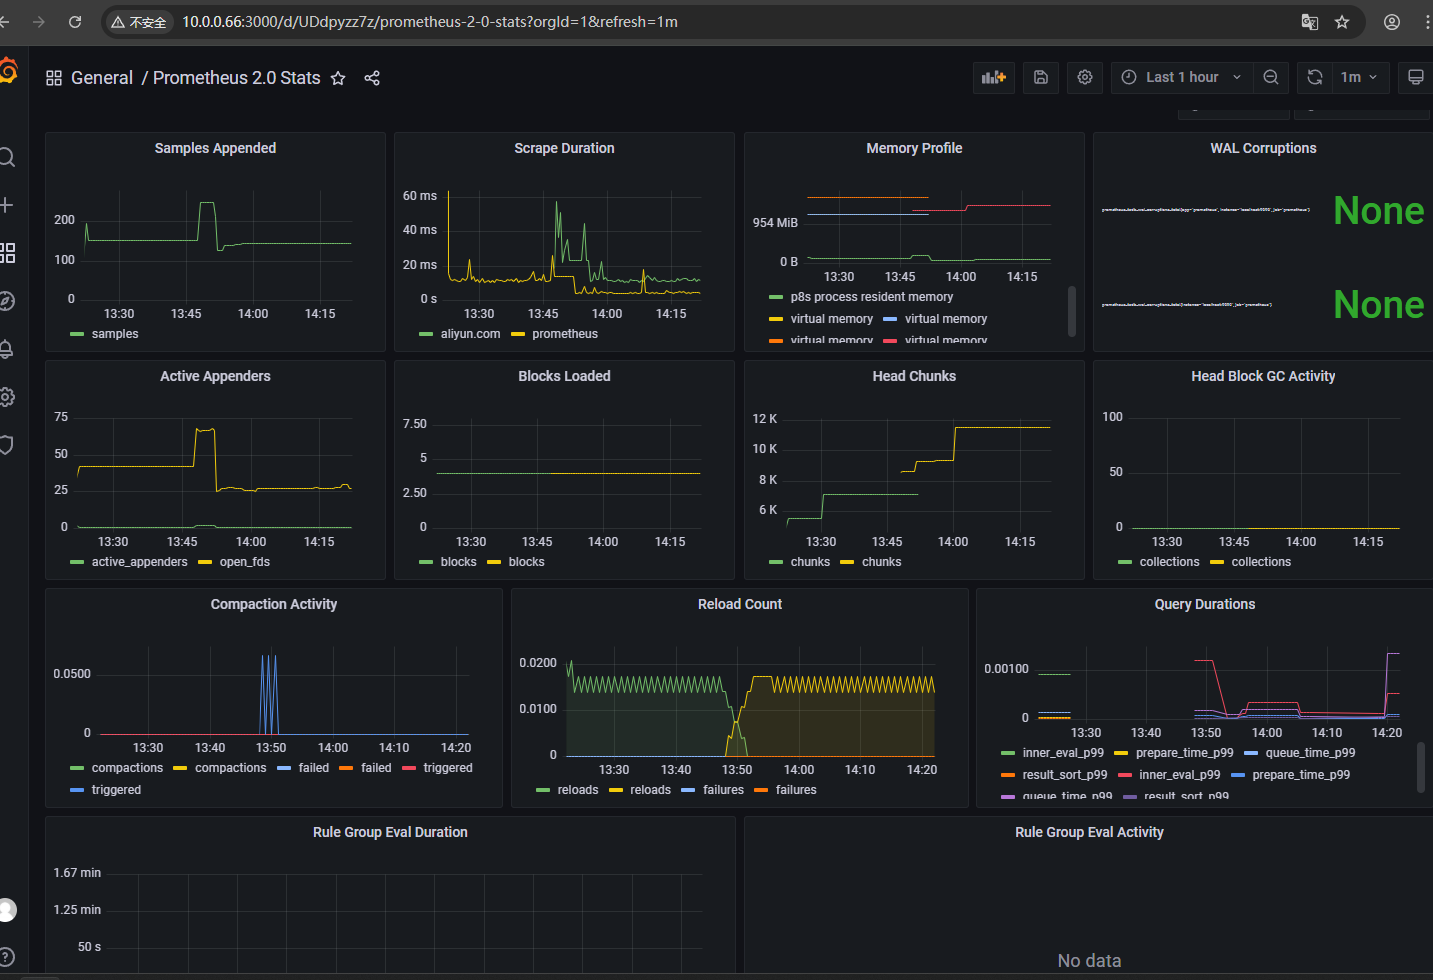
可以看到这个仪表盘不是十分的好用我们要做一个模板
获取docker可视化Dashboard
Grafana社区用户分享了大量的Dashboard,可以通过访问 https://grafana.com/dashboards 网站,找到大量可直接使用的Dashboard。推荐几个非常不错的Dashboard,可直接导入Grafana使用。
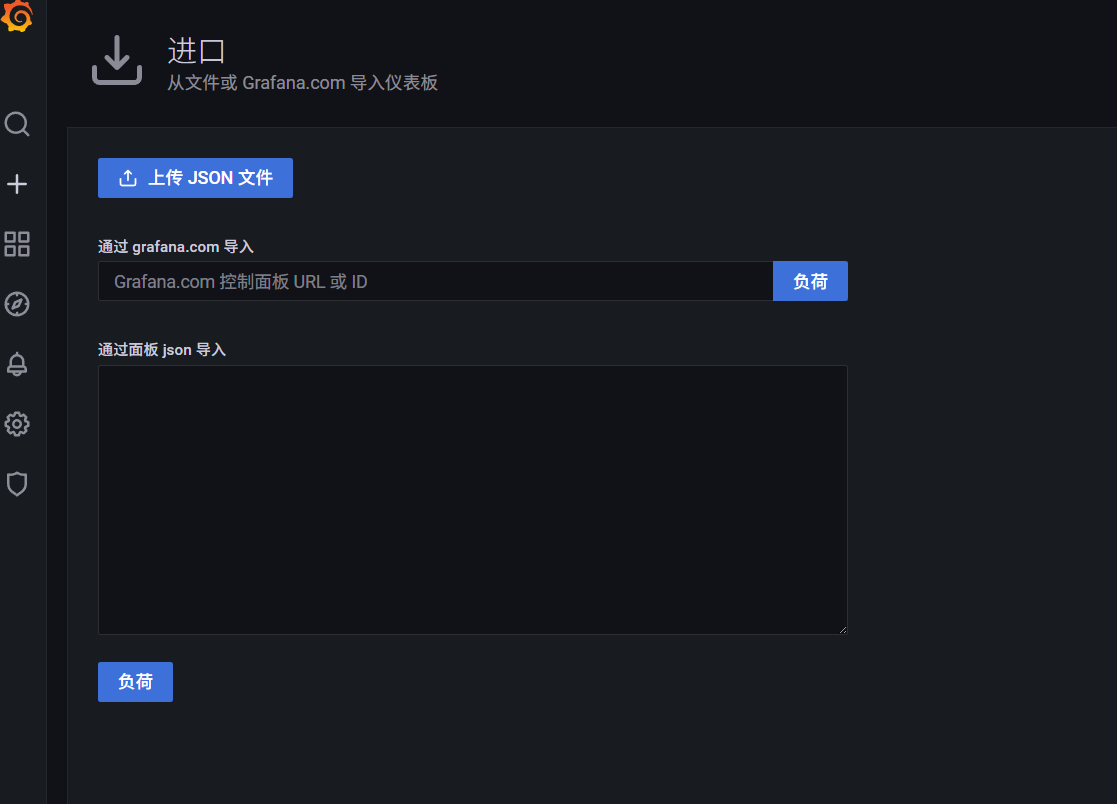
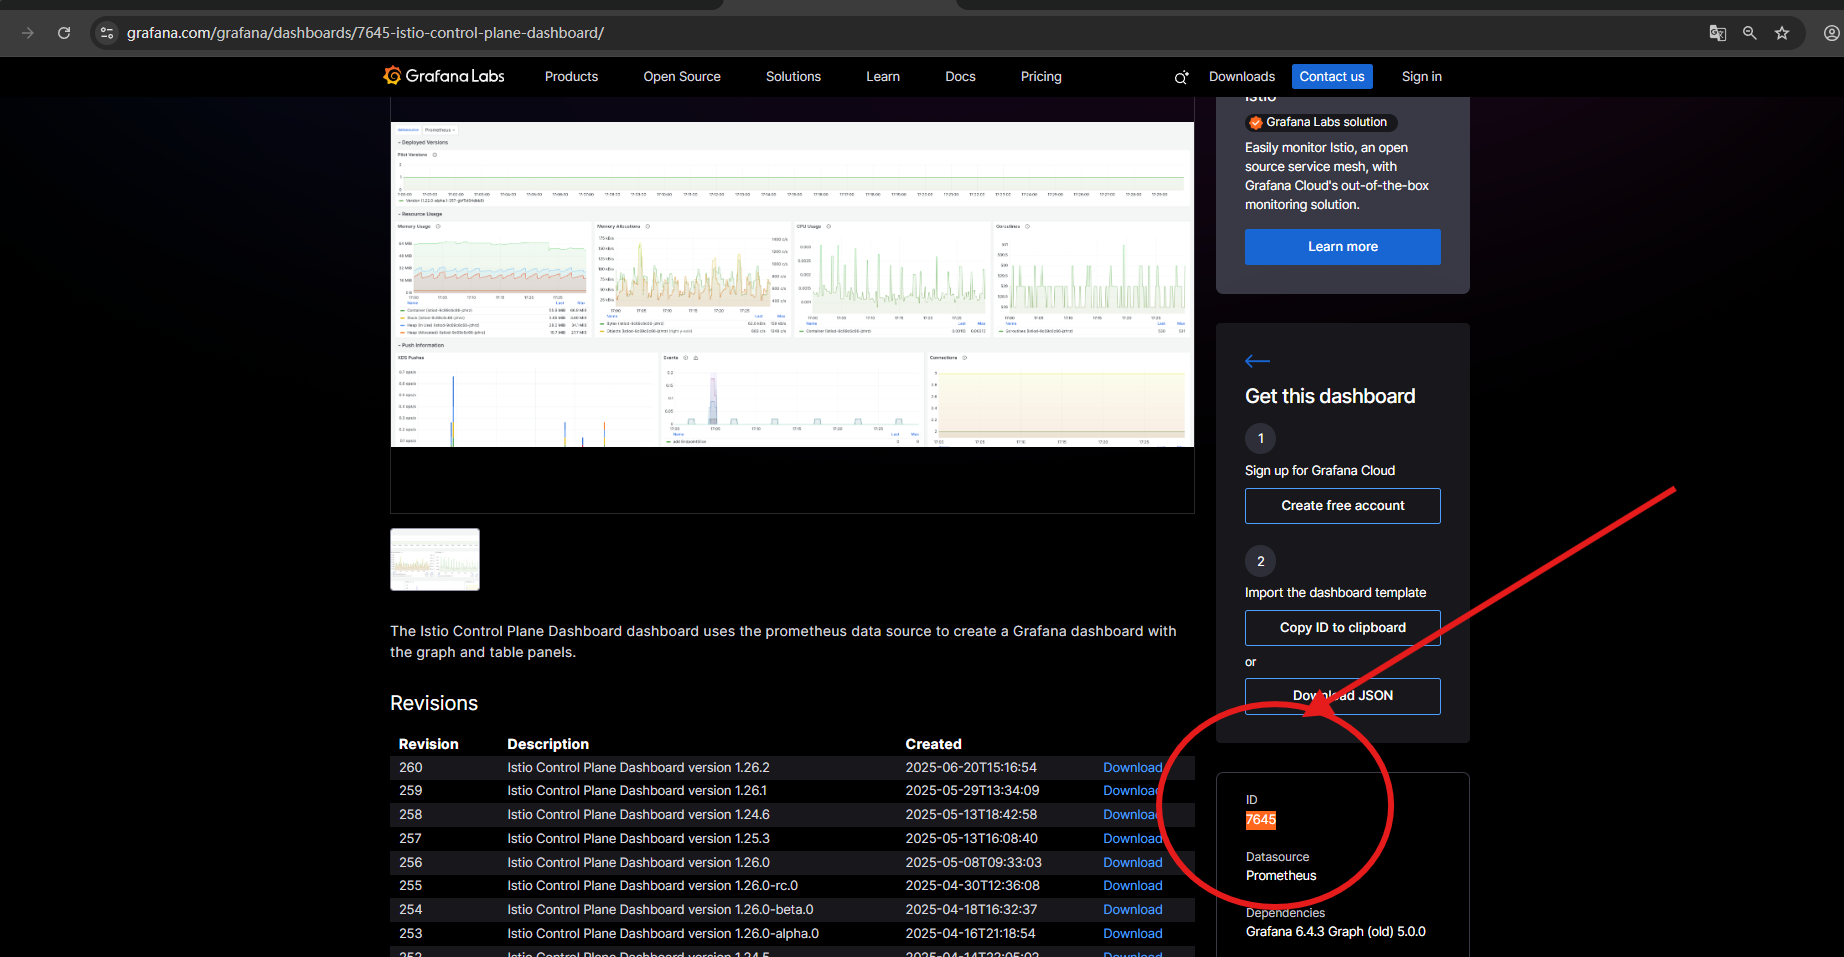
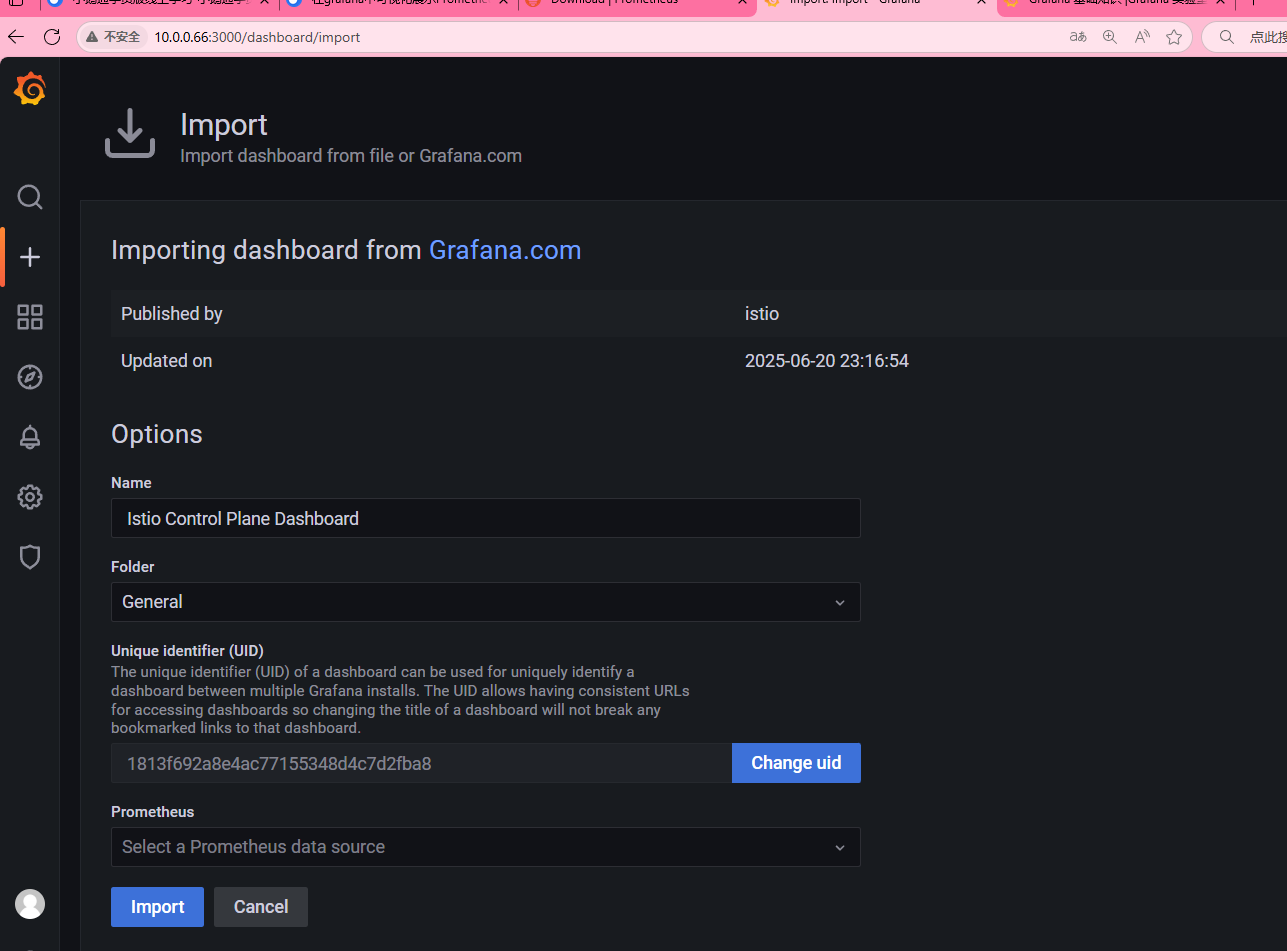
- 从这里获取模板的id号
到这里我们就对了prometheus和grafana进行了一个全面的了解后面我们将更好的学习监控服务如mysql,redis,nginx 以及后面的docker容器
看到这里可以给我点一个赞!
完结撒花🌸🌸🌸🌸🌸🌸🌸😊😊