iostat中的util原理
start
iostat - Report Central Processing Unit (CPU) statistics and input/output statistics for devices and
partitions.
带上-x选项,最后一列是一个util列,这个值很重要,体现这个设备忙不忙。
就像windows中的任务管理器看磁盘一样,如果磁盘导致性能非常卡,磁盘会使用率100%,延迟也很高。
# iostat -x -d sda
Linux 6.6.0-76.0.0.69.oe2403.x86_64 (openEuler24-03) 	2025年06月23日 	_x86_64_	(4 CPU)Device            r/s     rkB/s   rrqm/s  %rrqm r_await rareq-sz     w/s     wkB/s   wrqm/s  %wrqm w_await wareq-sz     d/s     dkB/s   drqm/s  %drqm d_await dareq-sz     f/s f_await  aqu-sz  %util
sda              0.11      5.13     0.03  18.58    7.52    46.59    0.10      5.07     0.11  52.17   21.73    50.01    0.00      0.00     0.00   0.00    0.00     0.00    0.04    0.53    0.00   0.07
find
strace跟一下,貌似只取了/sys/block/sda/stat一个地方的数据来源
# strace iostat -x -d sda
openat(AT_FDCWD, "/sys/block/sda/stat", O_RDONLY) = 4
read(4, "   68429    15611  6376443   514"..., 4096) = 153
close(4)                                = 0
write(1, "", 0)                         = 0
write(1, "avg-cpu:  %user   %nice %system "..., 56avg-cpu:  %user   %nice %system %iowait  %steal   %idle
) = 56
单独看一下里面是什么:
# cat /sys/block/sda/stat 68429 15611 6376443 514691 63205 68918 6306416 1369657 0 438338 1896195 0 0 0 0 22283 11845
kernel官网有这一篇对应的文章解释上面的字段什么意思:docs.kernel.org/_sources/block/stat.rst.txt
Name            units         description
----            -----         -----------
read I/Os       requests      number of read I/Os processed
read merges     requests      number of read I/Os merged with in-queue I/O
read sectors    sectors       number of sectors read
read ticks      milliseconds  total wait time for read requests
write I/Os      requests      number of write I/Os processed
write merges    requests      number of write I/Os merged with in-queue I/O
write sectors   sectors       number of sectors written
write ticks     milliseconds  total wait time for write requests
in_flight       requests      number of I/Os currently in flight
io_ticks        milliseconds  total time this block device has been active
time_in_queue   milliseconds  total wait time for all requests
discard I/Os    requests      number of discard I/Os processed
discard merges  requests      number of discard I/Os merged with in-queue I/O
discard sectors sectors       number of sectors discarded
discard ticks   milliseconds  total wait time for discard requests
但是。。。好像数量对不上呀。。。。上面有17个,表格里只有15个。。。。
看一下内核里这一段如何实现的:
block/genhd.c: 438enum stat_group {STAT_READ,STAT_WRITE,STAT_DISCARD,		// 丢弃STAT_FLUSH,NR_STAT_GROUPS
};linux-5.10.202/block/genhd.c: 95static void part_stat_read_all(struct hd_struct *part, struct disk_stats *stat)
{int cpu;memset(stat, 0, sizeof(struct disk_stats));for_each_possible_cpu(cpu) {struct disk_stats *ptr = per_cpu_ptr(part->dkstats, cpu);int group;for (group = 0; group < NR_STAT_GROUPS; group++) {      # 循环4次,填充16个stat->nsecs[group] += ptr->nsecs[group];stat->sectors[group] += ptr->sectors[group];stat->ios[group] += ptr->ios[group];stat->merges[group] += ptr->merges[group];}stat->io_ticks += ptr->io_ticks;                        # 加上这个,正好17个}
}
/root/qemu/linux-5.10.202/block/genhd.c: 1302ssize_t part_stat_show(struct device *dev,struct device_attribute *attr, char *buf)
{struct hd_struct *p = dev_to_part(dev);  // struct hd_struct中含有dev,hd_struct描述块设备中的分区part_stat_read_all(p, &stat);            // 上面的函数收集statreturn sprintf(buf,"%8lu %8lu %8llu %8u ""%8lu %8lu %8llu %8u ""%8u %8u %8u ""%8lu %8lu %8llu %8u ""%8lu %8u""\n",stat.ios[STAT_READ],stat.merges[STAT_READ],(unsigned long long)stat.sectors[STAT_READ],(unsigned int)div_u64(stat.nsecs[STAT_READ], NSEC_PER_MSEC),stat.ios[STAT_WRITE],stat.merges[STAT_WRITE],(unsigned long long)stat.sectors[STAT_WRITE],(unsigned int)div_u64(stat.nsecs[STAT_WRITE], NSEC_PER_MSEC),inflight,jiffies_to_msecs(stat.io_ticks),(unsigned int)div_u64(stat.nsecs[STAT_READ] +stat.nsecs[STAT_WRITE] +stat.nsecs[STAT_DISCARD] +stat.nsecs[STAT_FLUSH],NSEC_PER_MSEC),stat.ios[STAT_DISCARD],stat.merges[STAT_DISCARD],(unsigned long long)stat.sectors[STAT_DISCARD],(unsigned int)div_u64(stat.nsecs[STAT_DISCARD], NSEC_PER_MSEC),stat.ios[STAT_FLUSH],(unsigned int)div_u64(stat.nsecs[STAT_FLUSH], NSEC_PER_MSEC));
when
上面的stat结构体的信息都是在什么时候触发的?
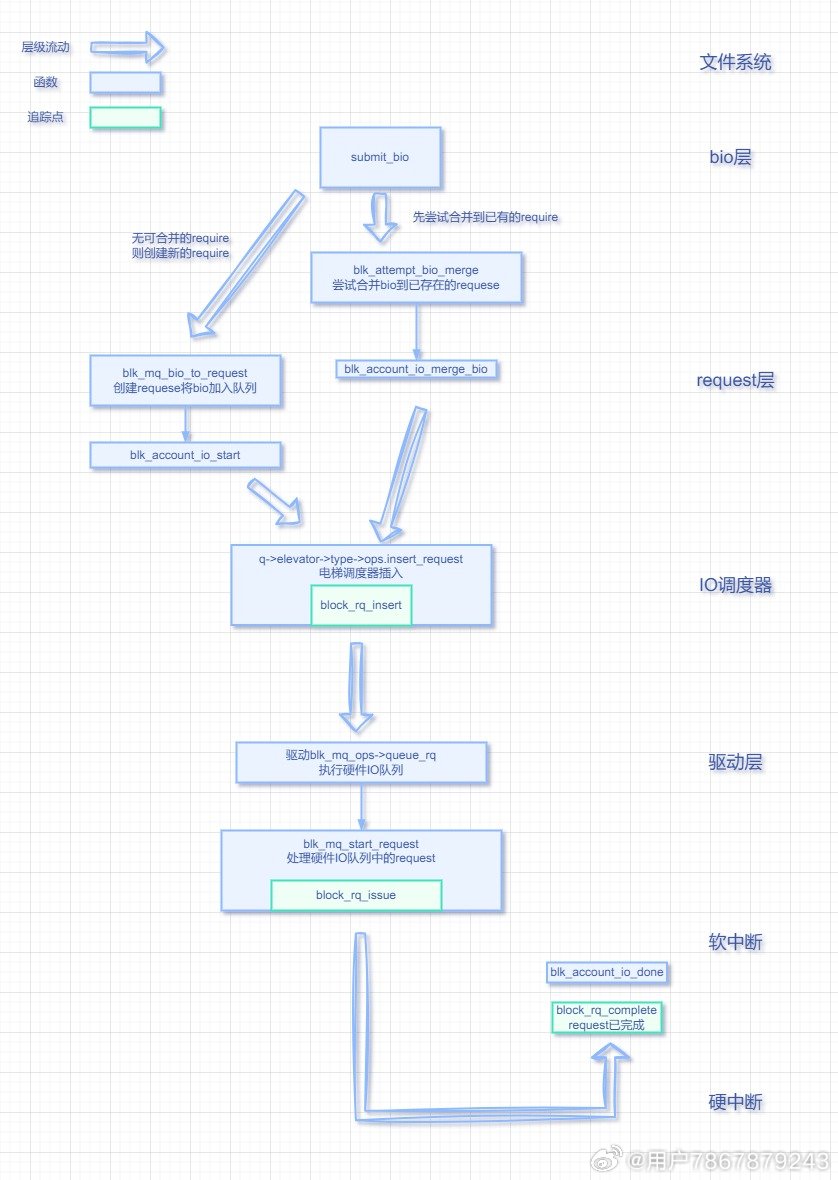
提交io块的时候记录时间戳
#1  0xffffffff8152e2e7 in blk_mq_bio_to_request (nr_segs=<optimized out>, bio=<optimized out>, rq=0xffff888005a1c780) at block/blk-mq.c:1944
#2  blk_mq_submit_bio (bio=<optimized out>, bio@entry=0xffff888006ec0000) at block/blk-mq.c:2194
#3  0xffffffff81521ac4 in __submit_bio_noacct_mq (bio=0xffff888006ec0000) at block/blk-core.c:1020
#4  submit_bio_noacct (bio=<optimized out>) at block/blk-core.c:1053
#5  submit_bio_noacct (bio=<optimized out>) at block/blk-core.c:1036
#6  0xffffffff8142e82d in ext4_mpage_readpages (inode=<optimized out>, rac=0xffffc90001253a88, page=<optimized out>) at fs/ext4/readpage.c:412/root/qemu/linux-5.10.202/block/blk-mq.c: 1928static void blk_mq_bio_to_request(struct request *rq, struct bio *bio,unsigned int nr_segs)
{......blk_account_io_start(rq);/root/qemu/linux-5.10.202/block/blk-core.c: 1309void blk_account_io_start(struct request *rq)
{update_io_ticks(rq->part, jiffies, false);/root/qemu/linux-5.10.202/block/blk-core.c: 1257static void update_io_ticks(struct hd_struct *part, unsigned long now, bool end)
{unsigned long stamp;
again:stamp = READ_ONCE(part->stamp);if (unlikely(stamp != now)) {if (likely(cmpxchg(&part->stamp, stamp, now) == stamp))__part_stat_add(part, io_ticks, end ? now - stamp : 1);
合并io请求计数,发生在文件系统层提价bio之后
#0  blk_account_io_merge_bio (req=0xffff888005a24280) at block/blk-merge.c:920
#1  blk_account_io_merge_bio (req=0xffff888005a24280) at block/blk-merge.c:914
#2  0xffffffff815286bb in bio_attempt_back_merge (req=req@entry=0xffff888005a24280, bio=bio@entry=0xffff888006ec06c0, nr_segs=nr_segs@entry=1) at block/blk-merge.c:950
#3  0xffffffff81528c74 in blk_attempt_bio_merge (q=q@entry=0xffff8880055ec7e8, rq=rq@entry=0xffff888005a24280, bio=bio@entry=0xffff888006ec06c0, nr_segs=nr_segs@entry=1, sched_allow_merge=sched_allow_merge@entry=false) at block/blk-merge.c:1017
#4  0xffffffff81528f84 in blk_attempt_bio_merge (sched_allow_merge=false, nr_segs=<optimized out>, bio=0xffff888006ec06c0, rq=0xffff888005a24280, q=<optimized out>) at block/blk-merge.c:1011
#5  blk_attempt_plug_merge (q=q@entry=0xffff8880055ec7e8, bio=0xffff888006ec06c0, nr_segs=1, same_queue_rq=same_queue_rq@entry=0xffffc900010ffbf8) at block/blk-merge.c:1080
#6  0xffffffff8152e3e6 in blk_mq_submit_bio (bio=<optimized out>, bio@entry=0xffff888006ec06c0) at block/blk-mq.c:2171
#7  0xffffffff81521ac4 in __submit_bio_noacct_mq (bio=0xffff888006ec06c0) at block/blk-core.c:1020
#8  submit_bio_noacct (bio=<optimized out>) at block/blk-core.c:1053
#9  submit_bio_noacct (bio=<optimized out>) at block/blk-core.c:1036
#10 0xffffffff8138641a in submit_bh_wbc (op=op@entry=1, op_flags=<optimized out>, op_flags@entry=2048, bh=bh@entry=0xffff8880085688f0, write_hint=write_hint@entry=WRITE_LIFE_NOT_SET, wbc=wbc@entry=0x0 <fixed_percpu_data>) at fs/buffer.c:3054
#11 0xffffffff8138645f in submit_bh (op=op@entry=1, op_flags=op_flags@entry=2048, bh=bh@entry=0xffff8880085688f0) at fs/buffer.c:3060
#12 0xffffffff8145e2fd in jbd2_journal_commit_transaction (journal=journal@entry=0xffff888005b6a000) at fs/jbd2/commit.c:777jbd2来自于ext4文件系统的日志操作,可以理解为#12是文件系统层工作/root/qemu/linux-5.10.202/block/blk-merge.c: 914static void blk_account_io_merge_bio(struct request *req)
{if (!blk_do_io_stat(req))return;part_stat_lock();part_stat_inc(req->part, merges[op_stat_group(req_op(req))]);
io完成计数,从软中断触发,硬盘驱动通知事件完成了,触发硬盘软中断,在软中断中记录事件结束,接下来就是回收资源了
#0  blk_account_io_done (req=req@entry=0xffff888005a24280, now=now@entry=12338235874909) at block/blk-core.c:1301
#1  0xffffffff8152c09f in __blk_mq_end_request (error=0 '\000', rq=0xffff888005a24280) at block/blk-mq.c:553
#2  blk_mq_end_request (rq=0xffff888005a24280, error=0 '\000') at block/blk-mq.c:568
#3  0xffffffff8152afb5 in blk_done_softirq (h=<optimized out>) at block/blk-mq.c:590
#4  0xffffffff81e000c5 in __do_softirq () at kernel/softirq.c:29/root/qemu/linux-5.10.202/block/blk-core.c: 1285void blk_account_io_done(struct request *req, u64 now)
{update_io_ticks(part, jiffies, true);           // io时间计时part_stat_inc(part, ios[sgrp]);
io_ticks:
上一次完成之后的第一次请求,记录时间戳
新请求时候记录时间戳,此值 += 1
一个请求队列完成时候 += 最近一次请求到现在的时间差
统计扇区,依然是在软中断触发中计数,也就是io完成时候才计数
#0  blk_account_io_completion (bytes=16384, req=0xffff888005a90000) at block/blk-core.c:1275
#1  blk_update_request (req=req@entry=0xffff888005a90000, error=error@entry=0 '\000', nr_bytes=16384) at block/blk-core.c:1456
#2  0xffffffff8152c04a in blk_mq_end_request (rq=0xffff888005a90000, error=0 '\000') at block/blk-mq.c:566
#3  0xffffffff8152afb5 in blk_done_softirq (h=<optimized out>) at block/blk-mq.c:590
#4  0xffffffff81e000c5 in __do_softirq () at kernel/softirq.c:298/root/qemu/linux-5.10.202/block/blk-core.c: 1272static void blk_account_io_completion(struct request *req, unsigned int bytes)	// 统计信息添加到 req->part->dsstats->sectors
{if (req->part && blk_do_io_stat(req)) {const int sgrp = op_stat_group(req_op(req));struct hd_struct *part;part_stat_lock();part = req->part;part_stat_add(part, sectors[sgrp], bytes >> 9);
flush 完成,也是在软中断完成,flush事件有专门的软中断完成回调
#0  blk_account_io_flush (rq=0xffff888005840000) at block/blk-flush.c:142
#1  flush_end_io (flush_rq=0xffff888005840000, error=0 '\000') at block/blk-flush.c:232
#2  0xffffffff8152afb5 in blk_done_softirq (h=<optimized out>) at block/blk-mq.c:590
#3  0xffffffff81e000c5 in __do_softirq () at kernel/softirq.c:298/root/qemu/linux-5.10.202/block/blk-flush.c: 140static void blk_account_io_flush(struct request *rq)
{struct hd_struct *part = &rq->rq_disk->part0;part_stat_inc(part, ios[STAT_FLUSH]);part_stat_add(part, nsecs[STAT_FLUSH],ktime_get_ns() - rq->start_time_ns);
so
struct disk_stats {u64 nsecs[NR_STAT_GROUPS];unsigned long sectors[NR_STAT_GROUPS];		// 扇区操作计数,操作完成时计数unsigned long ios[NR_STAT_GROUPS];          // io请求次数,操作完成时计数,注:一次io不代表一个页,一个io可能多个页,io以页为单位unsigned long merges[NR_STAT_GROUPS];       // 合并请求计数,新增请求可以和之前的请求合并为一个队列unsigned long io_ticks;                     // io总花费时钟节拍数local_t in_flight[2];                       // 无需关注
};
util
util的计算:
/root/sysstat/BUILD/sysstat-12.7.5/rd_stats.c: 432/***************************************************************************** Compute "extended" device statistics (service time, etc.).** IN:* @sdc		Structure with current device statistics.* @sdp		Structure with previous device statistics.* @itv		Interval of time in 1/100th of a second.** OUT:* @xds		Structure with extended statistics.** USED BY:* sar, sadf, iostat***************************************************************************
*/
void compute_ext_disk_stats(struct stats_disk *sdc, struct stats_disk *sdp,unsigned long long itv, struct ext_disk_stats *xds)
{xds->util  = sdc->tot_ticks < sdp->tot_ticks ?0.0 :S_VALUE(sdp->tot_ticks, sdc->tot_ticks, itv);/root/sysstat/BUILD/sysstat-12.7.5/common.h: 163/* With S_VALUE macro, the interval of time (@p) is given in 1/100th of a second */
#define S_VALUE(m,n,p)		(((double) ((n) - (m))) / (p) * 100)
tot_ticks对应内核中的jiffies_to_msecs(stat.io_ticks),
util = 此刻设备io总计耗时 - 上一刻设备io总计耗时 / 时间差
即,util = 这段时间内多长时间用来处理此设备IO。
但,util为100%并不意味着设备硬件本身100%忙碌,因为 io_ticks 统计的是入队到完成,入队后还有io调度。