echarts在折线图与0刻度线交汇处 添加markPoint
背景:
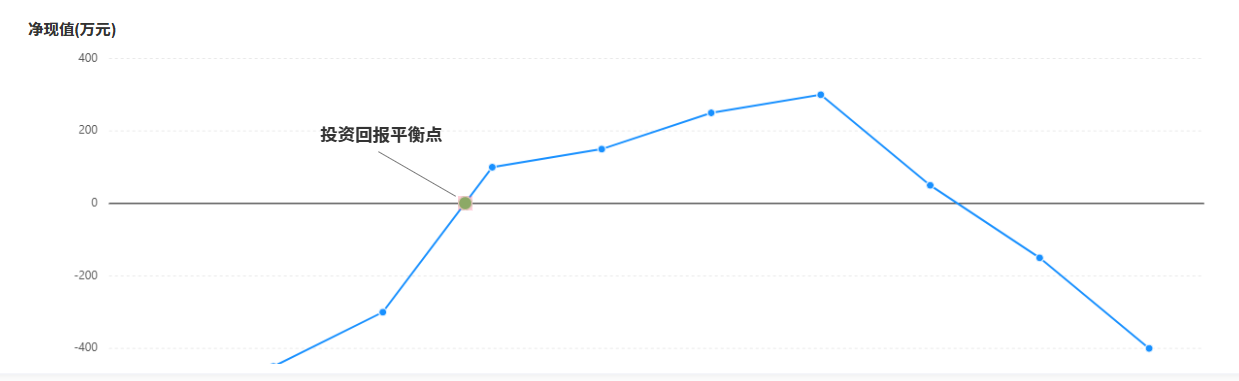
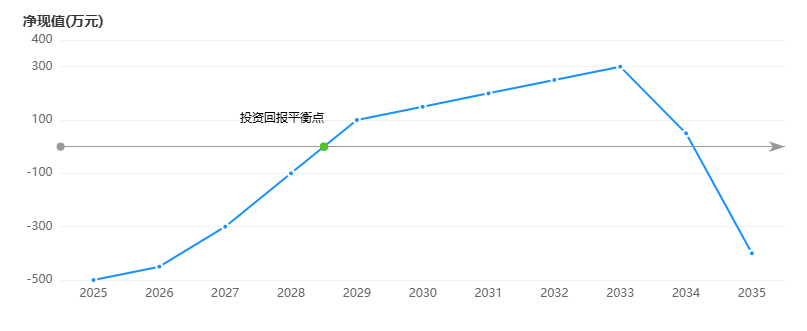
项目需求,需要再echarts折线图与0刻度线交汇的地方添加一个marker。如下图
问题
但是存在一个问题,实际交汇处并非x轴对应的数据点,是介于两者之间的情况,如下图
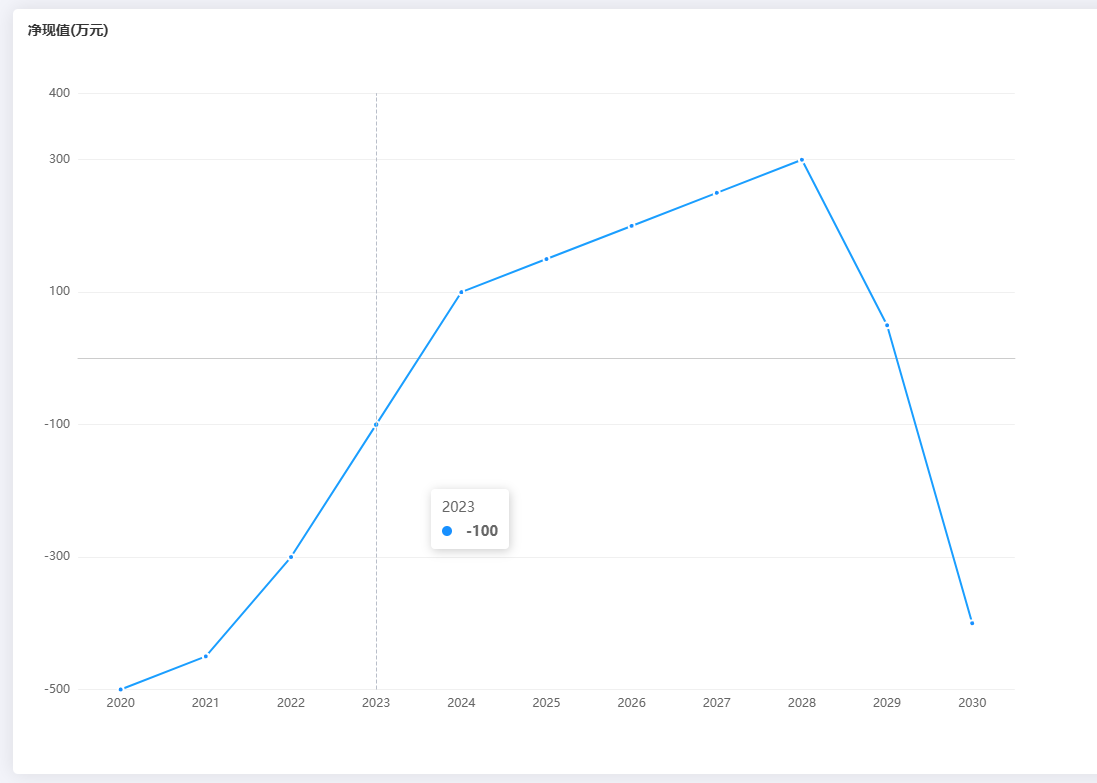
交汇点处于2023-2024之间。
遇事不决问Ai,但是ai给出的结论有点智障,看起来行,给出了coord :[3.5, 0]的写法,开始还感觉挺厉害,这么快给出了结果,一测试,还是不太行。根本不支持
markPoint默认的coord 并不支持不存在节点的定位。这个属性,只能在已有X轴数据上做选中。
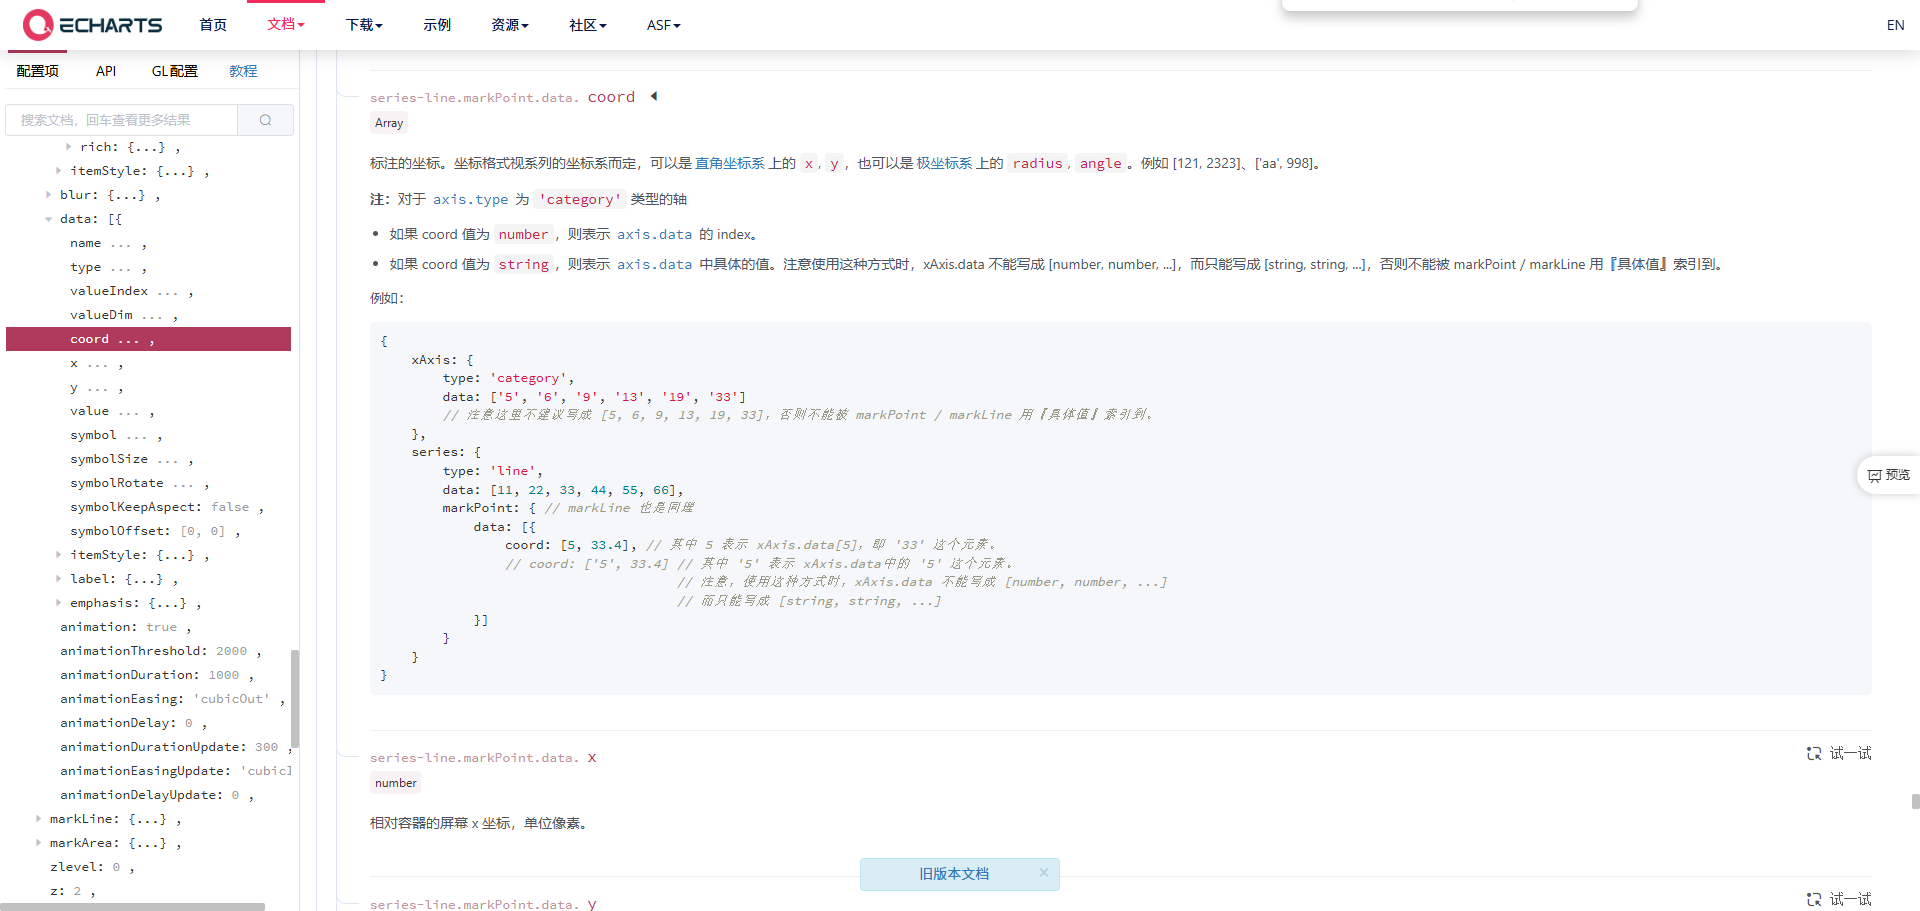
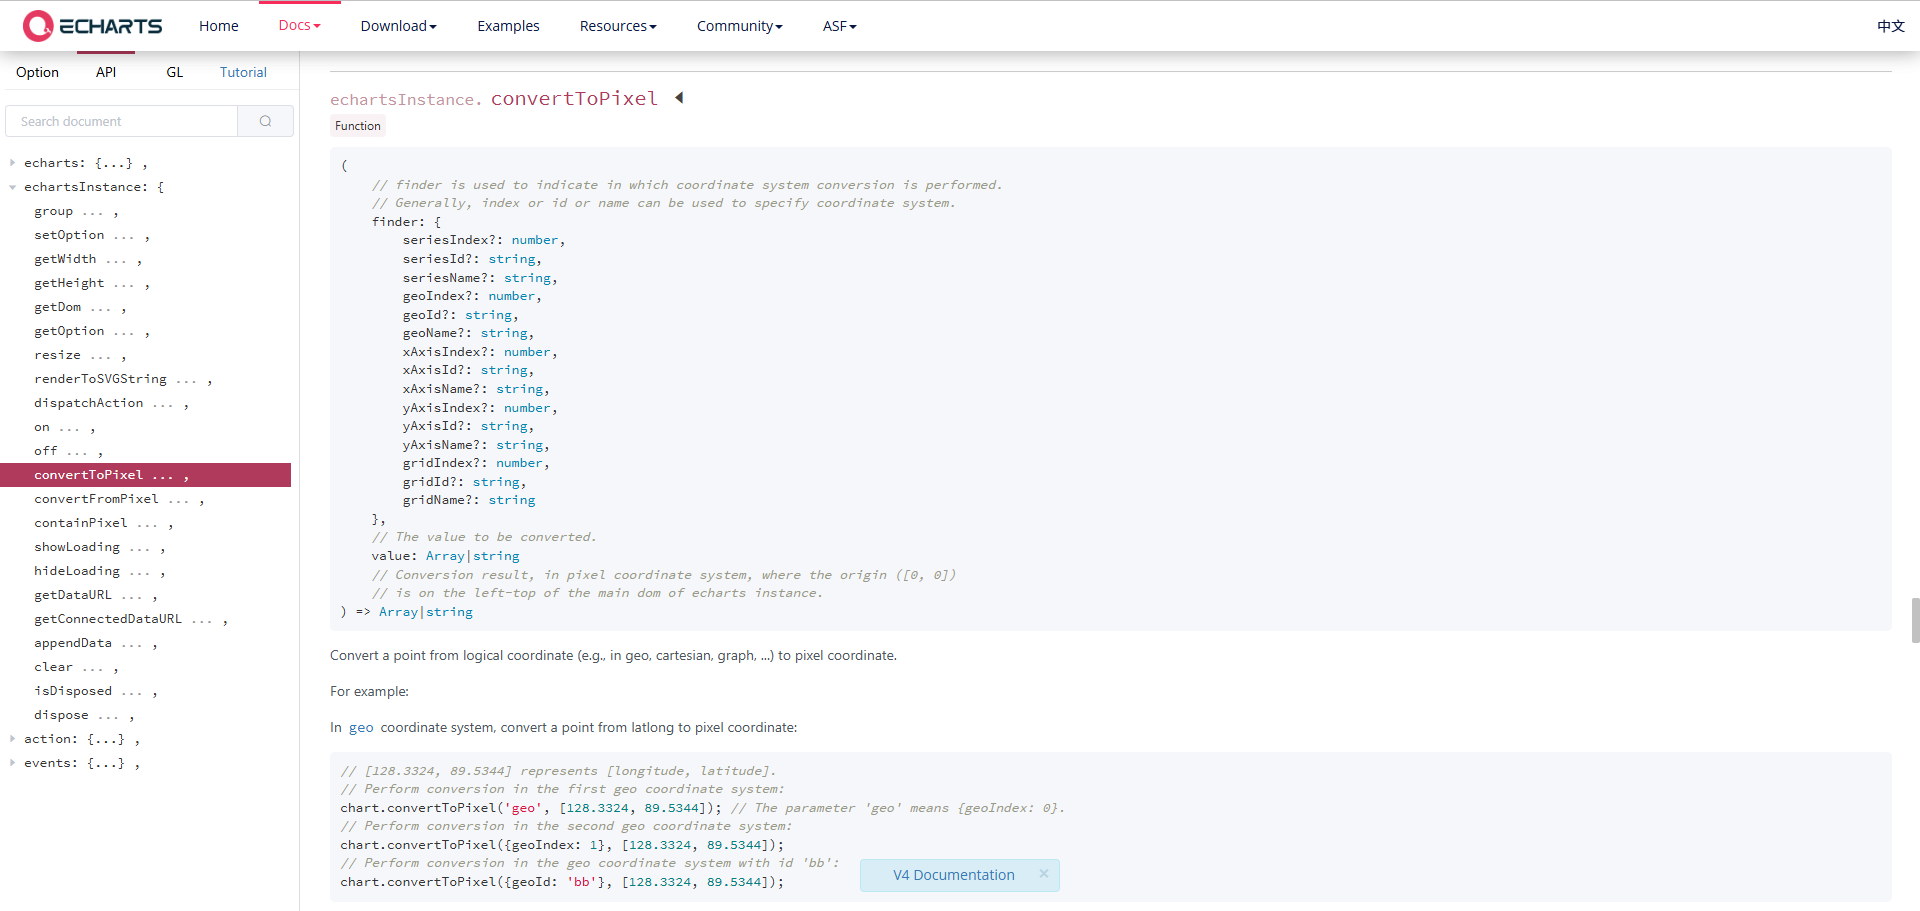
百度,google搜索半天,没有进展,于是只能翻文档,找到了convertToPixel方法和markPoint对应的x,y自定义坐标,
思路
使用markPoint属性中的x,y精确定位。随便输入了下,是可以在任意位置标点的。只要算出这个交汇处的x,y坐标,填入即可
简单说就是先寻找跨越0刻度线的两个点,然后转换出对应坐标。通过这两个坐标再计算出新的交汇点坐标
// 寻找跨越0刻度线的相邻两个点
const findZeroCrossingPoints = (dataArr) => {console.log(dataArr);for (const index in dataArr) {const item = dataArr[index];const nextItem = dataArr[Number(index) + 1];if (item.value === 0) {return [{ x: item.year, y: item.value, index },{ x: item.year, y: item.value, index },];} else if (nextItem?.value === 0) {return [{ x: nextItem.year, y: nextItem.value, index },{ x: nextItem.year, y: nextItem.value, index },];} else if (item.value * nextItem?.value < 0) {return [{ x: item.year, y: item.value, index },{ x: nextItem.year, y: nextItem.value, index },];}}return [0, 0];
};
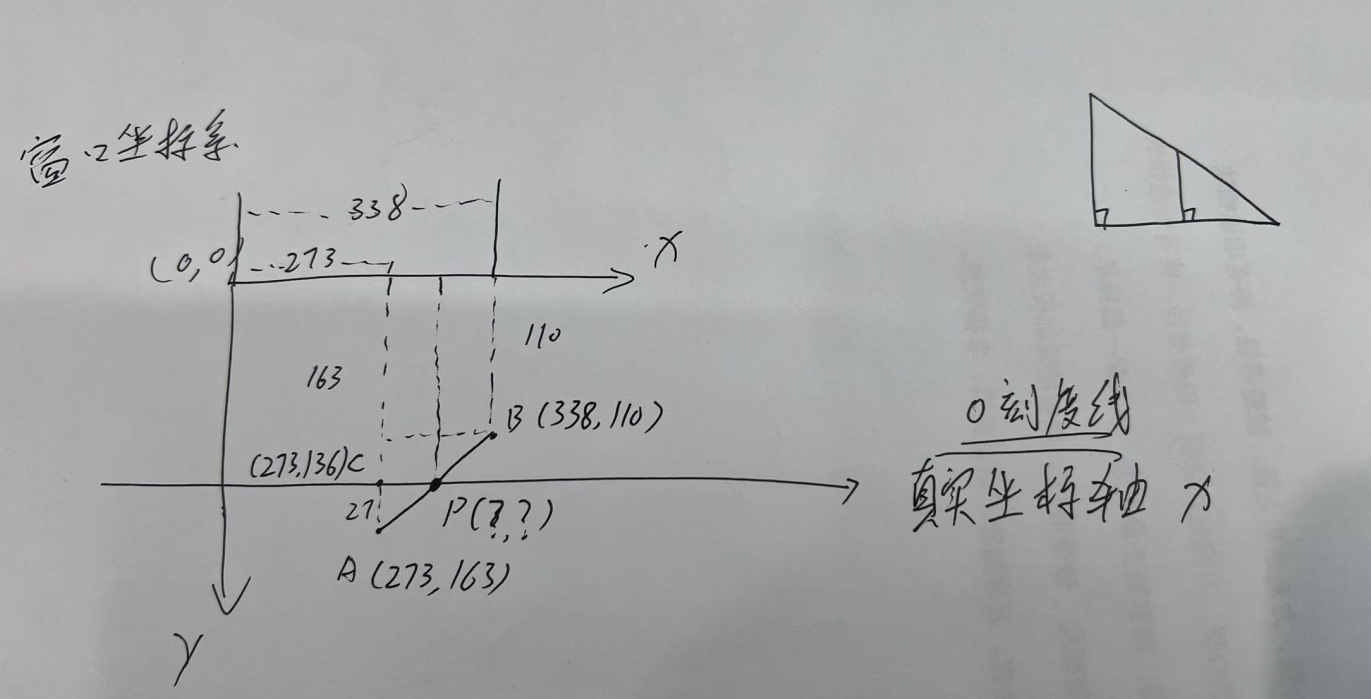
找到跨越0刻度线的相邻两个点(A和B)之后,根据A找到对应C坐标,计算出对应交汇点P
点位草图
// vchartRef.value 是echarts实例,根据项目修改即可
// 根据跨越0刻度线的两点,计算零点具体位置
const getZeroPoints = (startItem, endItem) => {console.log("startItem", startItem);const [pointAx, pointAy] = vchartRef.value?.convertToPixel?.("grid", [startItem.x,startItem.y,]) ?? [0, 0];const [pointBx, pointBy] = vchartRef.value?.convertToPixel?.("grid", [endItem.x,endItem.y,]) ?? [0, 0];const [pointCx, pointCy] = vchartRef.value?.convertToPixel?.("grid", [startItem.x,0,]) ?? [0, 0];// 根据两点真是坐标和起点0刻度线对应位置,计算两点连线,与0刻度线交汇点的真实坐标// 斜率const k = (pointBy - pointAy) / (pointBx - pointAx);// 截距const b = pointAy - k * pointAx;// 计算与0刻度线交汇点Pconst px = (pointCy - b) / k;const py = k * px + b;console.log("起点x,对应0刻度线位置", [px, py]);return [px, py];
};
效果图
最后完整代码,vue3+vue-echars,
<template><div class="chart"><VChart :option="option" autoresize ref="vchartRef" /></div>
</template>
<script setup lang="ts">
import { EChartsOption } from "echarts";
import { computed, ref, watch, nextTick } from "vue";
import VChart from "vue-echarts";
const props = defineProps<{chartsData: any;
}>();const option = ref({});
const vchartRef = ref(null);const mockData = [{ year: "2025", value: -500 },{ year: "2026", value: -450 },{ year: "2027", value: -300 },{ year: "2028", value: -100 },{ year: "2029", value: 100 },{ year: "2030", value: 150 },{ year: "2031", value: 200 },{ year: "2032", value: 250 },{ year: "2033", value: 300 },{ year: "2034", value: 50 },{ year: "2035", value: -400 },
];
const updateOption = () => {const obj = {animationDuration: 2000,animationDurationUpdate: 500,title: {text: "净现值(万元)",left: "left",top: "0",textStyle: {fontSize: 14,color: "#333",},},grid: {left: "5%",right: "10%",top: "10%",bottom: "10%",},xAxis: {type: "category",data: mockData.map((item) => item.year),axisLine: {lineStyle: {color: "#ccc",},},axisTick: {show: false,},axisLabel: {color: "#666",},},yAxis: {type: "value",min: -500,max: 400,interval: 200,axisLine: {show: false,},axisTick: {show: false,},axisLabel: {color: "#666",},splitLine: {lineStyle: {color: "#f0f0f0",},},},series: [{data: mockData.map((item) => item.value),type: "line",lineStyle: {color: "#1890ff",width: 2,},itemStyle: {color: "#1890ff",borderColor: "#fff",borderWidth: 2,},symbol: "circle",symbolSize: 6,markLine: {data: [{yAxis: 0,lineStyle: {color: "#999",type: "solid",width: 1,},label: {show: false,},},],},},],tooltip: {trigger: "axis",formatter: function (params: any) {const data = params[0];return `${data.name}<br/>净现值: ${data.value}万元`;},},};option.value = obj;// 延迟更新,不然报错setTimeout(() => {console.log("vchartRef", vchartRef.value);const [startItem, endItem] = findZeroCrossingPoints(mockData);const [px, py] = getZeroPoints(startItem, endItem);// 更新options的markPointoption.value.series[0].markPoint = {data: [{value: "投资回报平衡点",x: px,y: py,label: {show: true,position: [-80, -30],formatter: "投资回报平衡点",color: "#000",fontSize: 12,},},{x: px,y: py,value: "投资回报平衡点",itemStyle: { color: "#52c41a" },label: {show: false,position: [50, -30],formatter: "实施节能措施后,3.5年达到节能平衡",color: "#000",fontSize: 18,backgroundColor: "#ddd",padding: [10, 10],borderRadius: 4,},emphasis: {label: {show: true,},},},],symbol: "circle",symbolSize: 8,};}, 2000);
};
// 根据跨越0刻度线的两点,计算零点具体位置
const getZeroPoints = (startItem, endItem) => {console.log("startItem", startItem);const [pointAx, pointAy] = vchartRef.value?.convertToPixel?.("grid", [startItem.x,startItem.y,]) ?? [0, 0];const [pointBx, pointBy] = vchartRef.value?.convertToPixel?.("grid", [endItem.x,endItem.y,]) ?? [0, 0];const [pointCx, pointCy] = vchartRef.value?.convertToPixel?.("grid", [startItem.x,0,]) ?? [0, 0];// 根据两点真是坐标和起点0刻度线对应位置,计算两点连线,与0刻度线交汇点的真实坐标// 斜率const k = (pointBy - pointAy) / (pointBx - pointAx);// 截距const b = pointAy - k * pointAx;// 计算与0刻度线交汇点Pconst px = (pointCy - b) / k;const py = k * px + b;console.log("起点x,对应0刻度线位置", [px, py]);return [px, py];
};
// 寻找跨越0刻度线的相邻两个点
const findZeroCrossingPoints = (dataArr) => {console.log(dataArr);for (const index in dataArr) {const item = dataArr[index];const nextItem = dataArr[Number(index) + 1];if (item.value === 0) {return [{ x: item.year, y: item.value, index },{ x: item.year, y: item.value, index },];} else if (nextItem?.value === 0) {return [{ x: nextItem.year, y: nextItem.value, index },{ x: nextItem.year, y: nextItem.value, index },];} else if (item.value * nextItem?.value < 0) {return [{ x: item.year, y: item.value, index },{ x: nextItem.year, y: nextItem.value, index },];}}return [0, 0];
};watch(() => props.chartsData,(newValue) => {updateOption();},{ immediate: true }
);
</script>
<style lang="less" scoped>
.chart {height: 100%;
}
</style>