Excel处理控件Aspose.Cells教程:使用 C# 在 Excel 中创建组合图表

可视化项目时间线对于有效规划和跟踪至关重要。在本篇教程中,您将学习如何使用 C# 在 Excel 中创建组合图。只需几行代码,即可自动生成动态、美观的组合图。无论您是在构建项目管理工具还是处理内部报告,本指南都将向您展示如何将任务数据转换为清晰专业的时间线——完全可自定义,并可导出为 Excel、PDF 或图像格式。
Aspose.Cells 最新版下载
使用 C# Excel 库创建组合图表
Aspose.Cells for .NET是一个功能强大的 Excel 库,可简化在 Excel 中创建组合图的过程。它提供了强大的功能,可通过编程方式操作 Excel 文件。借助 Aspose.Cells,开发人员可以轻松创建、修改和自定义图表和图形。该库支持各种 Excel 格式并提供高级功能,是项目经理和开发人员的理想选择。
Aspose.Cells for .NET 因其易于集成和灵活性而脱颖而出。以下是一些主要功能:
- 全面的 API:访问各种 Excel 功能。
- 高级定制:定制图表和图形以满足特定需求。
- 高性能:高效处理大型数据集而不影响速度。
- 多种格式支持:使用各种 Excel 格式,包括 XLSX、XLS 和 CSV。
按照以下简单步骤开始使用 Aspose.Cells for .NET:
- 从发布版本中下载该库。
- 使用以下命令通过 NuGet 包管理器安装它:
PM> Install-Package Aspose.Cells
使用 C# 在 Excel 中创建组合图表
组合图表数据示例
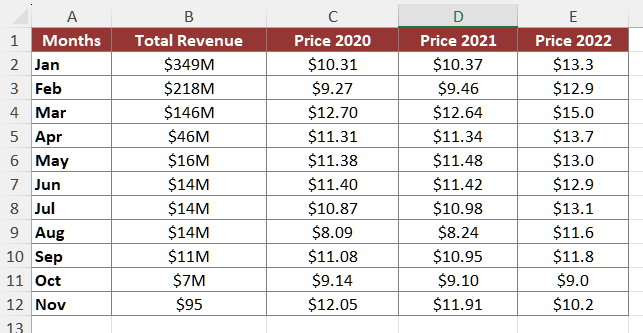
组合图表数据示例
如何创建组合图表
按照以下步骤使用 C# 和 Aspose.Cells for .NET 在 Excel 中创建组合图表:
- 使用该类加载现有的 Excel 文件Workbook。
- 使用 访问第一个工作表workbook.Worksheets[0]。
- 使用 添加图表ChartType.StockVolumeHighLowClose。
- 设置样式和Series设置。
- 使用 保存工作簿workbook.Save()。
以下是实现上述步骤的 C# 代码片段:
// Create the workbook
Workbook workbook = new Workbook("combo.xlsx");
// Access the first worksheet
Worksheet worksheet = workbook.Worksheets[0];
// Add a stock vloume(VHLC)
int pieIdx = worksheet.Charts.Add(ChartType.StockVolumeHighLowClose, 15, 0, 34, 12);
// Retrieve the Chart object
Chart chart = worksheet.Charts[pieIdx];
// Set the legend can be showed
chart.ShowLegend = true;
// Set the chart title name
chart.Title.Text = "Combo Chart";
// Set the Legend at the bottom of the chart area
chart.Legend.Position = LegendPositionType.Bottom;
// Set data range
chart.SetChartDataRange("A1:E12", true);
// Set category data
chart.NSeries.CategoryData = "A2:A12";
// Set the Series[1] Series[2] and Series[3] to different Marker Style
for (int j = 0; j < chart.NSeries.Count; j++)
{switch (j){case 1:chart.NSeries[j].Marker.MarkerStyle = ChartMarkerType.Circle;chart.NSeries[j].Marker.MarkerSize = 15;chart.NSeries[j].Marker.Area.Formatting = FormattingType.Custom;chart.NSeries[j].Marker.Area.ForegroundColor = Color.Pink;chart.NSeries[j].Border.IsVisible = false;break;case 2:chart.NSeries[j].Marker.MarkerStyle = ChartMarkerType.Dash;chart.NSeries[j].Marker.MarkerSize = 15;chart.NSeries[j].Marker.Area.Formatting = FormattingType.Custom;chart.NSeries[j].Marker.Area.ForegroundColor = Color.Orange;chart.NSeries[j].Border.IsVisible = false;break;case 3:chart.NSeries[j].Marker.MarkerStyle = ChartMarkerType.Square;chart.NSeries[j].Marker.MarkerSize = 15;chart.NSeries[j].Marker.Area.Formatting = FormattingType.Custom;chart.NSeries[j].Marker.Area.ForegroundColor = Color.LightBlue;chart.NSeries[j].Border.IsVisible = false;break;}
}
// Set the chart type for Series[0]
chart.NSeries[0].Type = ChartType.Line;
// Set style for the border of first series
chart.NSeries[0].Border.Style = LineType.Solid;
// Set Color for the first series
chart.NSeries[0].Border.Color =  Color.DarkBlue;
// Fill the PlotArea area with nothing
chart.PlotArea.Area.Formatting = FormattingType.None;
// Save the Excel file
workbook.Save("out.xlsx");
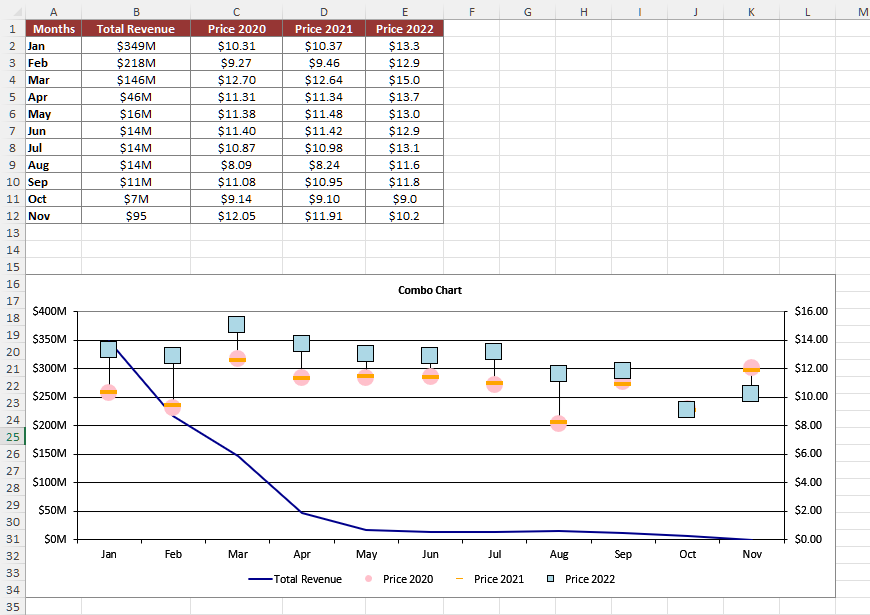
使用 C# 在 Excel 中创建组合图表
结论
在本篇博文中,我们探讨了如何使用 C# 在 Excel 中创建组合图。Aspose.Cells for .NET 凭借其强大的功能和灵活性简化了这一过程。