NLP学习路线图(五):常用库-NumPy, Pandas, Matplotlib
引言
在人工智能领域,自然语言处理(NLP) 已成为最受关注的技术方向之一。从智能客服到舆情分析,从机器翻译到情感识别,NLP技术正在深刻改变人机交互的方式。然而,要深入掌握NLP,除了理解算法原理,编程基础和数据处理能力更是不可或缺的基石。本文将聚焦Python生态中三大核心库——NumPy、Pandas和Matplotlib,通过实际案例演示它们如何支撑NLP项目的全流程开发。

第一部分:NumPy——高性能数值计算引擎
1.1 为什么需要NumPy?
在NLP任务中,文本数据最终需要转换为数值形式(如词向量)。传统Python列表的存储效率低,计算速度慢,而NumPy的多维数组(ndarray) 结构在内存使用和计算性能上具有绝对优势。
示例:创建词向量矩阵
import numpy as np# 模拟3个文档的词向量(维度=5)
doc_vectors = np.array([[0.2, 1.3, 0.5, 0.7, 2.1],  # 文档1[1.1, 0.6, 2.4, 0.9, 1.8],  # 文档2[0.8, 2.2, 1.7, 0.3, 0.5]   # 文档3
])print("矩阵形状:", doc_vectors.shape)  # 输出 (3,5)
1.2 关键操作详解
-
广播机制:不同形状数组间的运算
# 计算每个特征的Z-score标准化 mean = doc_vectors.mean(axis=0) std = doc_vectors.std(axis=0) normalized = (doc_vectors - mean) / std -
布尔索引:快速过滤数据
# 找出所有大于1.5的特征值 high_values = doc_vectors[doc_vectors > 1.5] -
矩阵运算:加速相似度计算
# 计算文档间余弦相似度
norms = np.linalg.norm(doc_vectors, axis=1)
similarity = np.dot(doc_vectors, doc_vectors.T) / np.outer(norms, norms)
第二部分:Pandas——结构化数据处理利器
2.1 DataFrame核心功能
处理文本数据集时,Pandas的DataFrame提供表格化操作支持,特别适合处理CSV/JSON等结构化数据。
示例:加载社交媒体数据
import pandas as pddf = pd.read_csv('tweets.csv', usecols=['text', 'sentiment', 'retweet_count'],parse_dates=['created_at'])print(df.info())2.2 文本预处理流水线
结合Pandas的向量化字符串操作,可高效完成清洗:
# 创建预处理管道
df['clean_text'] = (df['text'].str.lower()  # 转小写.str.replace(r'http\S+', '', regex=True)  # 去URL.str.replace(r'[^a-z\s]', '', regex=True)  # 去标点.str.strip())  # 去空格
2.3 高级数据处理技巧
-
分组统计:分析情感分布
sentiment_stats = df.groupby('sentiment').agg({'retweet_count': 'mean','text': 'count' }).rename(columns={'text': 'count'}) -
时间序列分析:舆情变化趋势
df.set_index('created_at').resample('D')['sentiment'].value_counts().unstack().plot()
第三部分:Matplotlib——数据可视化艺术
3.1 基础图表绘制
词频分布直方图
from collections import Counter
import matplotlib.pyplot as pltwords = ' '.join(df['clean_text']).split()
word_counts = Counter(words).most_common(20)plt.figure(figsize=(12,6))
plt.bar([w[0] for w in word_counts], [w[1] for w in word_counts)
plt.xticks(rotation=45)
plt.title('Top 20 Frequent Words')
plt.show()
3.2 高级可视化技巧
情感极性雷达图
categories = ['positive', 'neutral', 'negative']
values = [sentiment_stats.loc[c, 'count'] for c in categories]angles = np.linspace(0, 2*np.pi, len(categories), endpoint=False).tolist()
values += values[:1]
angles += angles[:1]fig = plt.figure(figsize=(6,6))
ax = fig.add_subplot(111, polar=True)
ax.plot(angles, values, linewidth=2)
ax.fill(angles, values, alpha=0.25)
ax.set_theta_offset(np.pi/2)
ax.set_theta_direction(-1)
ax.set_thetagrids(np.degrees(angles[:-1]), categories)
第四部分:NLP实战——从原始文本到可视化洞察
4.1 项目架构设计
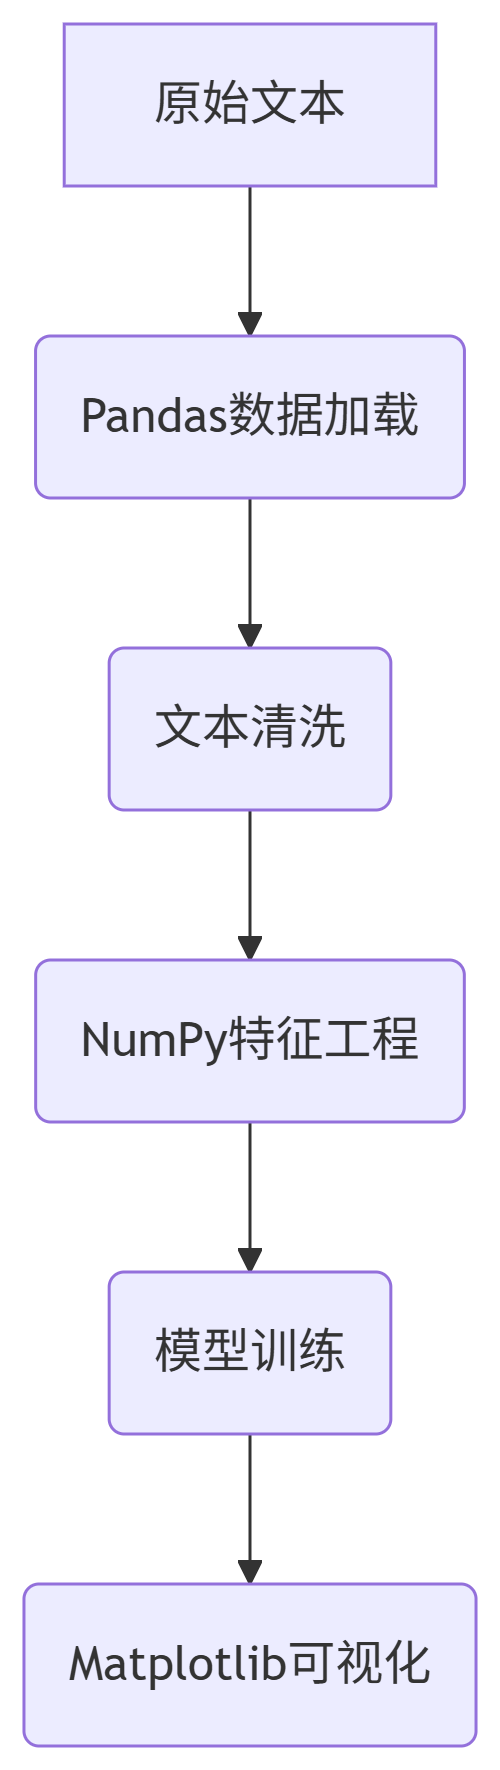
4.2 完整示例:新闻主题分析
-
数据加载:使用Pandas读取10,000条新闻数据集
-
特征提取:用NumPy计算TF-IDF权重矩阵
-
降维分析:通过PCA可视化文档分布
-
聚类可视化:Matplotlib绘制主题聚类散点图
from sklearn.feature_extraction.text import TfidfVectorizer
from sklearn.decomposition import PCA# 特征提取
vectorizer = TfidfVectorizer(max_features=1000)
tfidf_matrix = vectorizer.fit_transform(df['clean_text']).toarray()# 降维可视化
pca = PCA(n_components=2)
points = pca.fit_transform(tfidf_matrix)plt.scatter(points[:,0], points[:,1], alpha=0.6)
plt.title('Document Cluster Visualization')
plt.xlabel('PC1')
plt.ylabel('PC2')
结语
掌握NumPy、Pandas和Matplotlib的深度应用,就如同获得了打开NLP大门的钥匙。这些工具不仅能提升数据处理效率,更能帮助开发者直观理解文本数据的深层规律。建议读者在实践过程中:
-
多尝试将复杂操作向量化
-
善用Pandas的管道(pipe)方法组织代码
-
探索Seaborn等基于Matplotlib的高级可视化库