利用散点图探索宇航员特征与太空任务之间的关系
利用散点图探索宇航员特征与太空任务之间的关系
import matplotlib.pyplot as plt
import numpy as np
import pandas as pdfrom flexitext import flexitext
from matplotlib.patches import FancyArrowPatchplt.rcParams.update({"font.family": "Corbel", "font.weight": "light"})
plt.rcParams["text.color"] = "white"
plt.rcParams["axes.labelcolor"] = "white"
plt.rcParams["xtick.labelcolor"] = "white"
plt.rcParams["ytick.labelcolor"] = "white"
数据探索
以下数据如果有需要的同学可关注公众号HsuHeinrich,回复【数据可视化】自动获取~
data = pd.read_csv("https://raw.githubusercontent.com/rfordatascience/tidytuesday/master/data/2020/2020-07-14/astronauts.csv")# 数据展示
data.head()
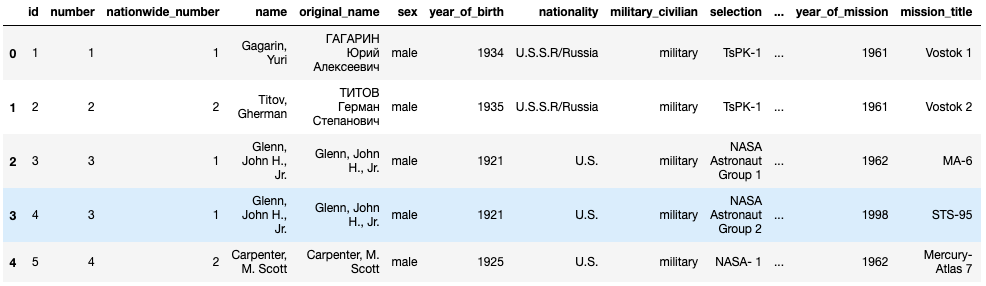
宇航员数据集主要特征:
sex:性别
year_of_birth:出生年份
year_of_mission:执行任务年份
hours_mission :执行任务时长(小时)
total_number_of_missions:累计执行任务次数
# 计算宇航员执行任务时的年龄
data["age_at_mission"] = data["year_of_mission"] - data["year_of_birth"]
绘制基础散点图
# 设置基本信息# 基本变量
year_of_mission = data["year_of_mission"].values # 执行任务年份
age_at_mission = data["age_at_mission"].values # 执行任务时年龄
sex = data["sex"].values # 性别
hours_mission = data["hours_mission"].values # 执行任务时长(小时)
total_number_of_missions = data["total_number_of_missions"].values # 执行任务次数# 颜色
DARKBLUE = "#1d1330"
ORANGE = "#ffa72b"
LIGHTBLUE = "#e1f7fa"# 自定义函数 数字缩放
def scale(x, lower=0, upper=1):return ((x - np.min(x)) / (np.max(x) - np.min(x))) * (upper - lower)  + loweralpha = scale(total_number_of_missions, 0.1, 1) # 透明度,与执行任务次数关联
sizes = scale(hours_mission, 10, 200) # 点大小,与执行任务时长关联
colors = np.where(sex == "male", LIGHTBLUE, ORANGE) # 颜色,与性别关联
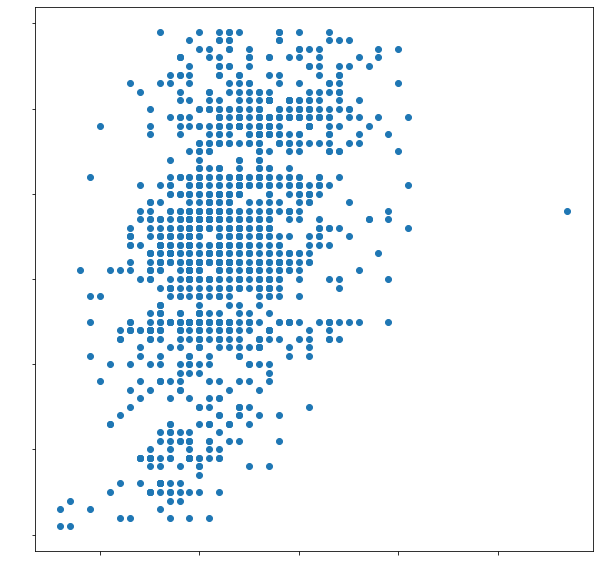
# 绘制基本散点图
fig, ax = plt.subplots(figsize=(10, 10))ax.scatter(age_at_mission, year_of_mission);
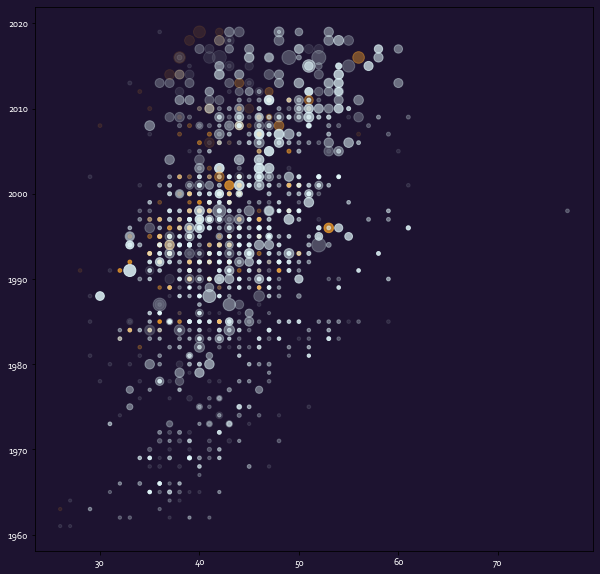
# 利用点的大小、透明度、颜色以及背景信息美化
fig, ax = plt.subplots(figsize=(10, 10))fig.set_facecolor(DARKBLUE)
ax.set_facecolor(DARKBLUE)ax.scatter(age_at_mission, year_of_mission, c=colors, s=sizes, alpha=alpha);
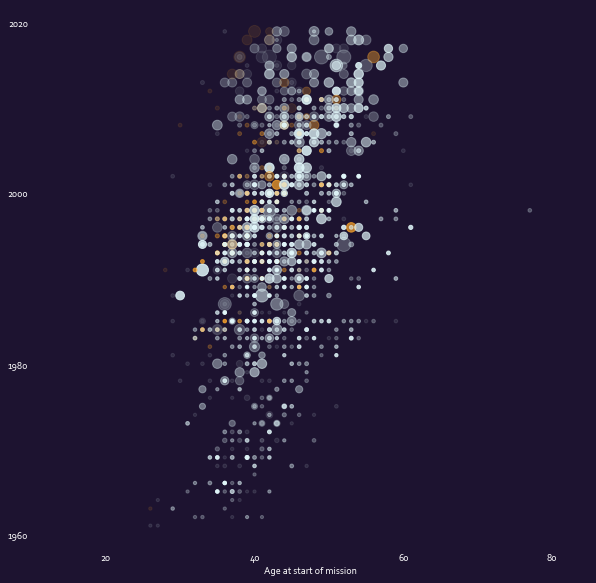
自定义布局
# 移除边框
ax.set_frame_on(False)# x轴自定义
ax.set_xlim(10, 85)
ax.set_xticks([20, 40, 60, 80])
ax.set_xticklabels([20, 40, 60, 80], fontsize=10)
ax.set_xlabel("Age at start of mission", size=10, weight="light")# y轴自定义
ax.set_yticks([1960, 1980, 2000, 2020])
ax.set_yticklabels([1960, 1980, 2000, 2020], fontsize=10)# 删除刻度线
ax.tick_params(length=0)fig
为图表增加更丰富的信息
- 标题
# 调整四周边距
fig.subplots_adjust(top=0.7, bottom=0.08, left=0.06, right=0.94)# 标题
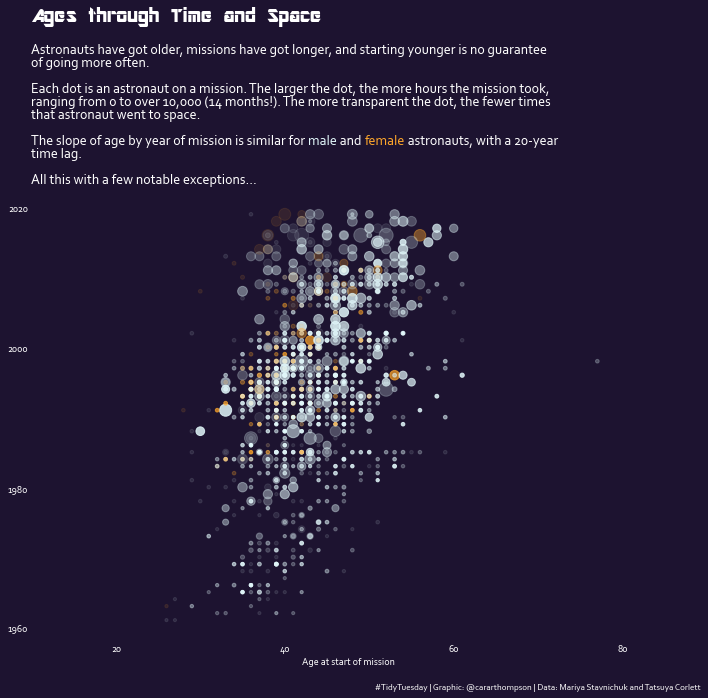
fig.text(0.06, 0.94, "Ages through Time and Space", fontsize=20, fontname="AR DESTINE", va="baseline"
)# 子标题
subtitle = """<size:14><weight:normal>Astronauts have got older, missions have got longer, and starting younger is no guarantee
of going more often.</> Each dot is an astronaut on a mission. The larger the dot, the more hours the mission took,
ranging from 0 to over 10,000 (14 months!). The more transparent the dot, the fewer times
that astronaut went to space. The slope of age by year of mission is similar for <color:#e1f7fa>male</> and <color:#ffa72b>female</> astronauts, with a 20-year
time lag. All this with a few notable exceptions...</>
"""
flexitext(0.06, 0.91, subtitle, va="top", xycoords="figure fraction", ax=ax)# 添加著作信息
caption = "#TidyTuesday | Graphic: @cararthompson | Data: Mariya Stavnichuk and Tatsuya Corlett"
fig.text(0.99, 0.01, caption, ha="right", va="bottom", size=9)fig
- 添加注释
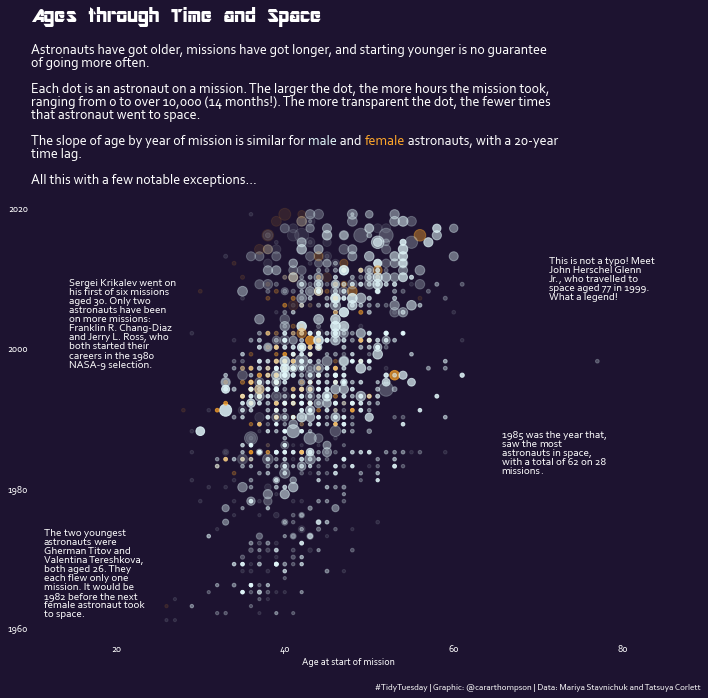
text = """<weight:light, size:11>This is not a typo! Meet
<weight:normal>John Herschel Glenn\nJr.</>, who travelled to
space aged 77 in 1999. \nWhat a legend!</>
"""
flexitext(0.9, 0.8, text, ha="center", va="center", ax=ax)text = """<weight:light, size:11>1985 was the year that,
saw the <weight:normal>most
astronauts in space</>,
with a total of 62 on 28
missions</>.
"""
flexitext(0.825, 0.41, text, ha="center", va="center", ax=ax)text = """<weight:light, size:11>
The <weight:normal>two youngest
astronauts</> were
Gherman Titov and
Valentina Tereshkova,
both aged 26. They
each flew only one
mission. It would be
1982 before the next
female astronaut took
to space.
</>
"""
flexitext(0.02, 0.14, text, va="center", ax=ax)text = """<weight:light, size:11><weight:normal>Sergei Krikalev</> went on
his first of six missions
aged 30. Only two
astronauts have been
on more missions:
Franklin R. Chang-Diaz
and Jerry L. Ross, who
both started their
careers in the 1980
NASA-9 selection.</>
"""
flexitext(0.06, 0.7, text, ax=ax)fig
- 添加箭头
# 箭头样式
style = "Simple, tail_width=0.5, head_width=4, head_length=4"# 直箭头1
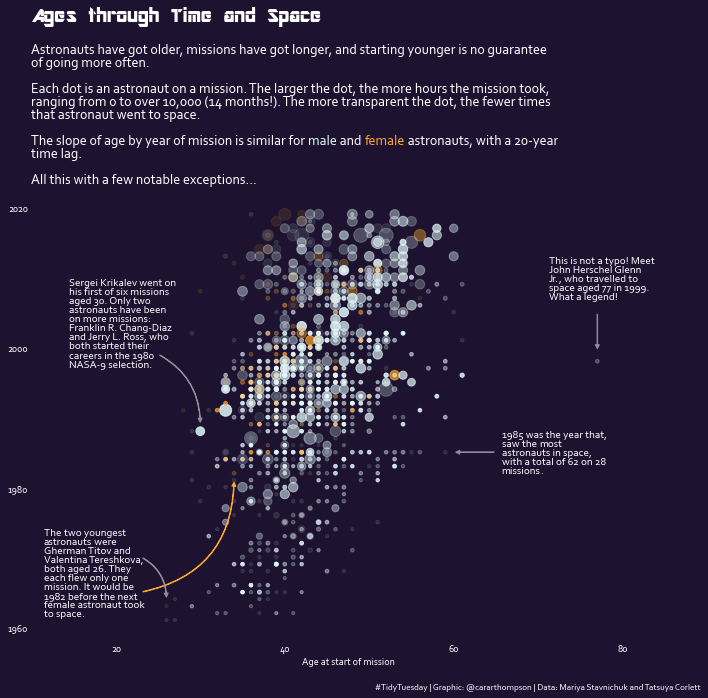
arrow = FancyArrowPatch((77, 2005), (77, 1999.5),color = "#938ca1",arrowstyle = style
)
ax.add_patch(arrow)# 直箭头2
arrow = FancyArrowPatch((65, 1985), (60, 1985),color = "#938ca1",arrowstyle = style
)
ax.add_patch(arrow)# 弯曲箭头1
arrow = FancyArrowPatch((23, 1965), (34, 1981),color = "#ffa72b",arrowstyle = style,connectionstyle="arc3, rad=0.4", # rad弯曲程度
)
ax.add_patch(arrow)# 弯曲箭头1
arrow = FancyArrowPatch((23, 1970), (26, 1964),color = "#938ca1",arrowstyle = style,connectionstyle="arc3, rad=-0.3",
)
ax.add_patch(arrow)# 弯曲箭头3
arrow = FancyArrowPatch((25, 1999), (30, 1989),color = "#938ca1",arrowstyle = style,connectionstyle="arc3, rad=-0.3",
)
ax.add_patch(arrow)fig
参考:Custom scatterplot with annotations in Matplotlib
共勉~