[监控看板]Grafana+Prometheus+Exporter监控疑难排查
采用Grafana+Prometheus+Exporter监控MySQL时发现经常数据不即时同步,本示例也是本地搭建采用。
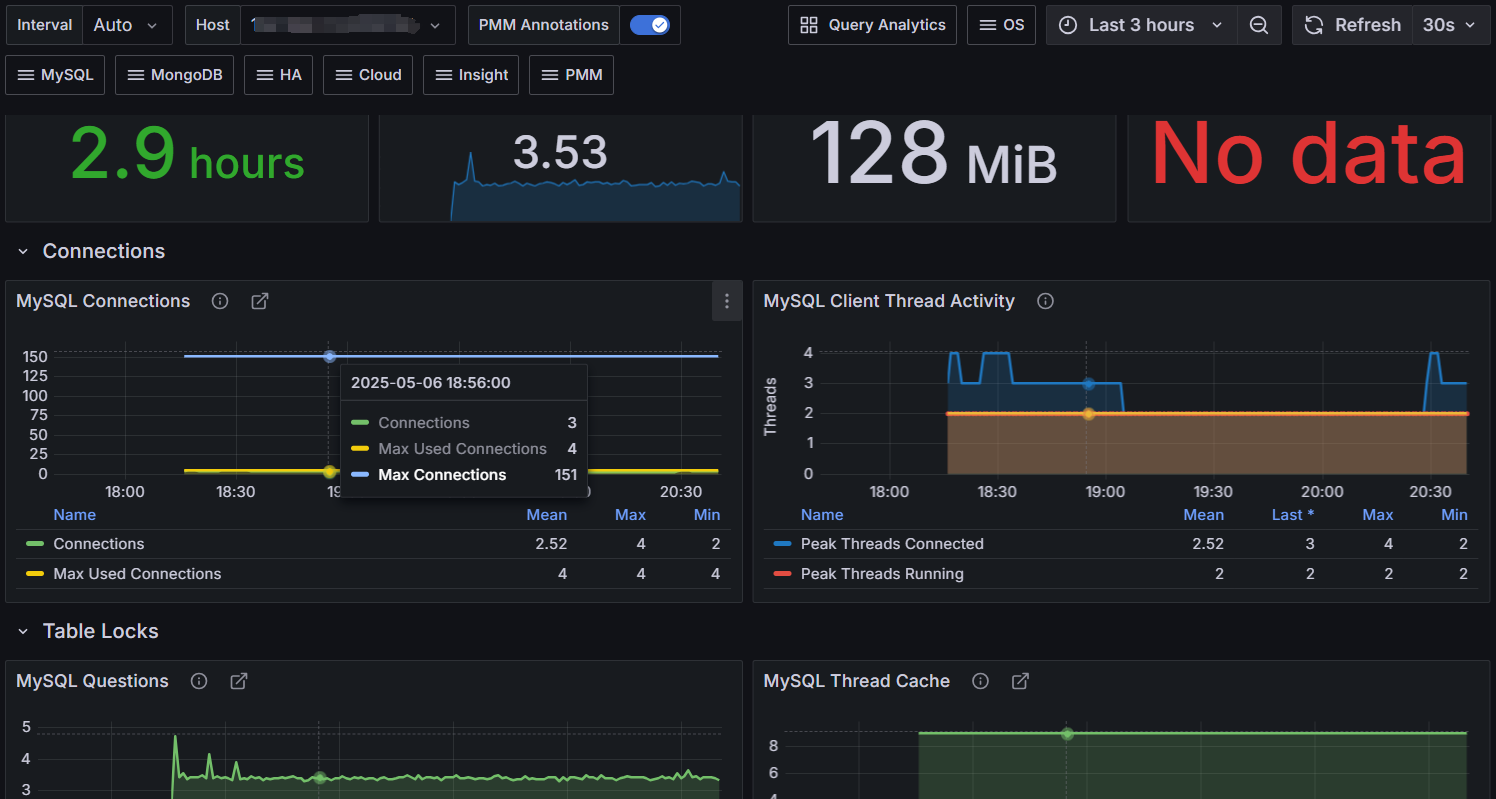
Prometheus面板
1,Detected a time difference of 11h 47m 22.337s between your browser and the server. You may see unexpected time-shifted query results due to the time drift.
当前Prometheus机器的时间和本地时间不一致导致,解决方案
timedatectl status
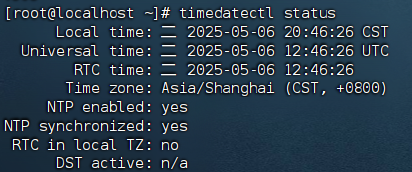
Docker容器中的时间:
![]()
不对的话,可以从本地拷贝到容器
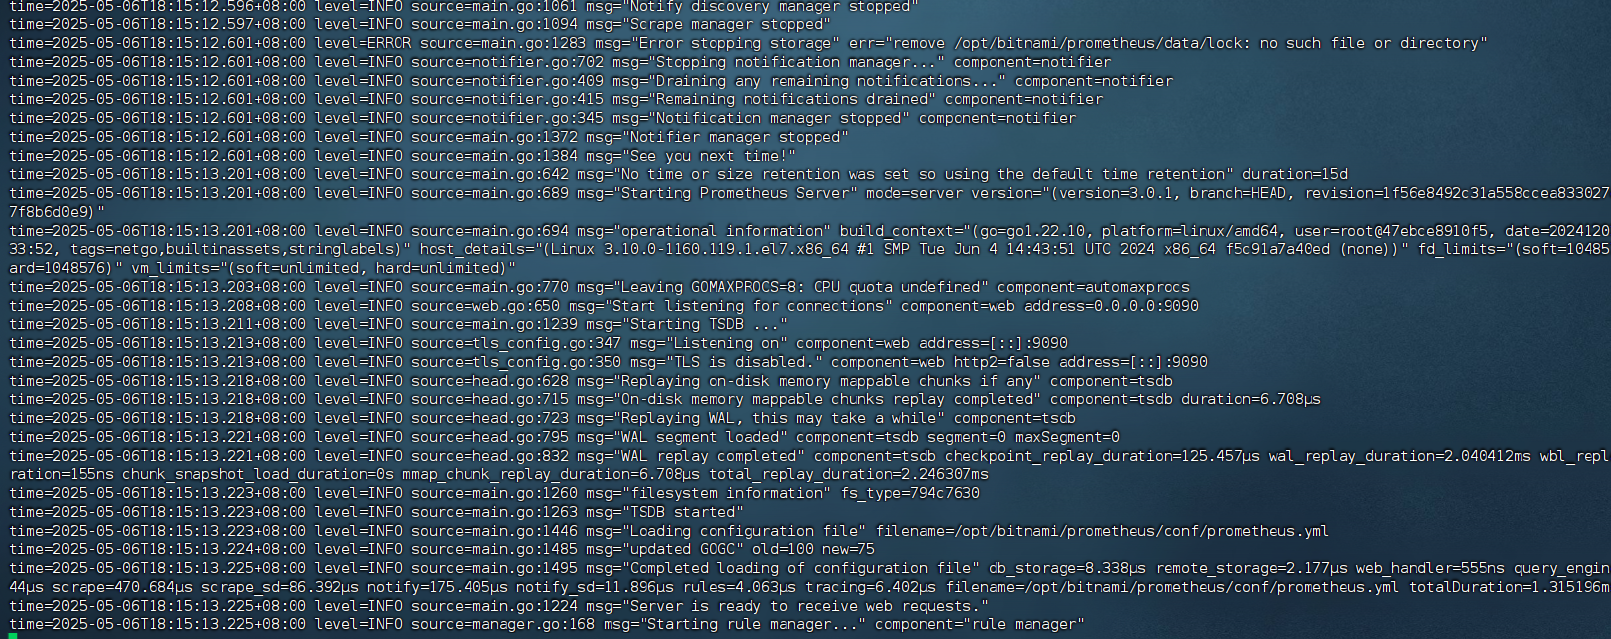
docker cp /usr/share/zoneinfo/Asia/Shanghai prometheus:/etc/localtime2,查看prometheus运行日志
docker logs -f prometheus
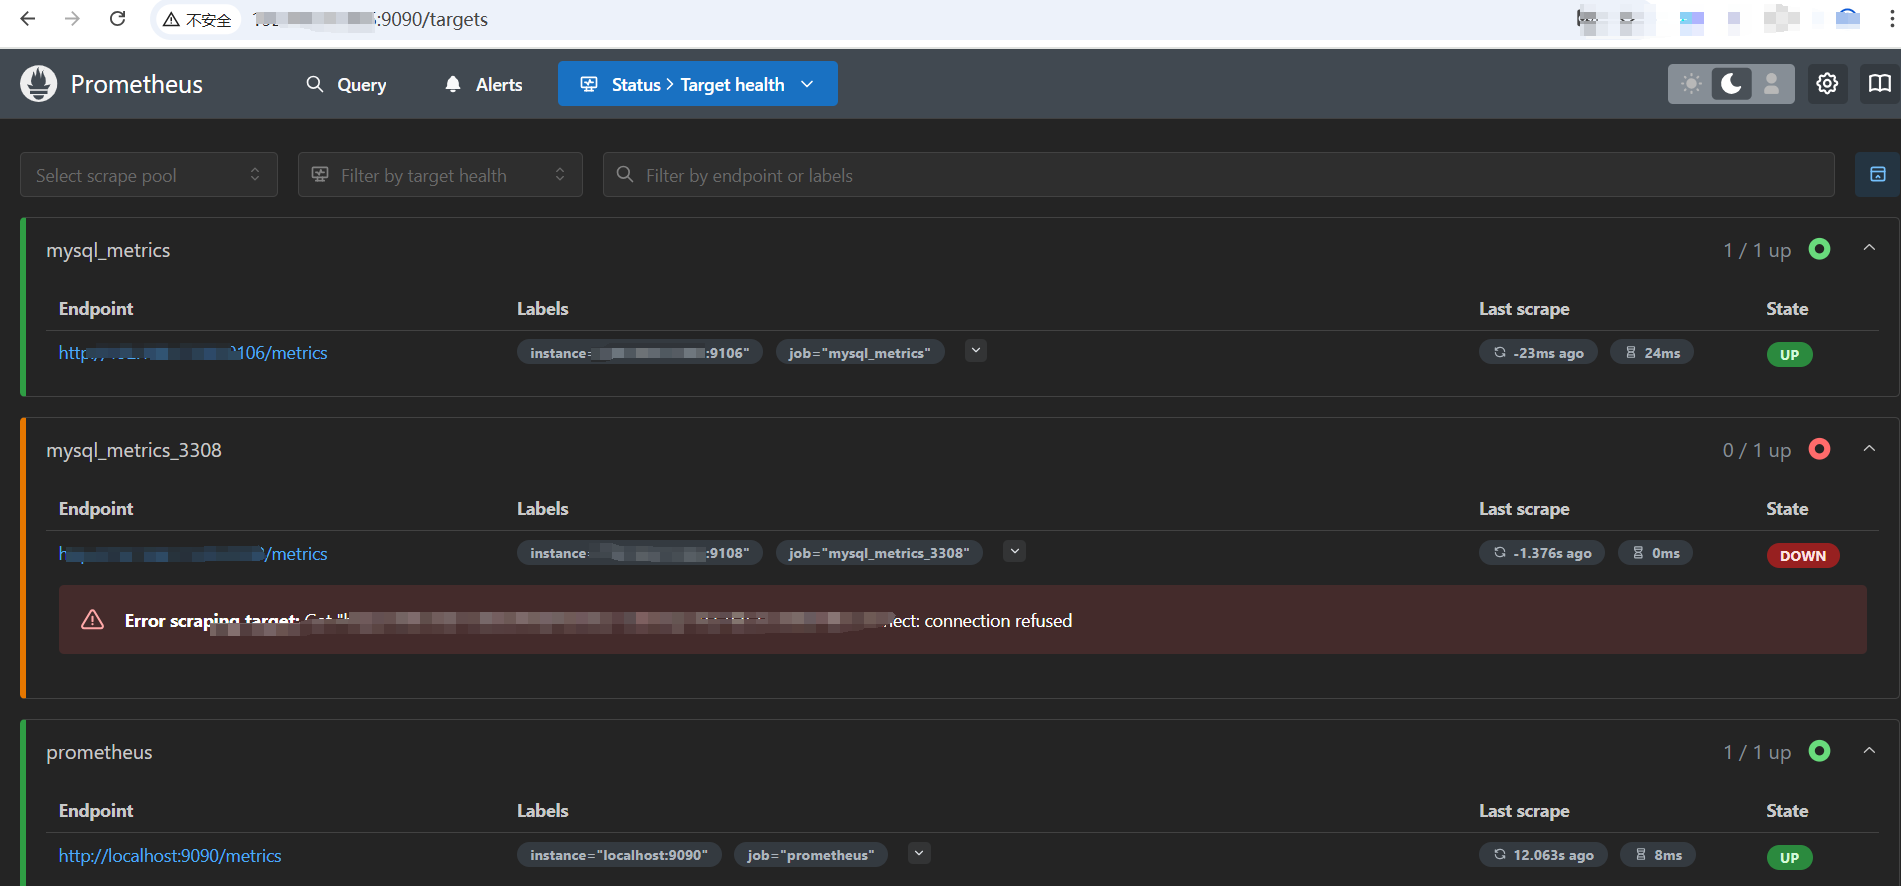
3,检测目标targets检查
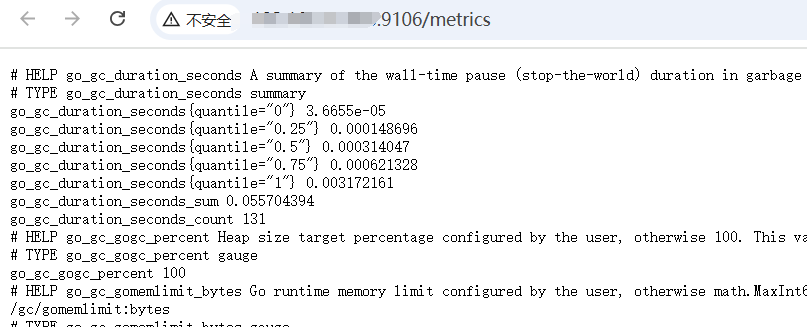
4,检查Exporter收集信息
通过上一步的targets可以查看进入终端收集信息
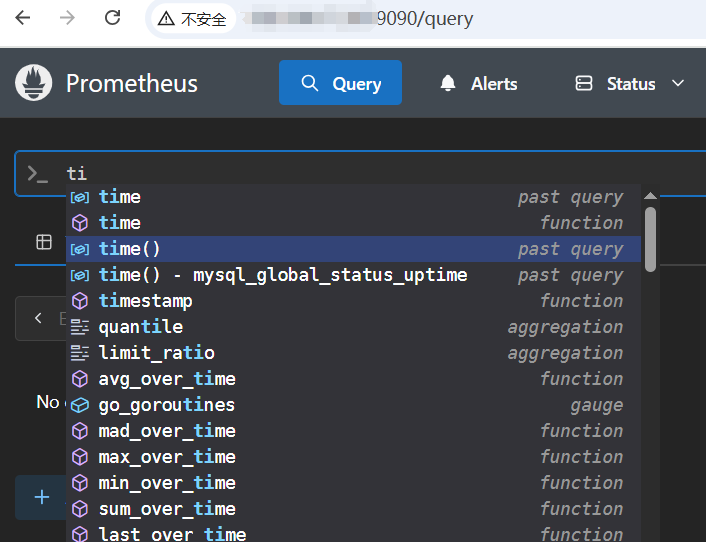
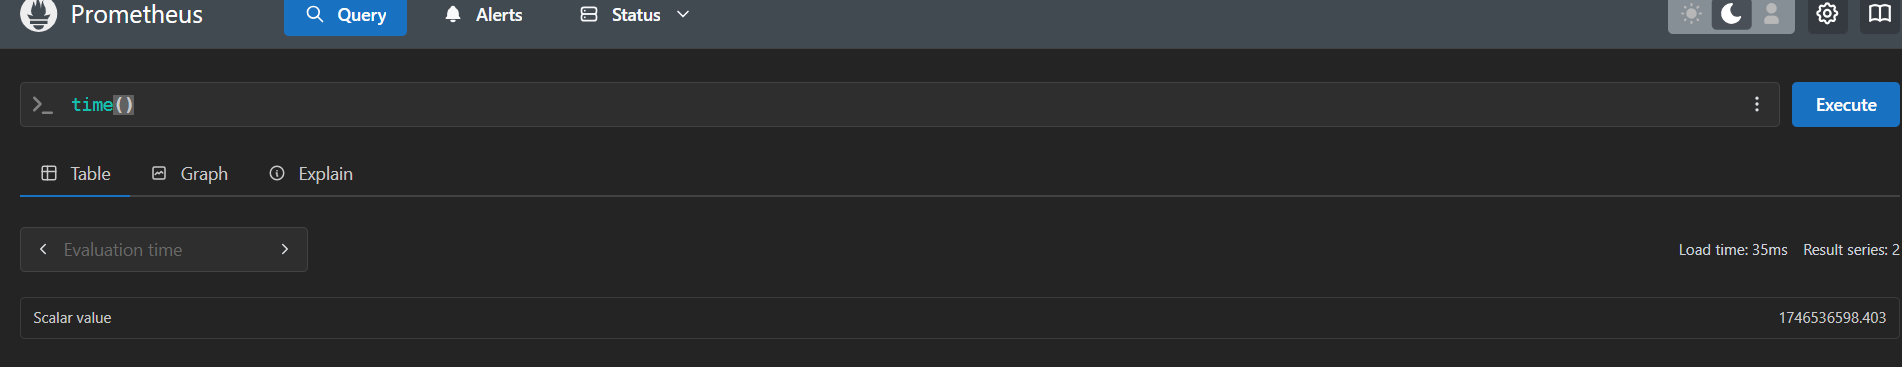
5, Prometheus query可以看到数据