CS5346 - Improving and Evaluating Effectiveness of Visualizations(提高和评估可视化的效果)
文章目录
- 回顾 L10 中关于 annotation 的作用
- Information Visualization Evaluation(信息可视化评估)
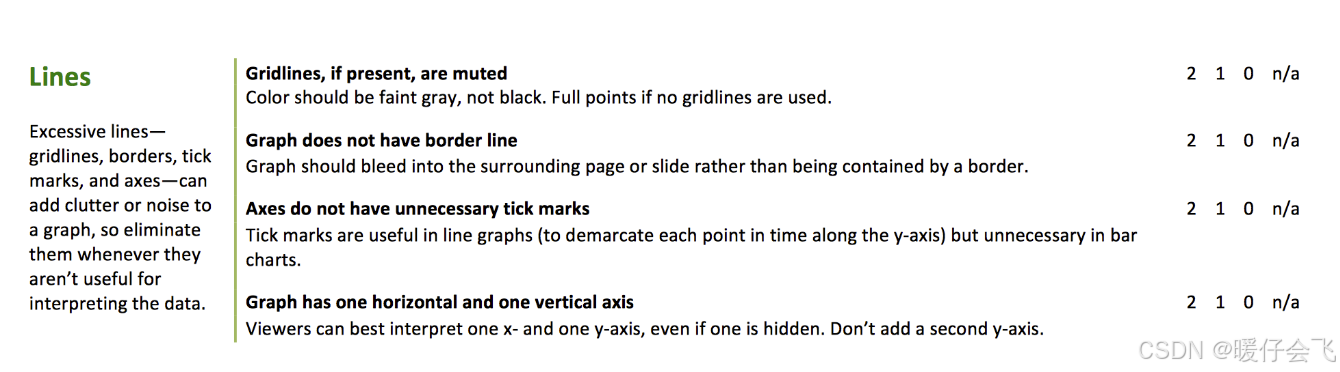
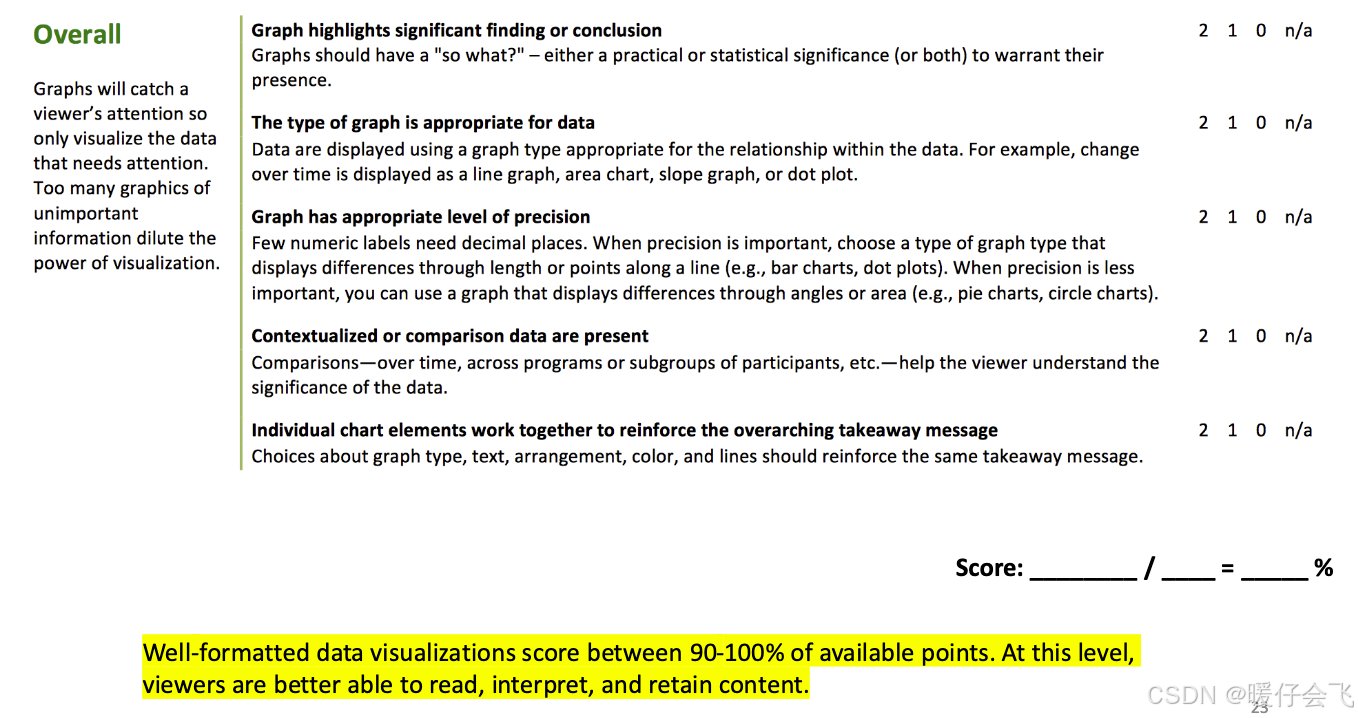
- Evaluation Criteria(评估标准)
- Evaluation Scale(评估量表示例)
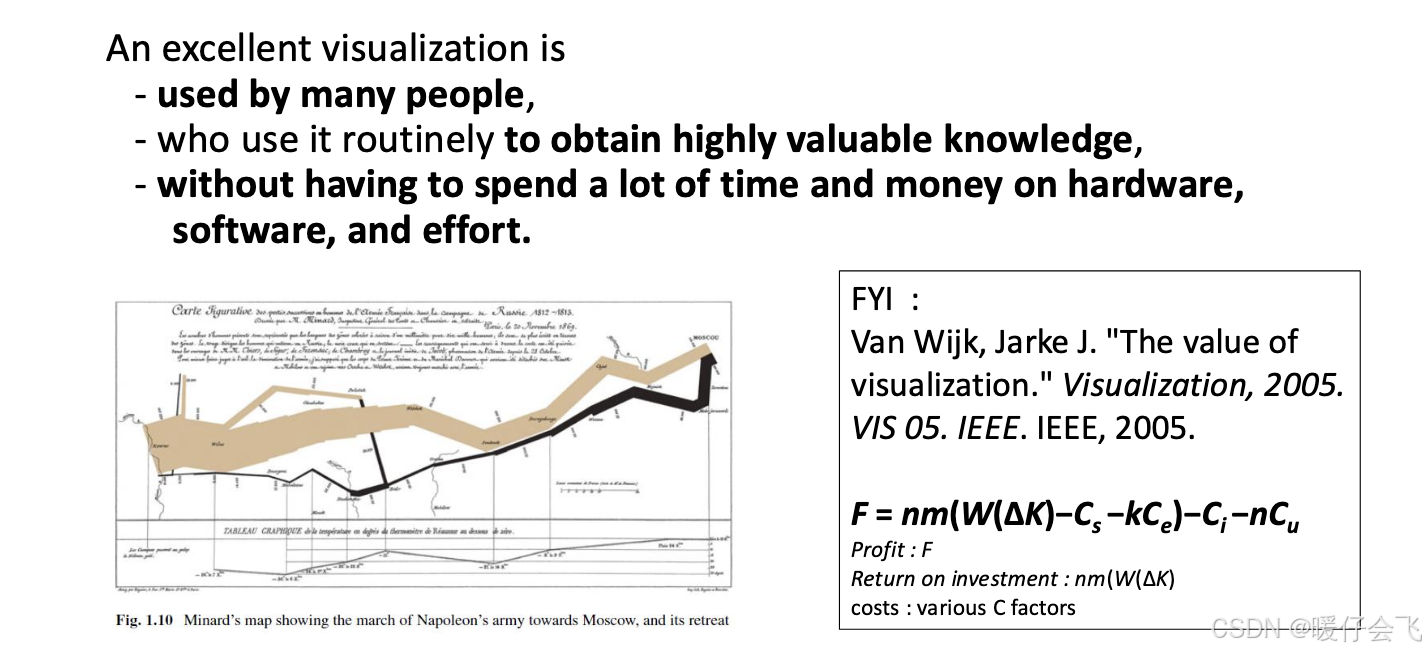
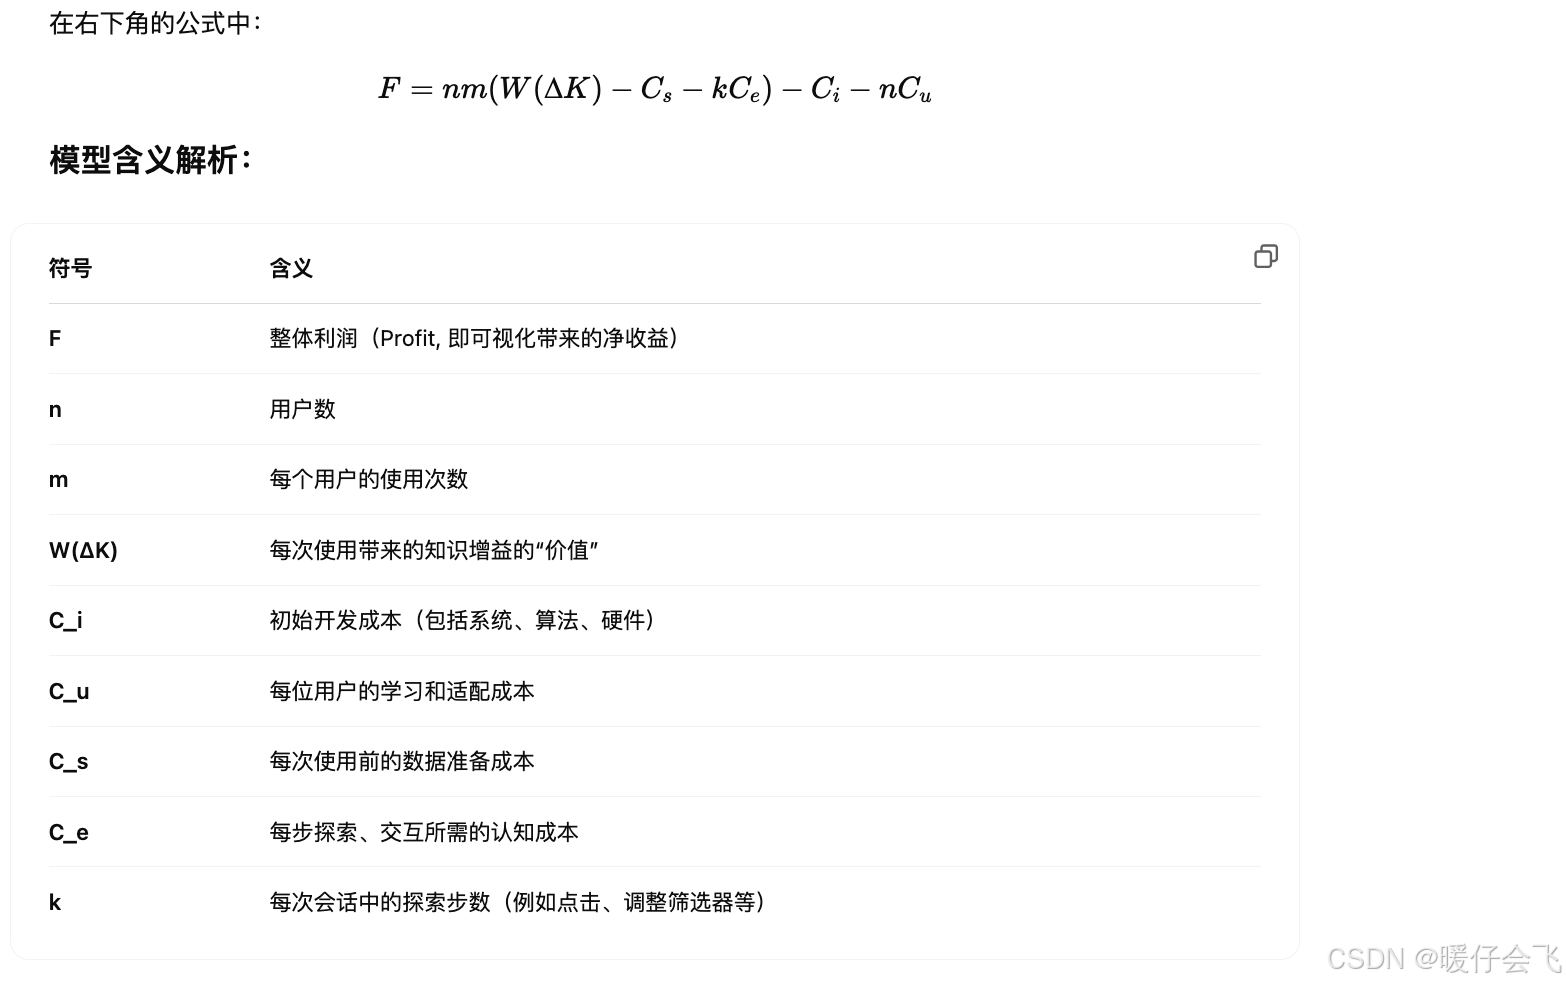
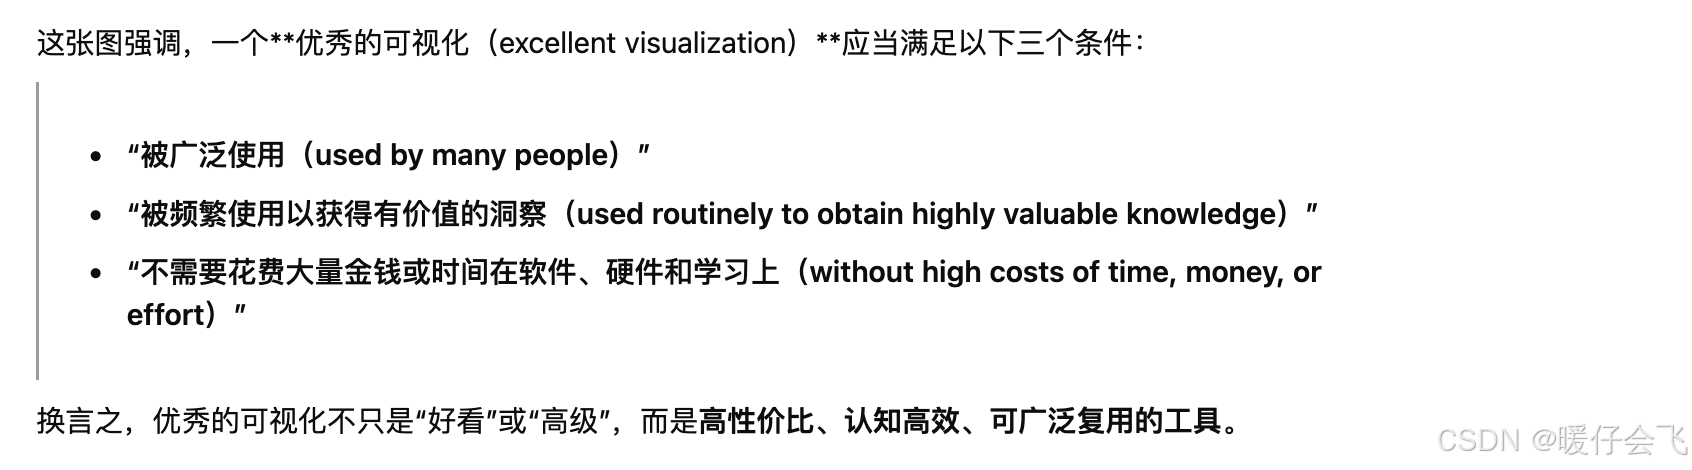
- The Value of Visualization(可视化的价值)
- Issues implied by the model of Visualization(通过可视化模型暗示的问题)
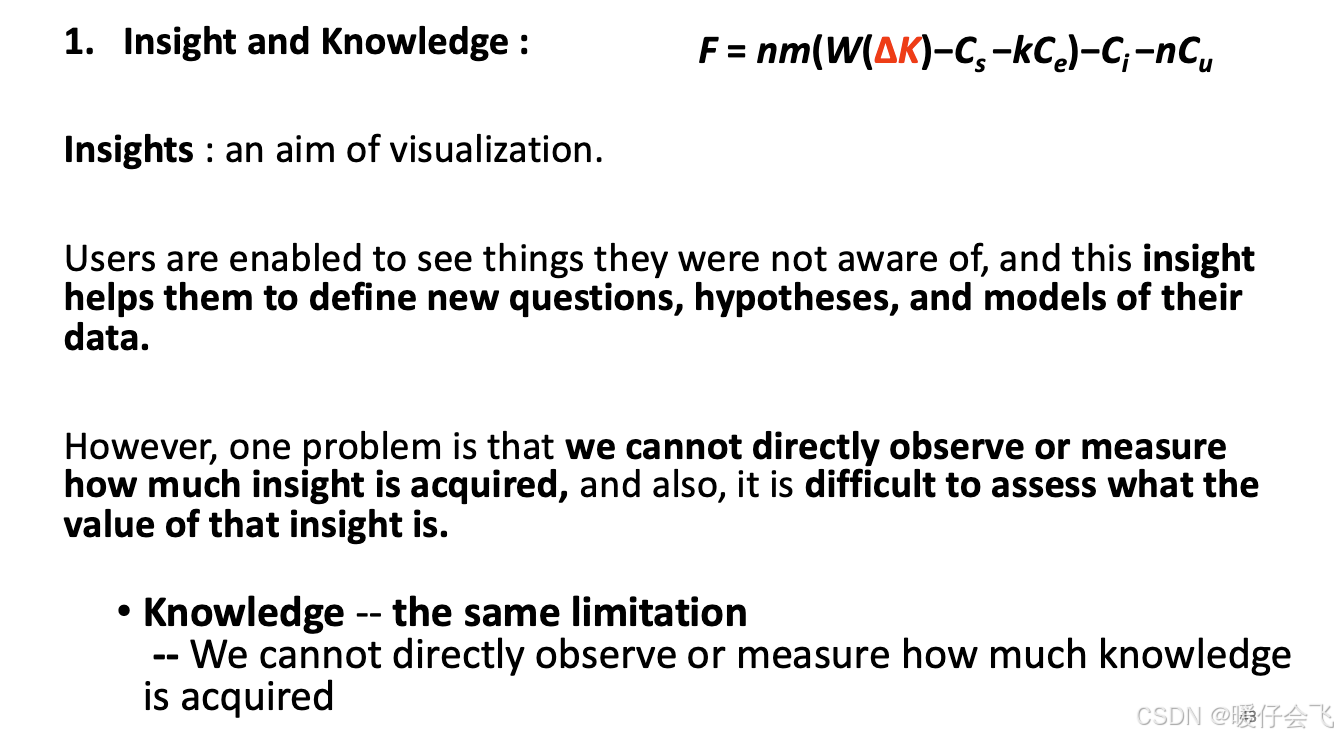
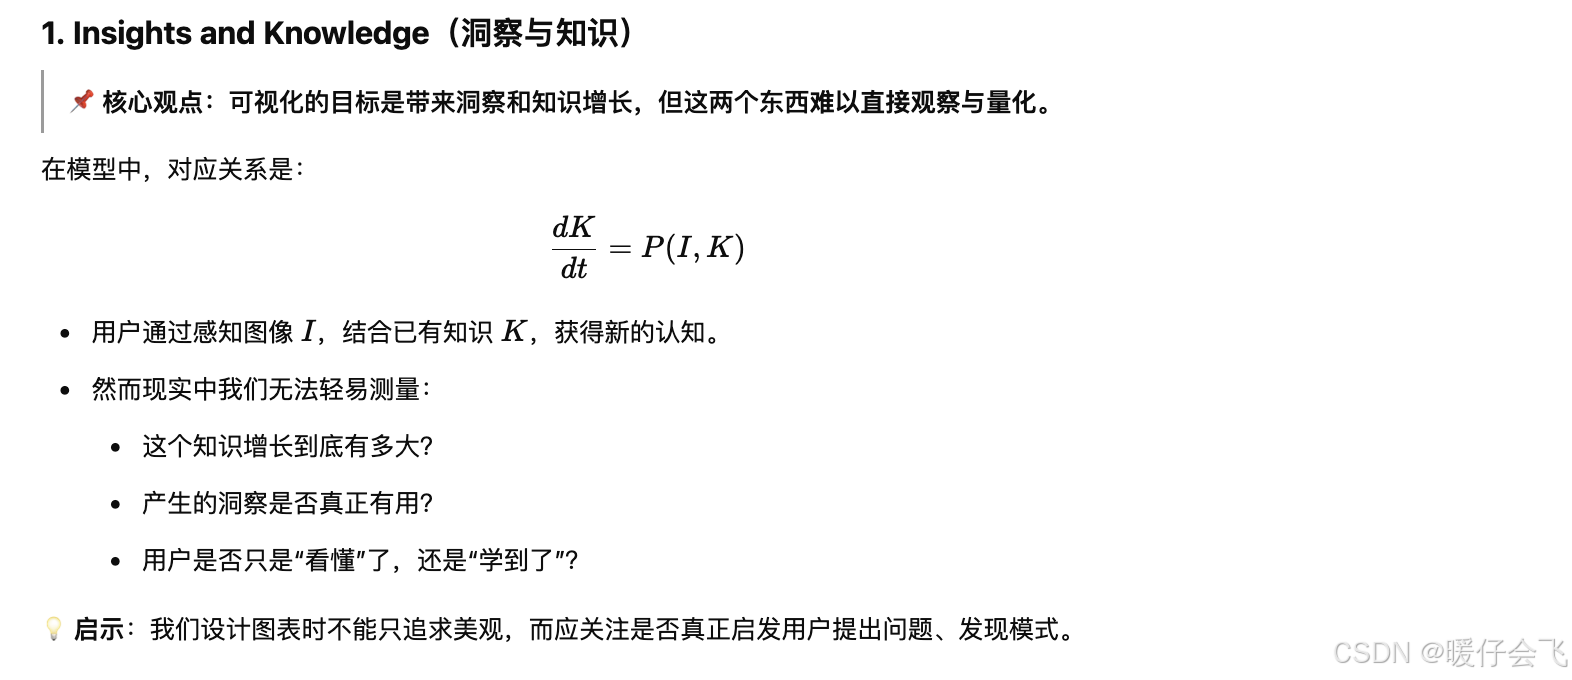
- Insights and Knowledge(洞察与知识)
- Visualization is subjective(可视化是主观的)
- Negative Knowledge(负向知识)
- Interaction(交互)
回顾 L10 中关于 annotation 的作用
- 可以参考之前的总结

- Title : to inform viewers efficiently about the content they are about to see and to orientate themselves within the hierarchy of its content
- Introduction: explain what the project or chart is about than a title can
- Labels: 1) axis titles, 2) axis labels and 3) value labels
- Axis titles describe what values are being referenced by each axis.
- Axis labels provide value references along each axis to help identify the categorical value or the date/quantitative value associated with that scale position.
- Value labels appear in proximity to specific mark encodings inside the chart.
- Legend: legend is an annotated feature within or alongside your chart that presents one or several keys to help viewers understand the categorical or quantitative meaning of different attributes
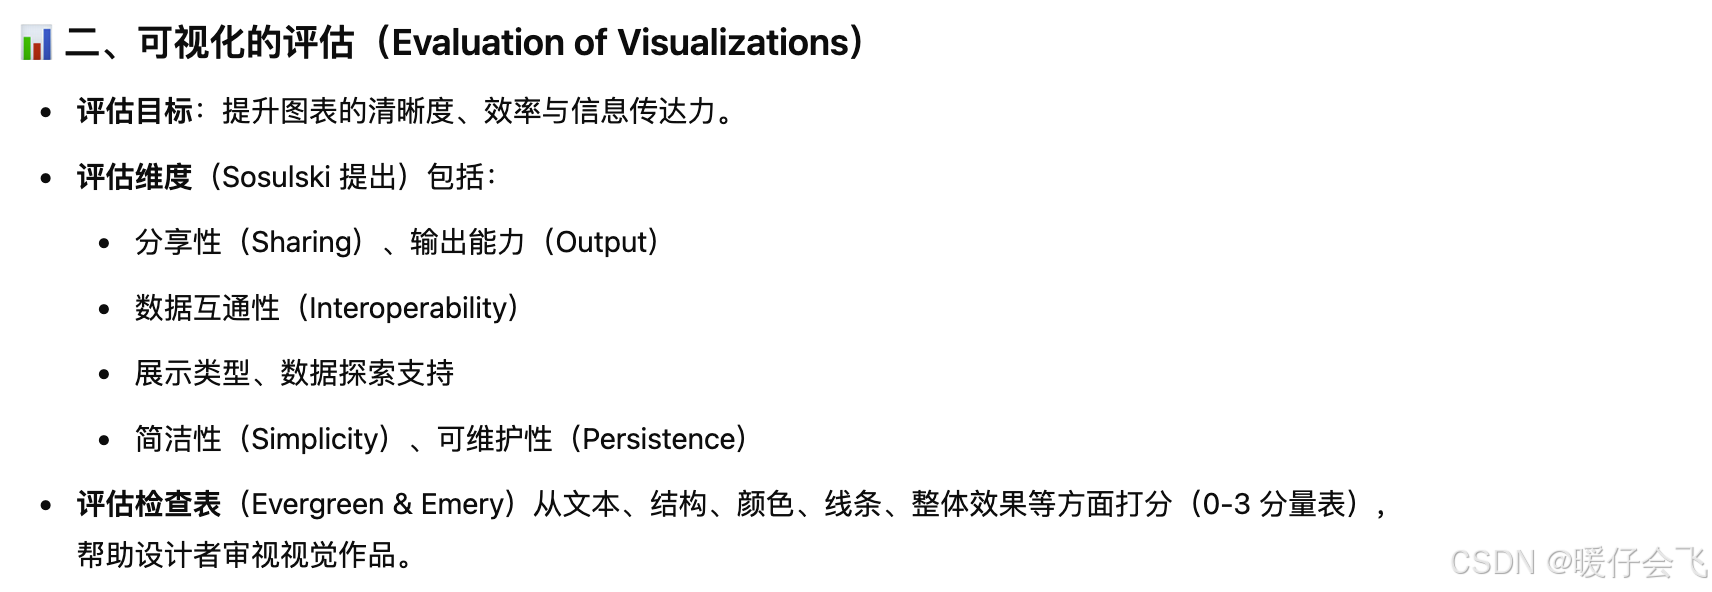
Information Visualization Evaluation(信息可视化评估)
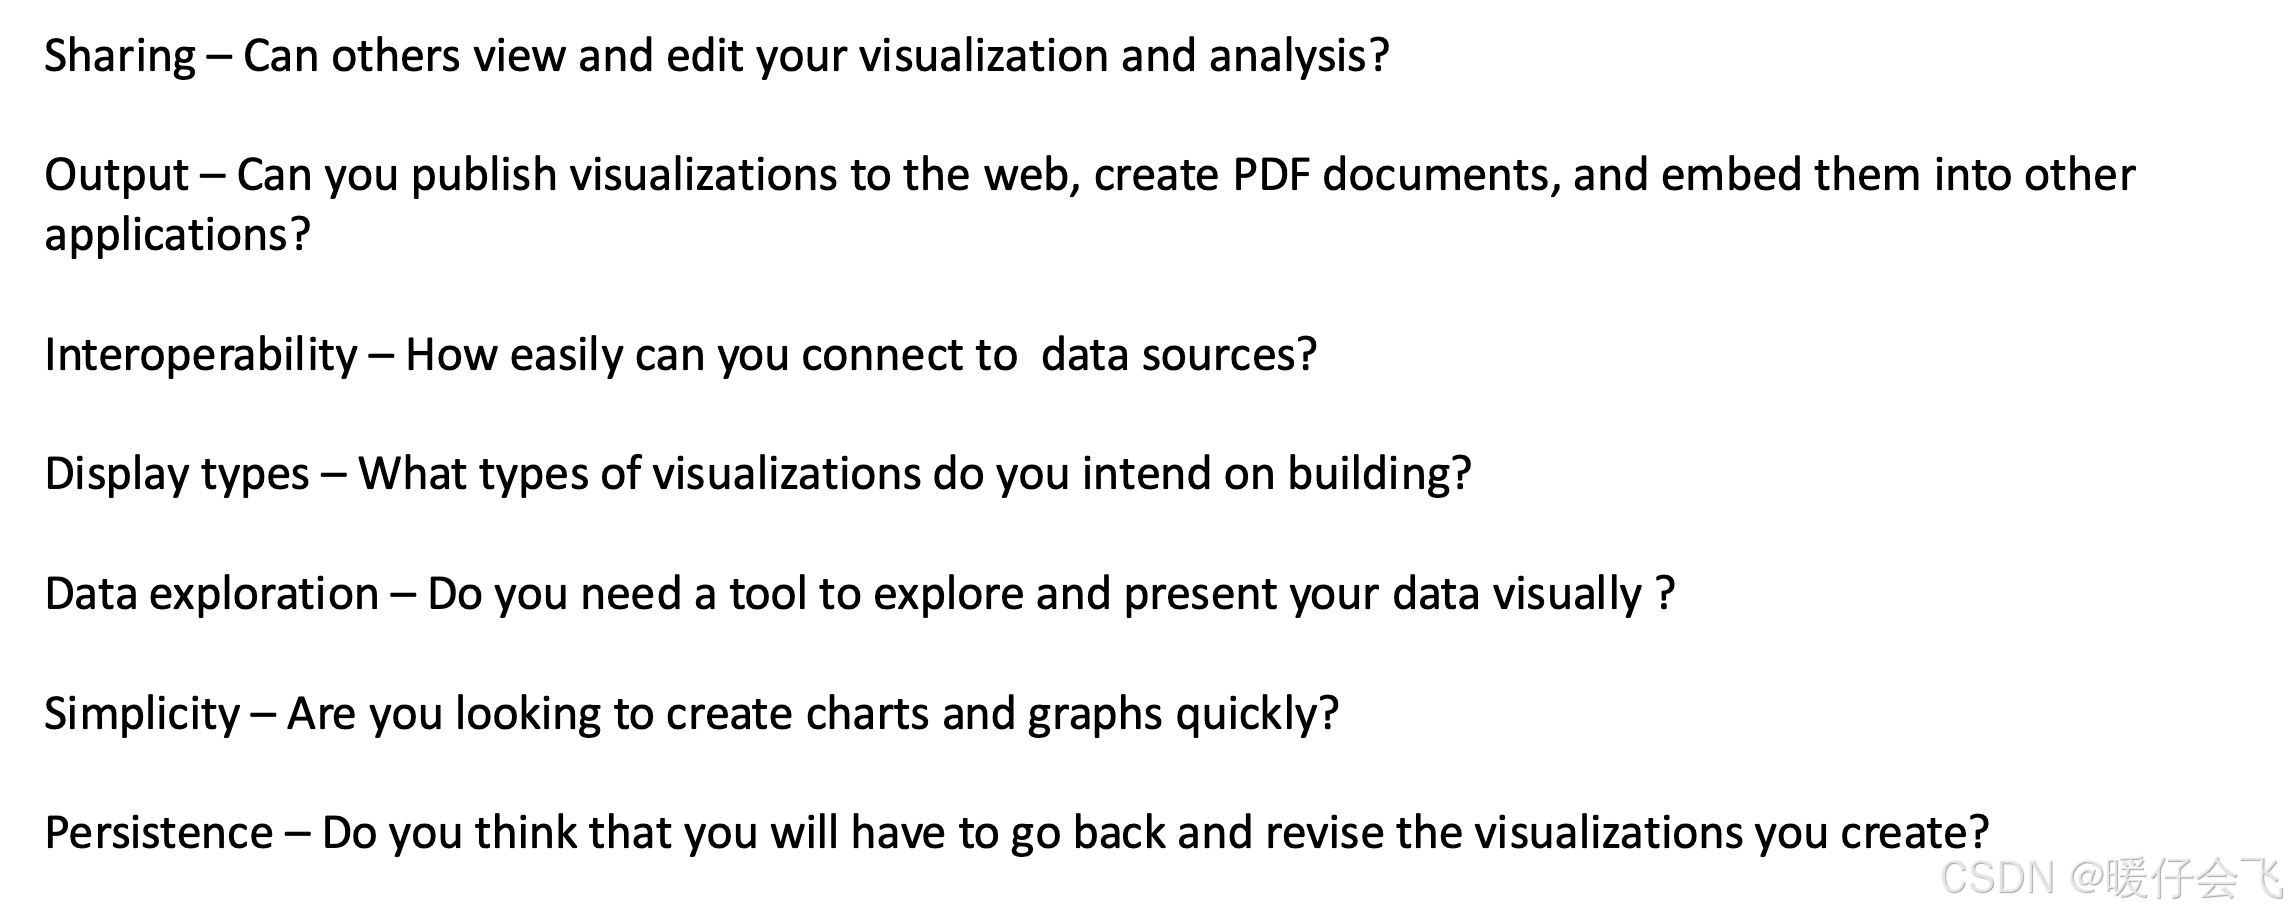
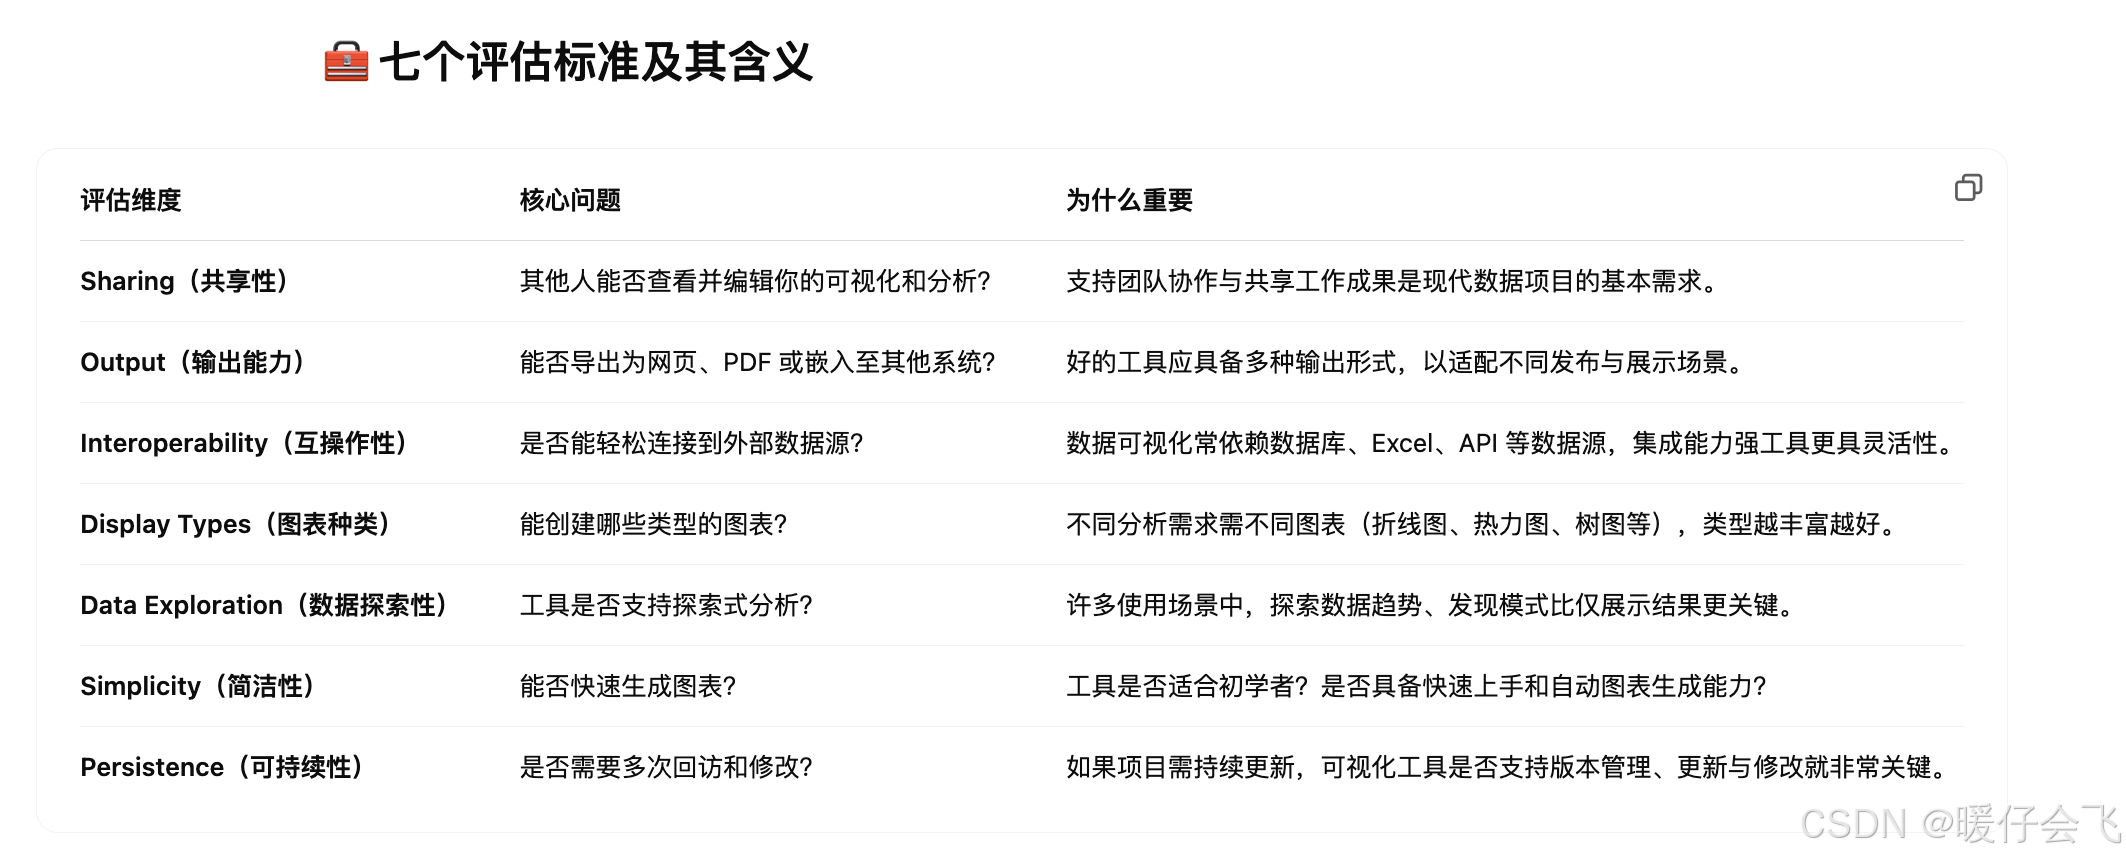
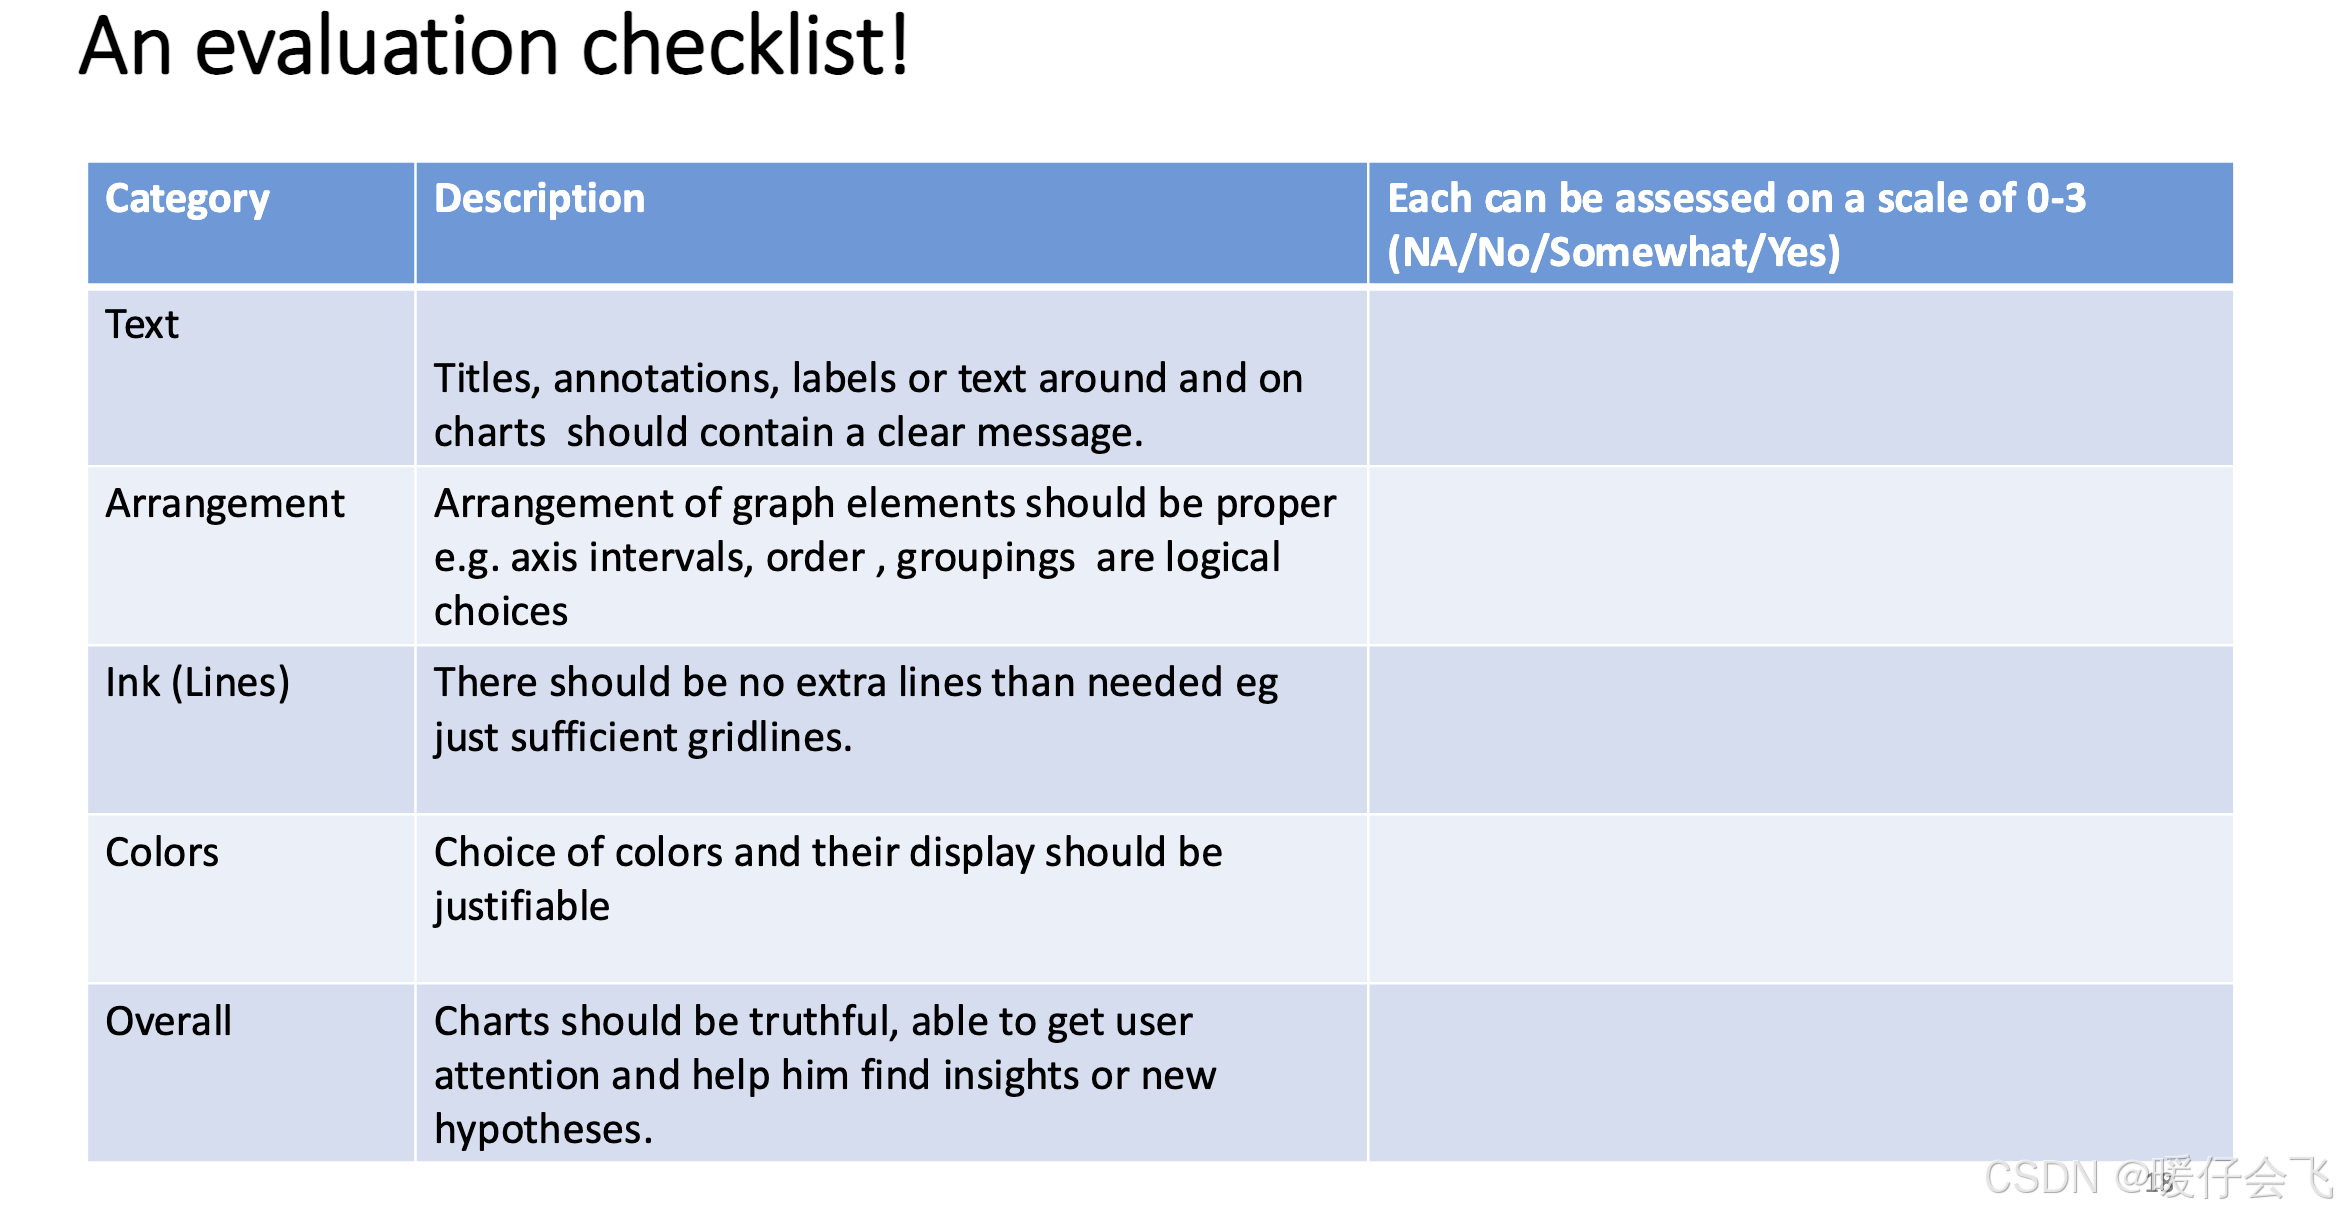
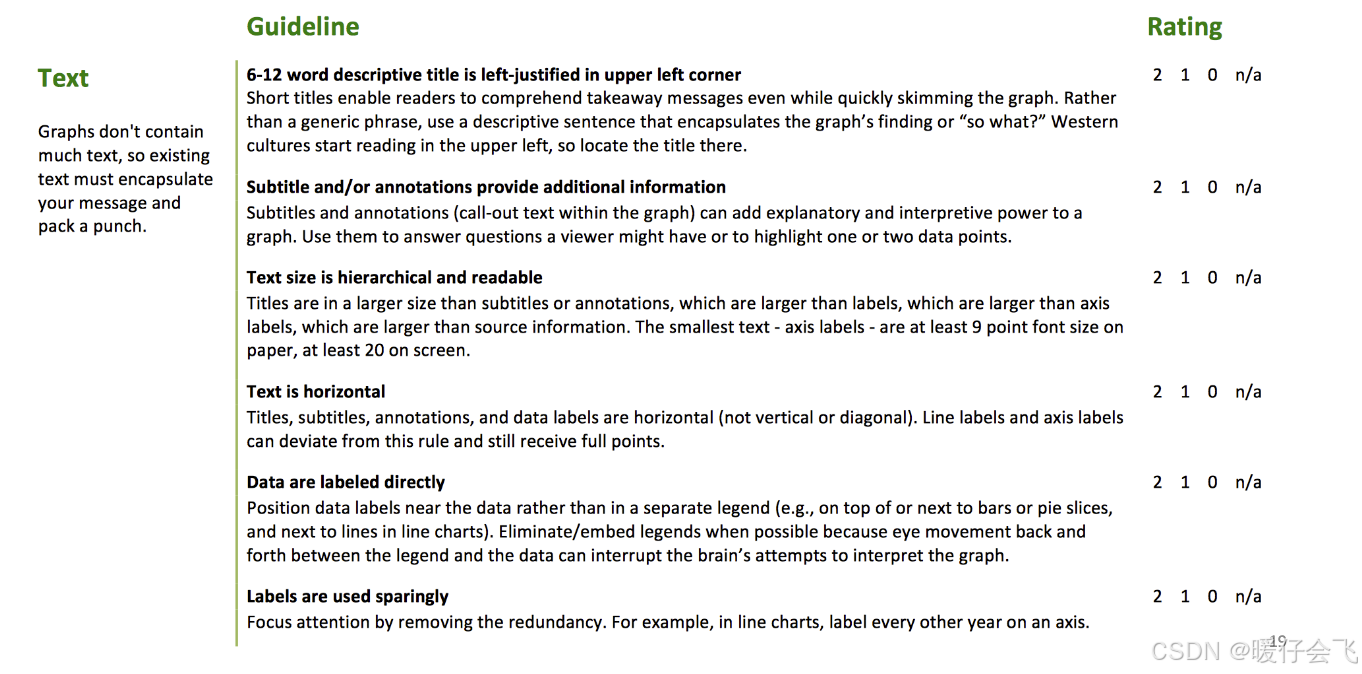
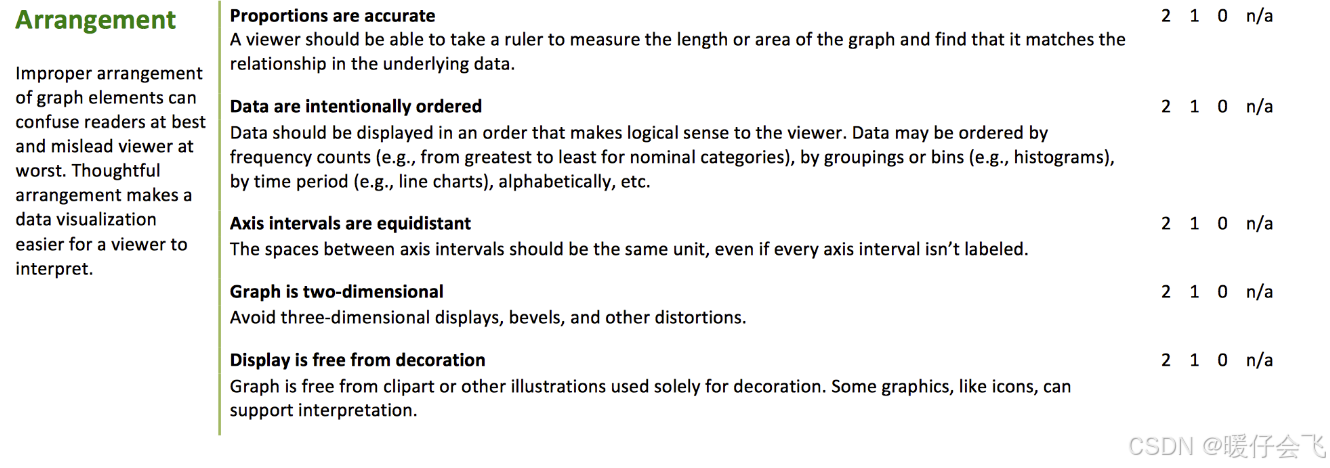
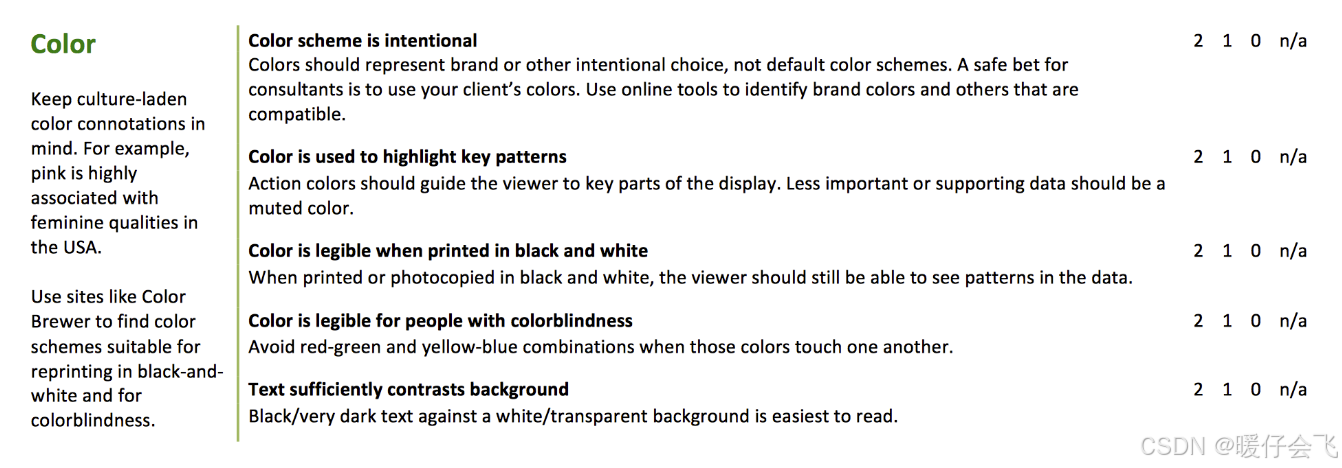
Evaluation Criteria(评估标准)
Evaluation Scale(评估量表示例)
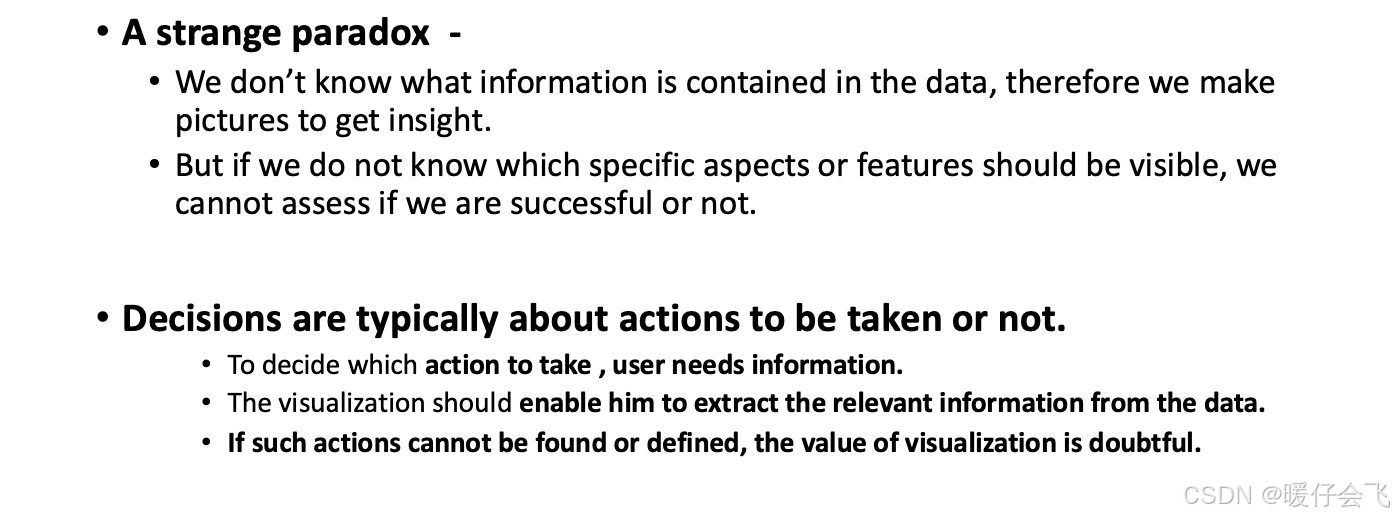
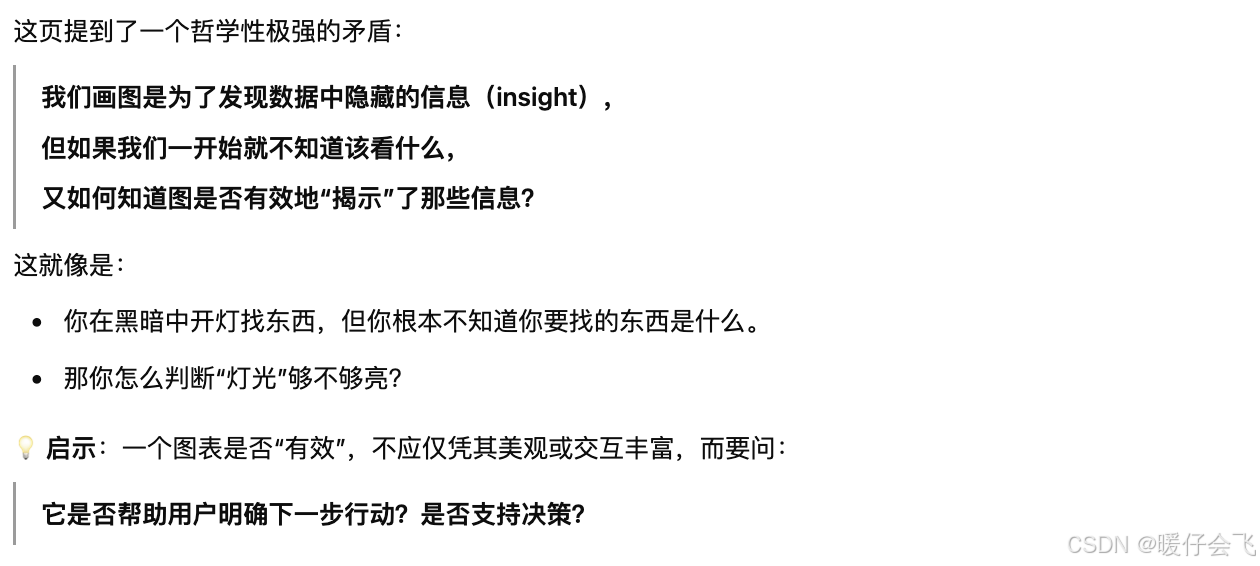
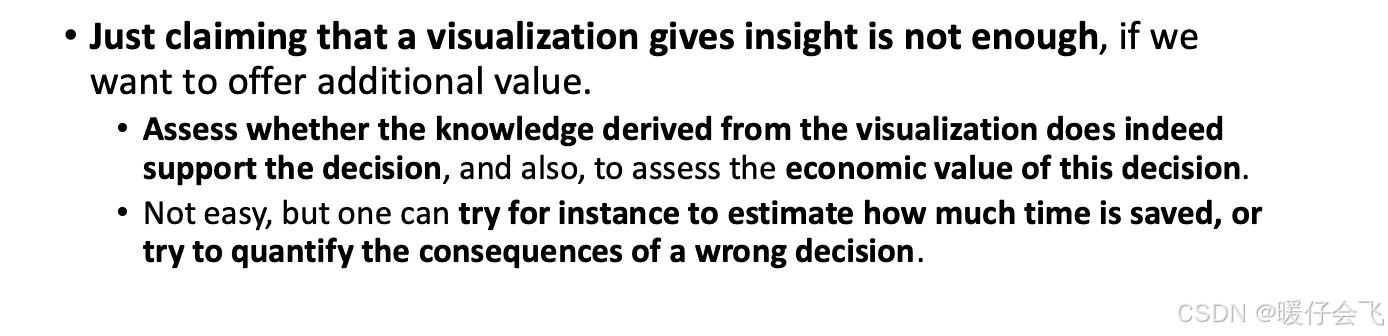
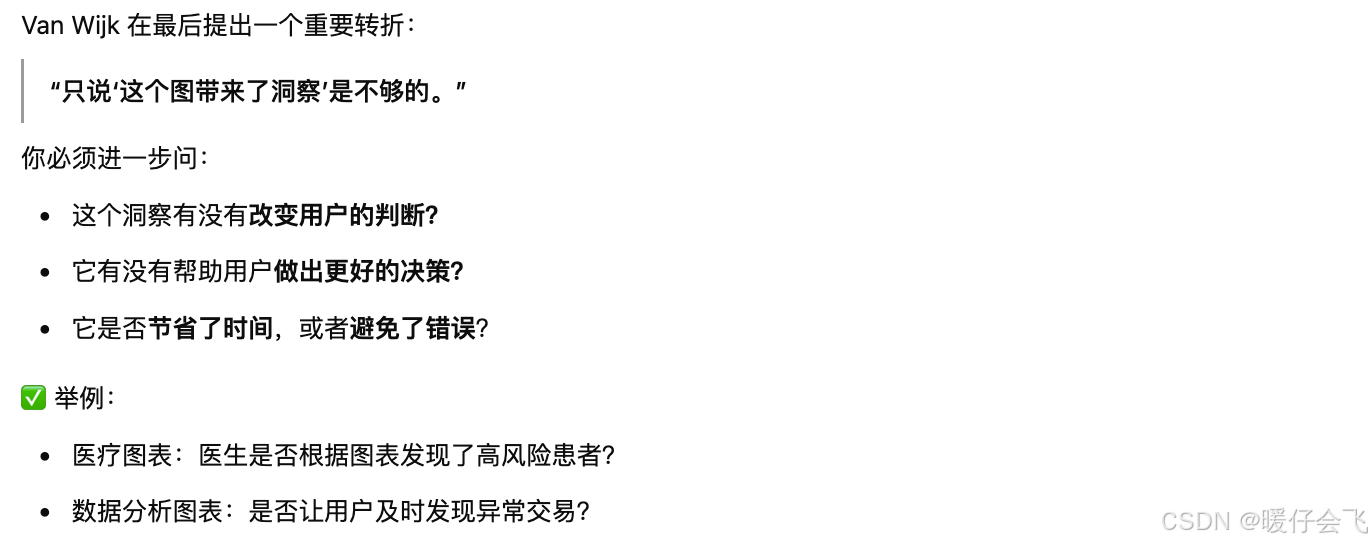
The Value of Visualization(可视化的价值)

Issues implied by the model of Visualization(通过可视化模型暗示的问题)
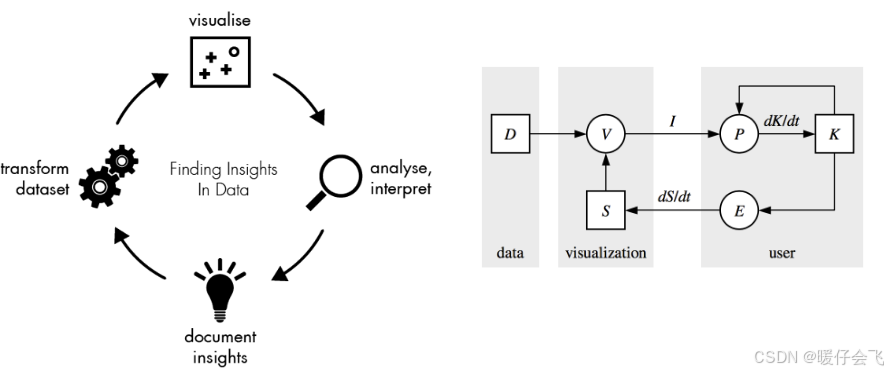
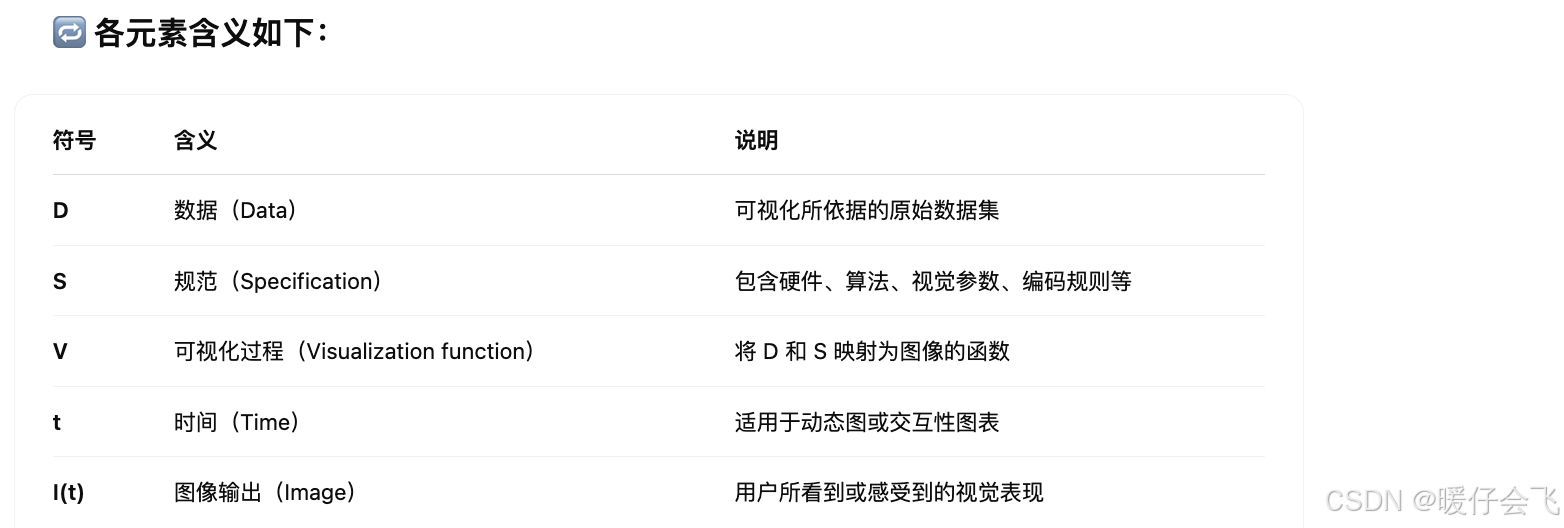
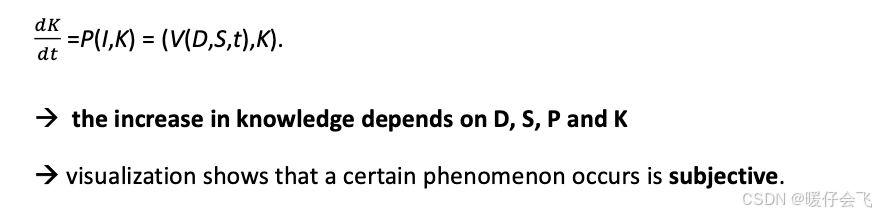
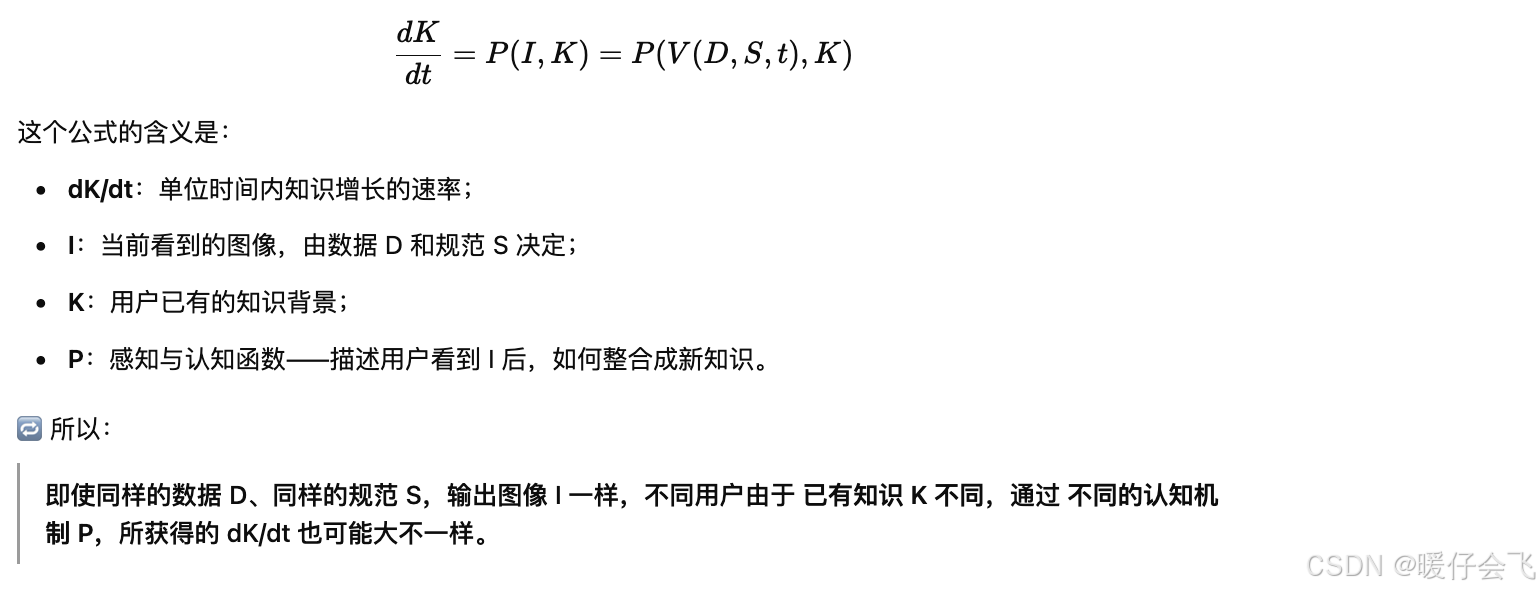
- 可视化是一个“从数据到图像”的转换函数;结合数据(D)和特定的规范(S)生成 image (I)
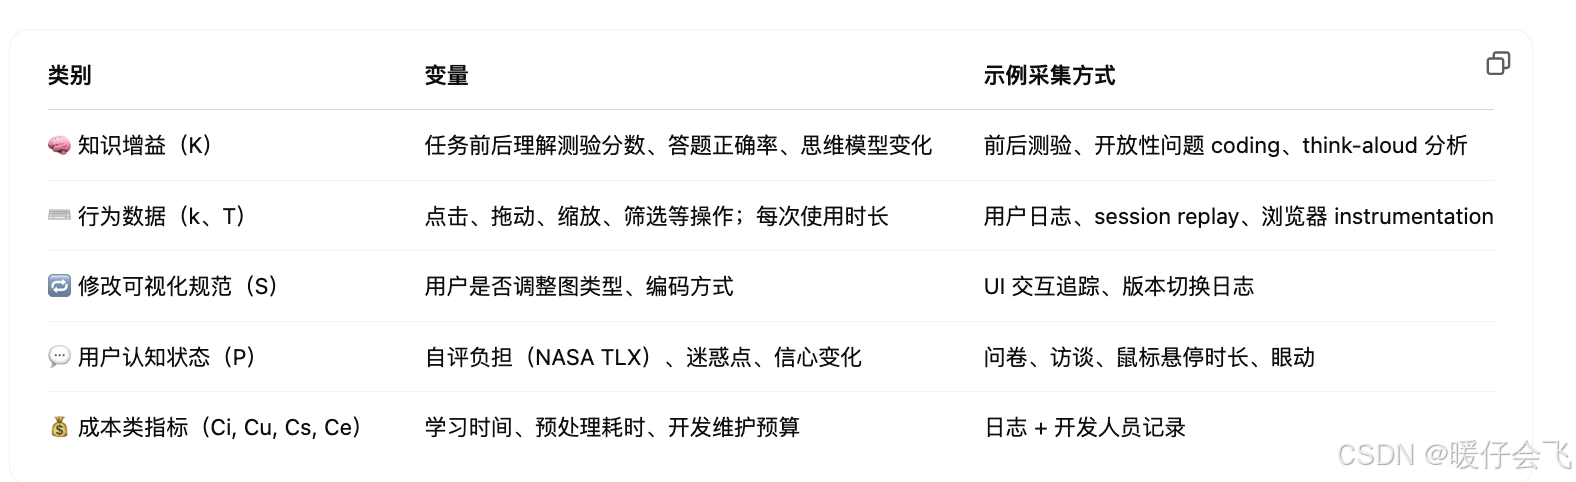
- I 通过用户感知(P) 来影响 user 的 知识总量(K)情况; 其中
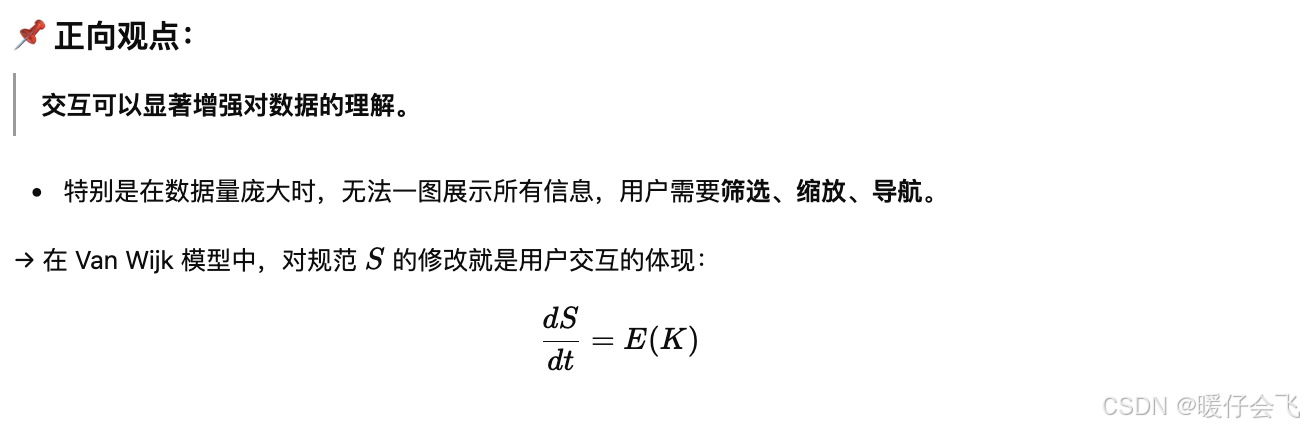
dK/dt代表知识增益(因为假设 user 已有的知识量 K 越大,那么他们能够从 image 中获得的 insight 就更多) - user 还会根据已有的知识进行探索,并可能改变可视化的方法(S);其中
dS/dt是单位时间内,用户对图表规范的调整强度或频率。

Insights and Knowledge(洞察与知识)
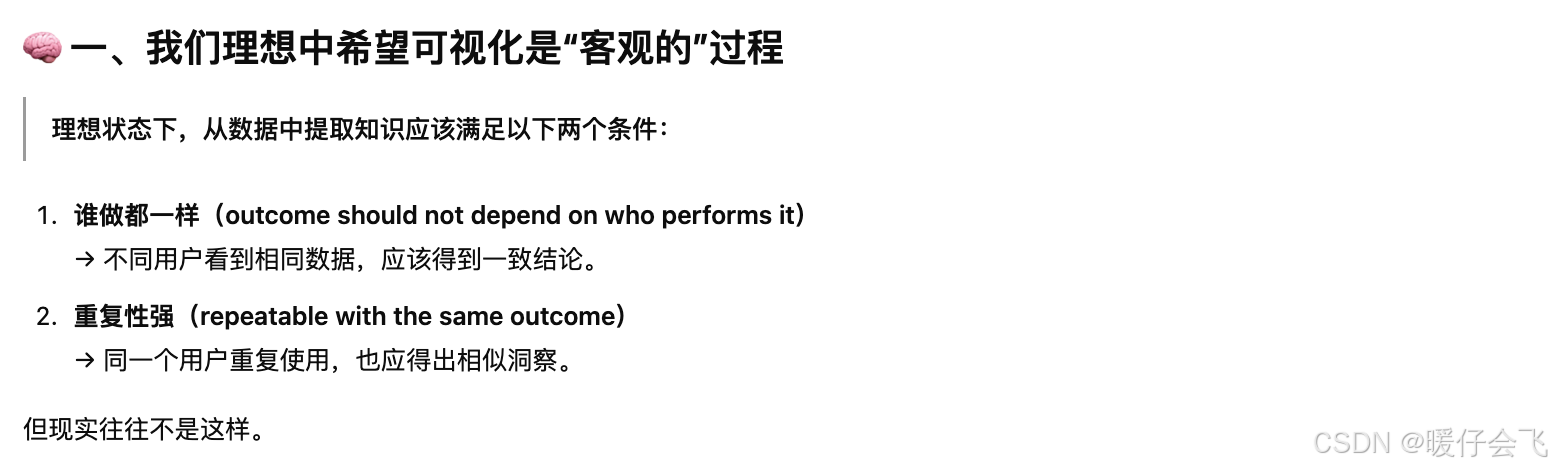
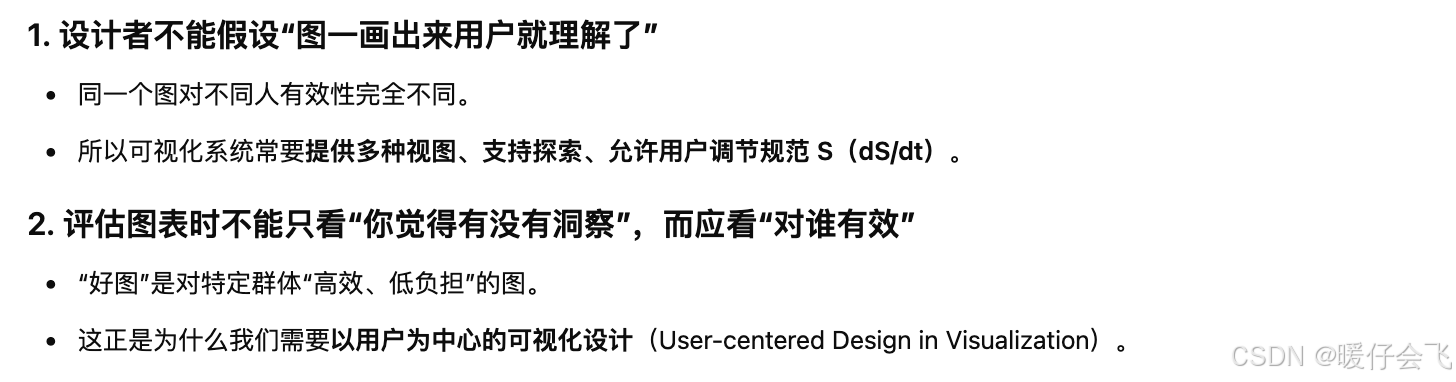
Visualization is subjective(可视化是主观的)
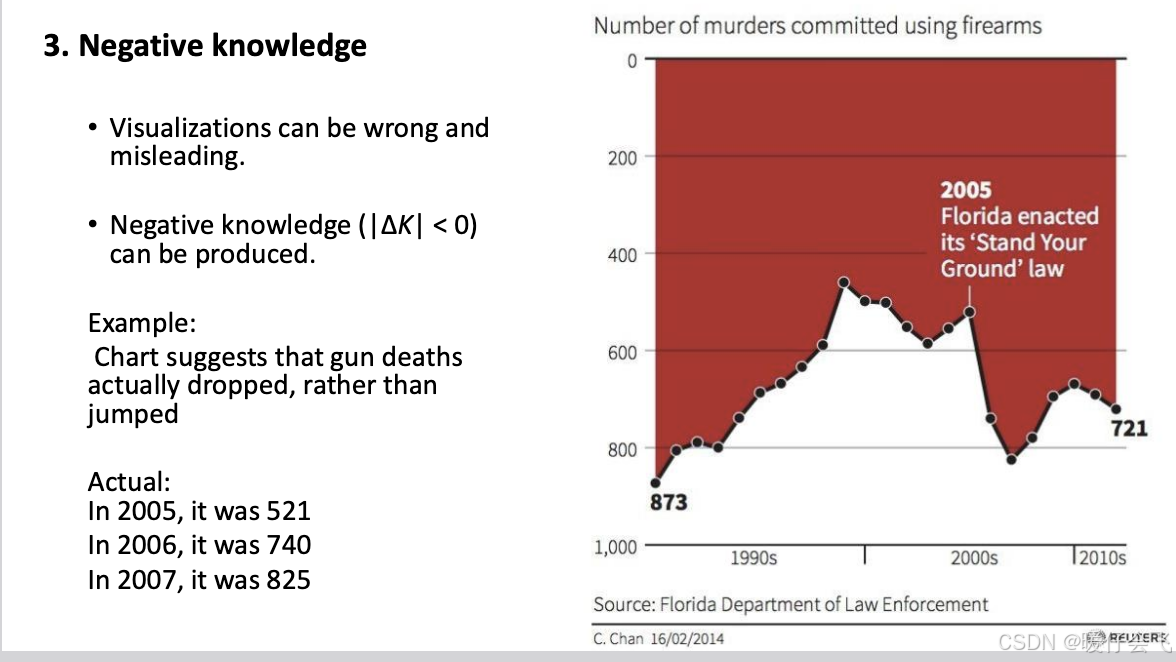
Negative Knowledge(负向知识)


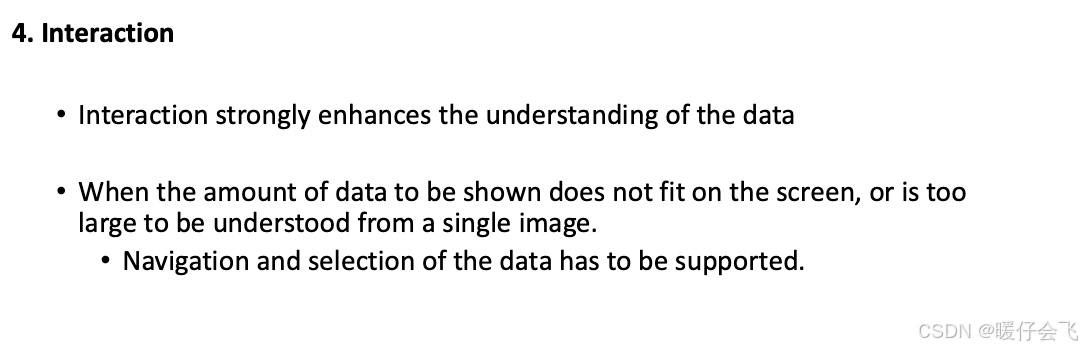
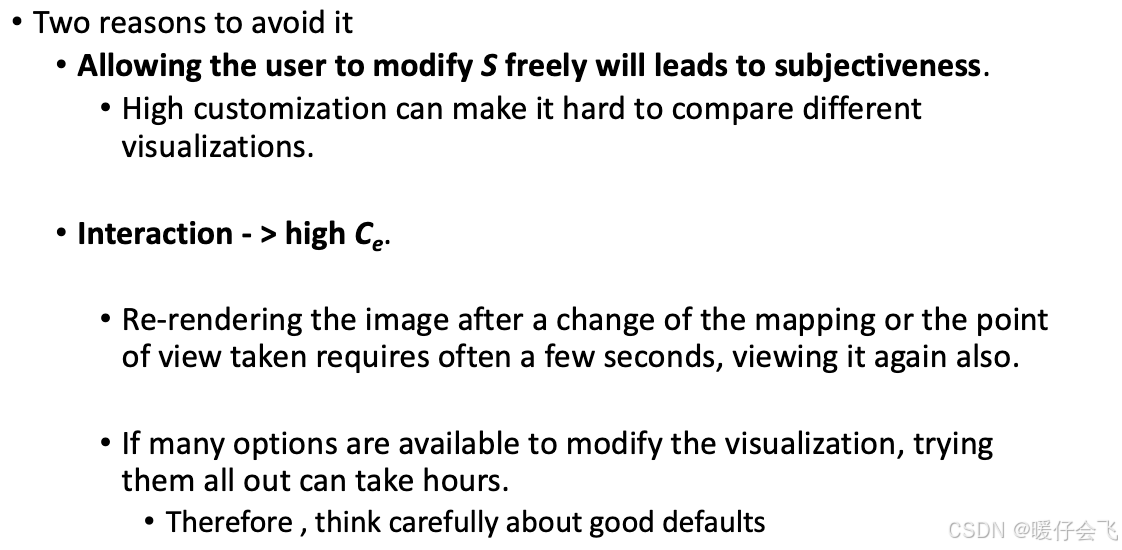
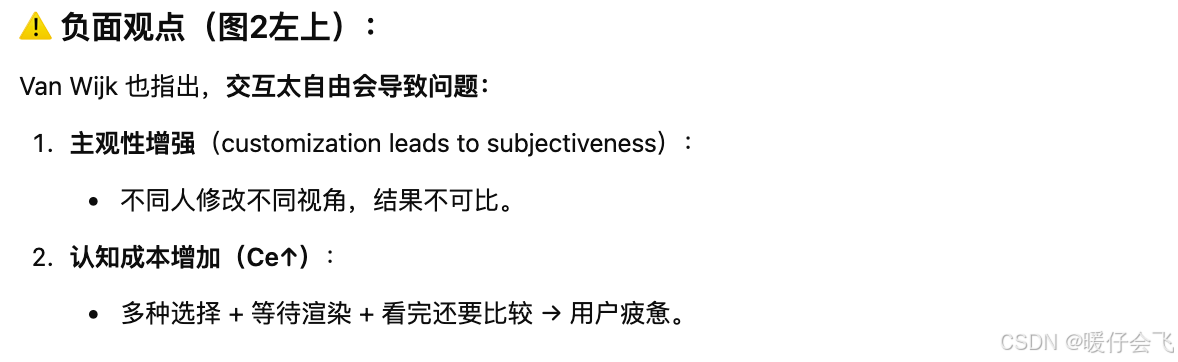
Interaction(交互)