spring boot + Prometheus + Grafana 实现项目监控
一、引入依赖
<dependencies>
    <!-- Spring Boot Starter Actuator -->
    <dependency>
        <groupId>org.springframework.boot</groupId>
        <artifactId>spring-boot-starter-actuator</artifactId>
    </dependency>

    <!-- Micrometer Registry for Prometheus -->
    <dependency>
        <groupId>io.micrometer</groupId>
        <artifactId>micrometer-registry-prometheus</artifactId>
    </dependency>
</dependencies>
二、ymal配置
# 配置actuator监视器的全部监控端点打开
management:
  endpoints:
    web:
      exposure:
        include: "*"
  endpoint:
    prometheus:
      enabled: true
    health:
      show-details: always
  metrics:
    export:
      prometheus:
        enabled: true # 启用Prometheus

spring:
  application:
      name: easy-brilliant
三、配置数据格式转化
package easy.brilliant.configuration;

import io.micrometer.core.instrument.Clock;
import io.micrometer.core.instrument.MeterRegistry;
import io.micrometer.prometheus.PrometheusConfig;
import io.micrometer.prometheus.PrometheusMeterRegistry;
import io.prometheus.client.CollectorRegistry;
import org.springframework.beans.factory.annotation.Value;
import org.springframework.boot.actuate.autoconfigure.metrics.MeterRegistryCustomizer;
import org.springframework.context.annotation.Bean;
import org.springframework.context.annotation.Configuration;

@Configuration
public class PrometheusConfiguration {

    @Bean
    public CollectorRegistry collectorRegistry() {
        return new CollectorRegistry();
    }

    @Bean
    public PrometheusMeterRegistry prometheusMeterRegistry(PrometheusConfig config, CollectorRegistry collectorRegistry) {
        return new PrometheusMeterRegistry(config, collectorRegistry, Clock.SYSTEM);
    }

    @Bean
    MeterRegistryCustomizer<MeterRegistry> configurePrometheus(@Value("${spring.application.name}") String name){
        return (registry -> registry.config().commonTags("application",name));
    }

}
四、安装并配置Prometheus
下载地址:https://prometheus.io/ (下载最新版) 我的csdn地址:https://download.csdn.net/download/weixin_42172472/90579623
prometheus 配置:
# my global config
global:
  scrape_interval: 15s # Set the scrape interval to every 15 seconds. Default is every 1 minute.
  evaluation_interval: 15s # Evaluate rules every 15 seconds. The default is every 1 minute.
  # scrape_timeout is set to the global default (10s).

# Alertmanager configuration
alerting:
  alertmanagers:
    - static_configs:
        - targets:
          # - alertmanager:9093

# Load rules once and periodically evaluate them according to the global 'evaluation_interval'.
rule_files:
  # - "first_rules.yml"
  # - "second_rules.yml"

# A scrape configuration containing exactly one endpoint to scrape:
# Here it's Prometheus itself.
scrape_configs:
  - job_name: 'easy-brilliant'
    metrics_path: '/actuator/prometheus'
    static_configs:
      - targets: ['localhost:8047'] # 使用你的Spring Boot应用程序的实际主机和端口替换
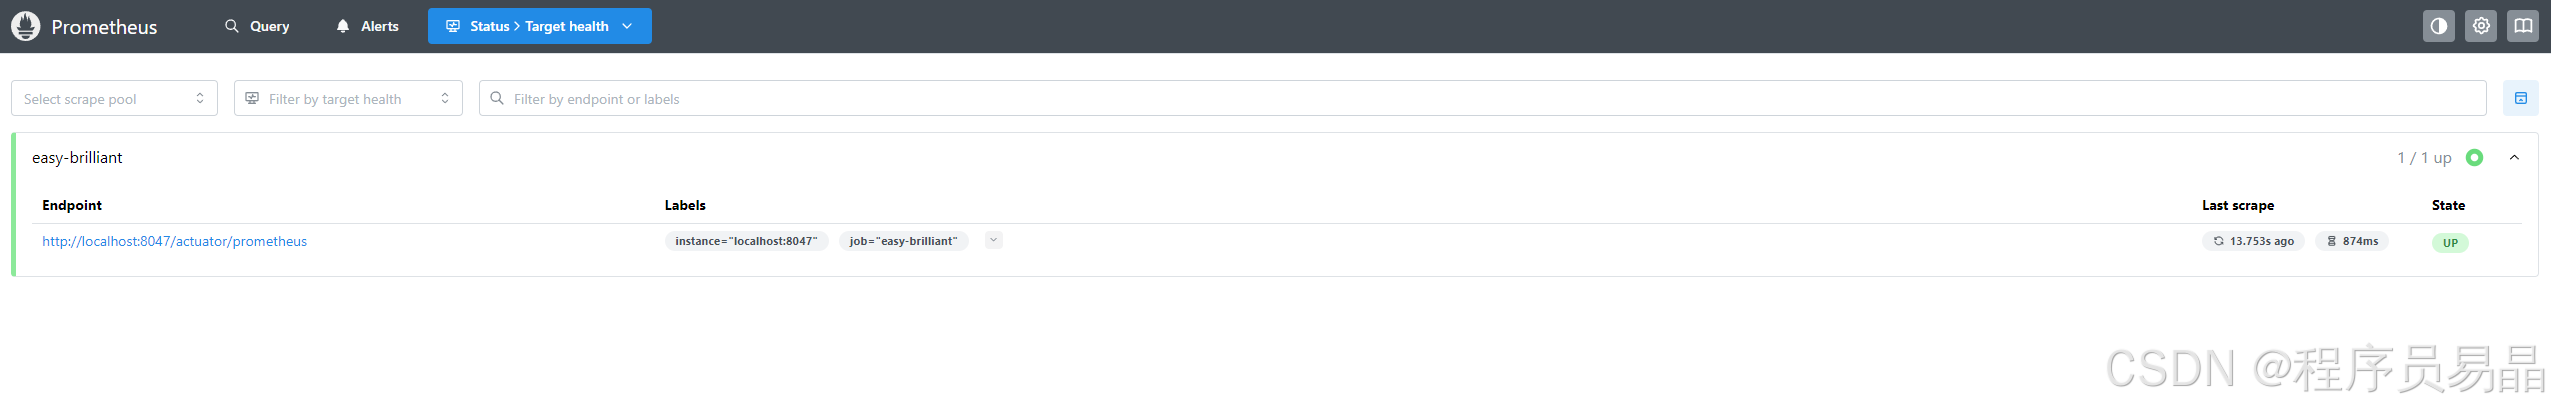
测试是否配置成功,请求 http://127.0.0.1:9090/targets,出现如下界面就算请求成功
五、安装并配置Grafana
下载Grafana : Download Grafana | Grafana Labs ,我的csdn地址:https://download.csdn.net/download/weixin_42172472/90579615
安装并启动grafana-server.exe ,访问 http://127.0.0.1:3000/
1.Grafana 数据源配置
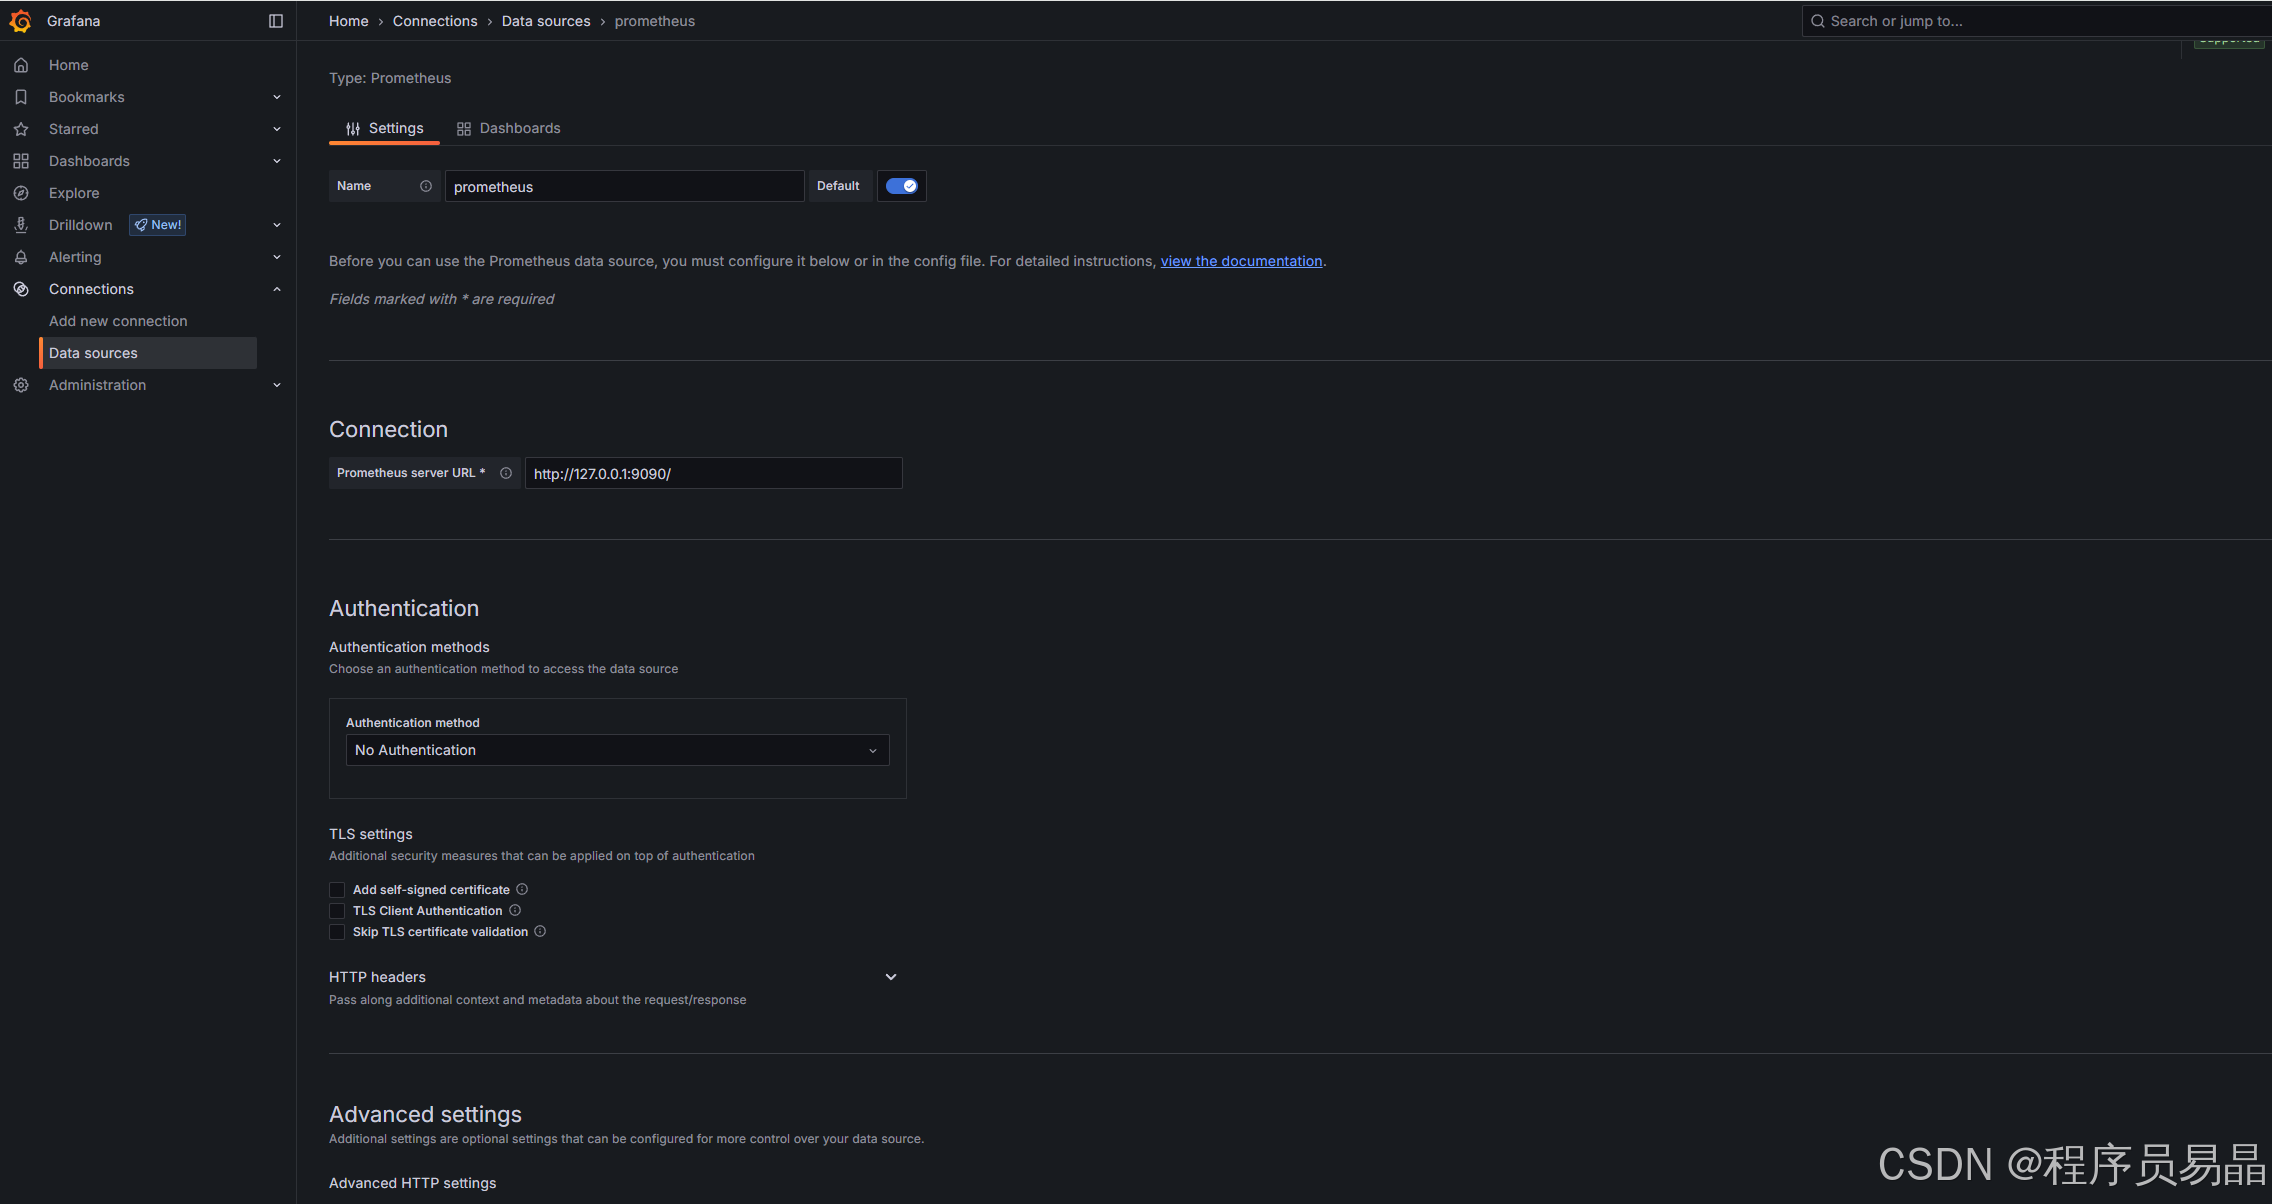
配置 Connection,点击Save & test 测试是否配置成功。
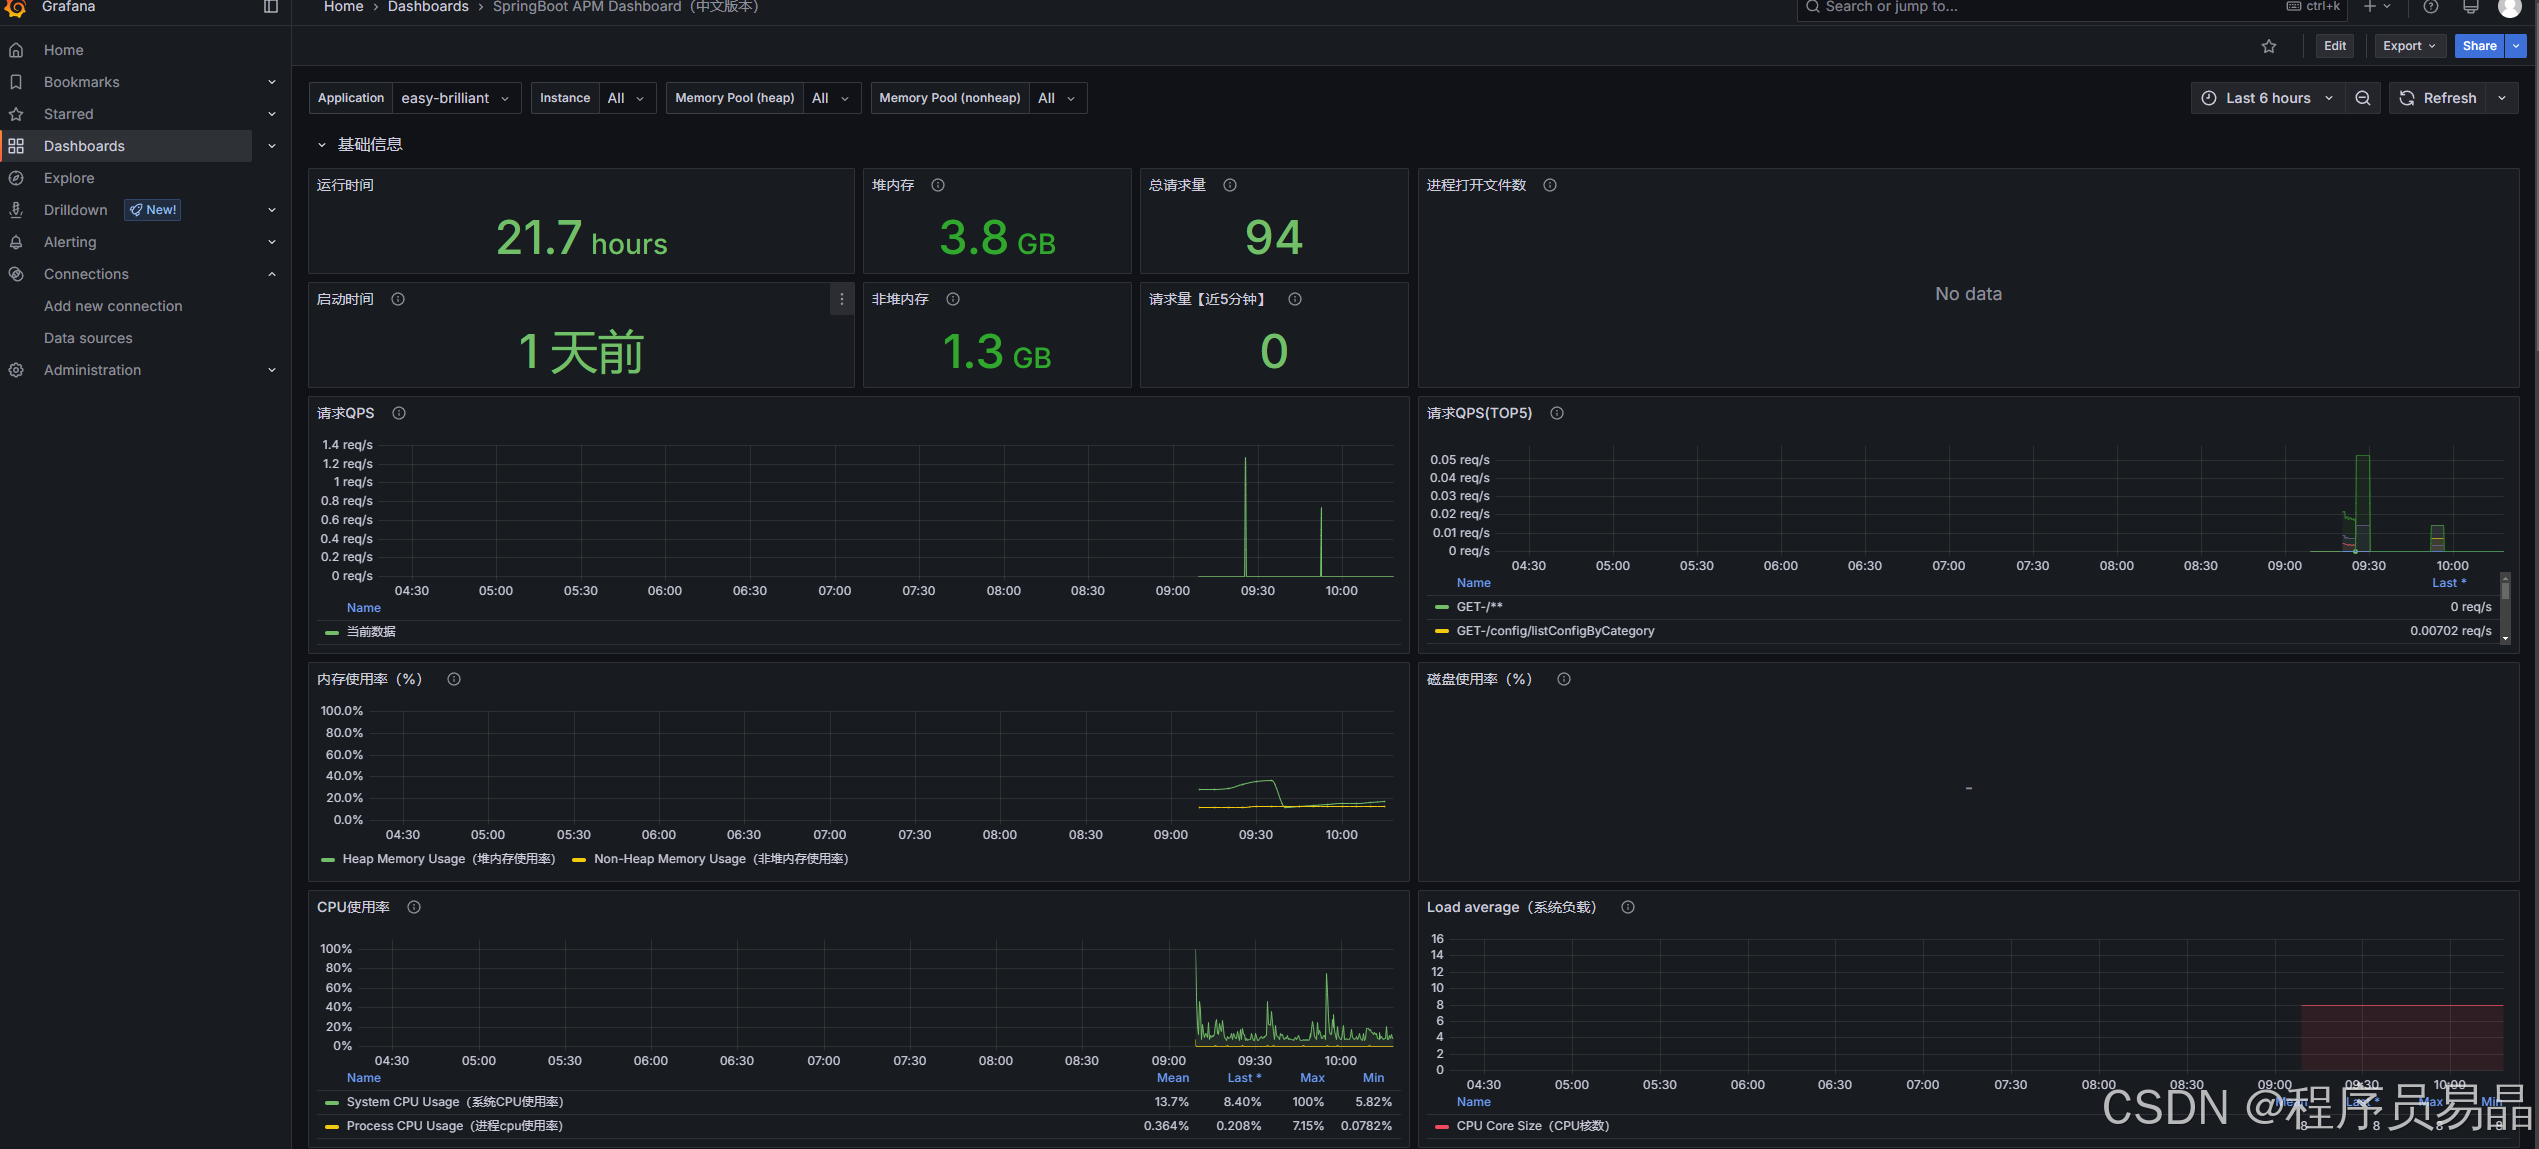
2.面板配置
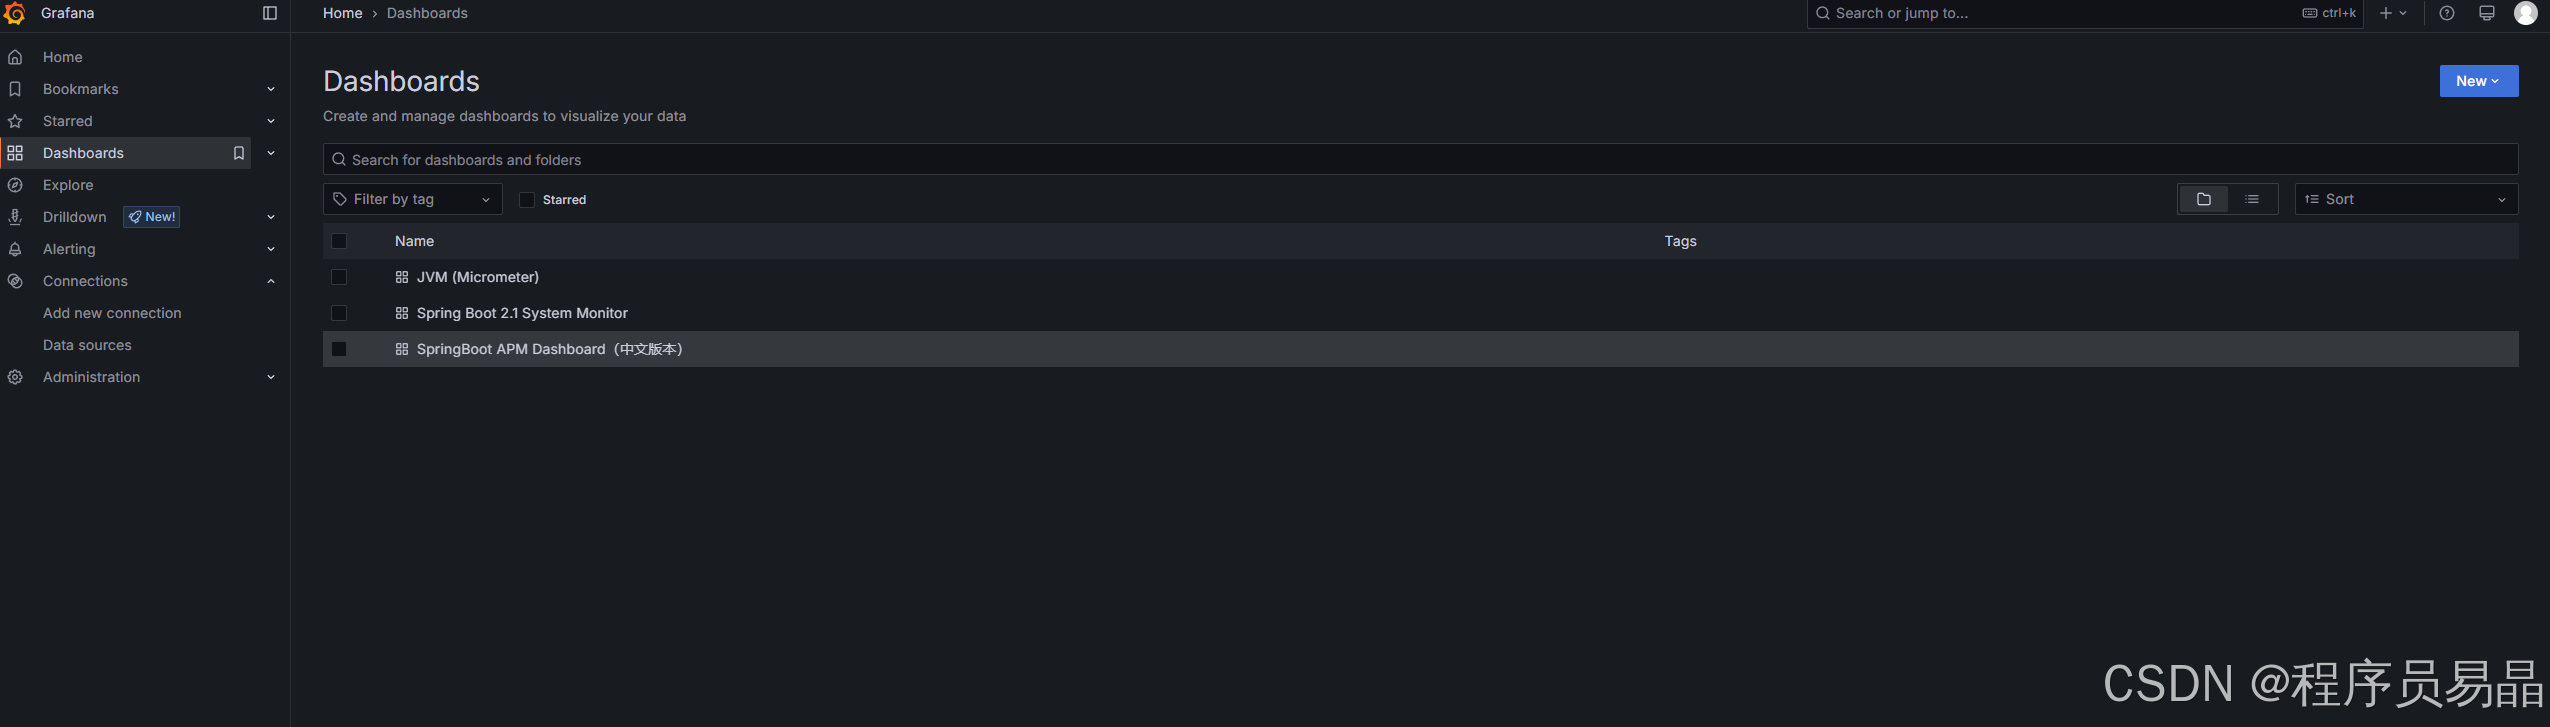
点击Import
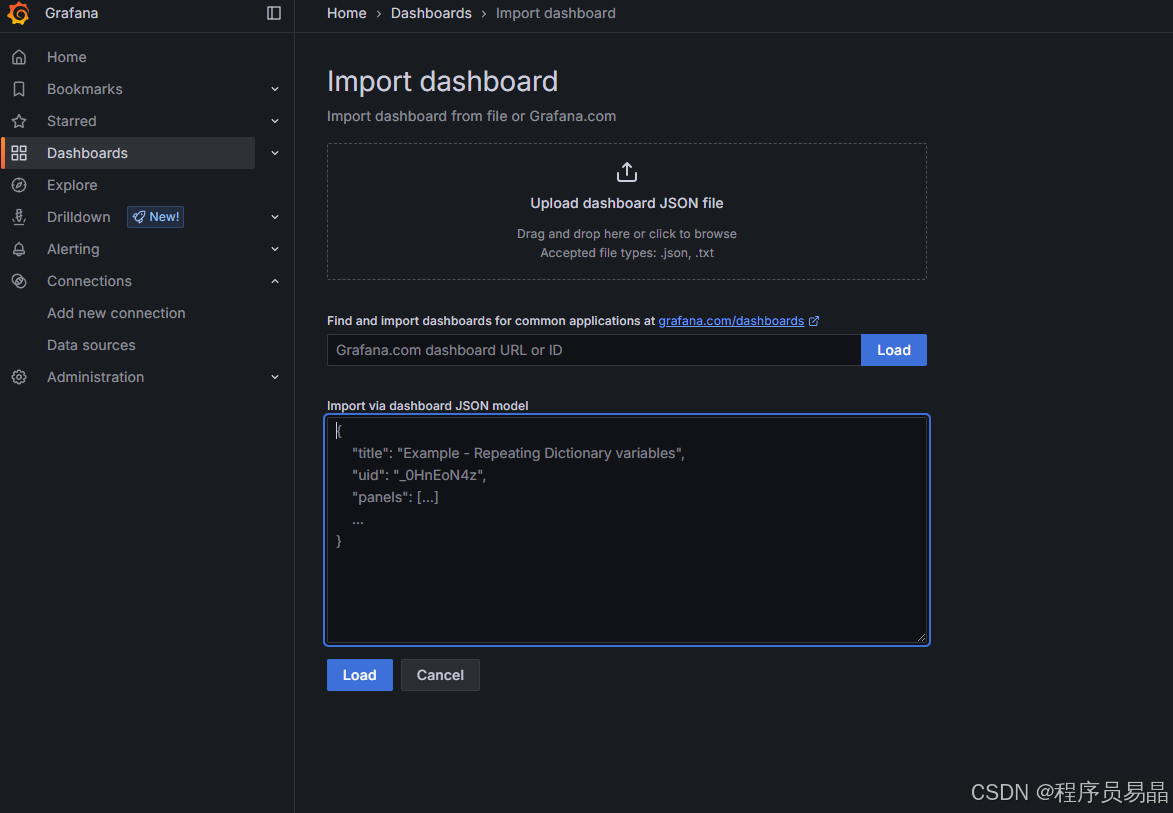
输入ID 21319,选择数据源Prometheus,点击load,监控成功