绘制动态甘特图(以流水车间调度为例)

import matplotlib.pyplot as plt
import matplotlib.animation as animation
import numpy as np
from matplotlib import cm
# 中文字体配置(必须放在所有绘图语句之前)
plt.rcParams['font.sans-serif'] = ['SimHei']
plt.rcParams['axes.unicode_minus'] = False
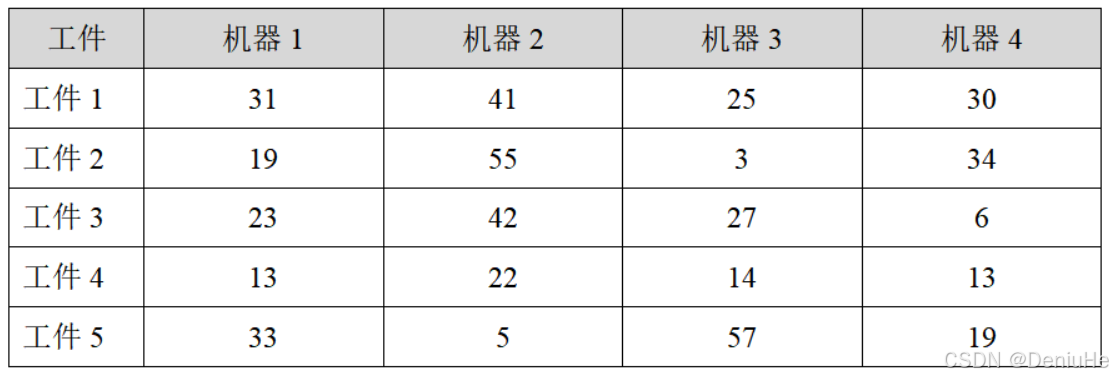
# 时间矩阵数据
jobs = {
'工件1': [31, 41, 25, 30],
'工件2': [19, 55, 3, 34],
'工件3': [23, 42, 27, 6],
'工件4': [13, 22, 14, 13],
'工件5': [33, 5, 57, 19]
}
# 初始化变量
machines = ['机器1', '机器2', '机器3', '机器4']
order = list(jobs.keys())
current_time = {m: 0 for m in machines}
# 使用专业色系(参考网页7)
colors = cm.get_cmap('viridis', len(jobs))(np.linspace(0, 1, len(jobs)))
# 计算调度时间表
schedule = []
total_time = 0
for job in order:
times = jobs[job]
start_times = []
end_times = []
for i, (m, t) in enumerate(zip(machines, times)):
start = max(current_time[m], end_times[-1] if i > 0 else 0)
end = start + t
start_times.append(start)
end_times.append(end)
current_time[m] = end
total_time = max(total_time, max(end_times))
schedule.append({'job': job, 'start': start_times, 'end': end_times})
# 创建动态甘特图
fig, ax = plt.subplots(figsize=(12, 6))
ax.set_xlabel('时间')
ax.set_ylabel('机器')
ax.set_yticks(range(len(machines)))
ax.set_yticklabels(machines)
ax.set_title(f'流水车间调度甘特图 | 合计用时:{total_time} 单位')
# 动画初始化函数
def init():
ax.set_xlim(0, total_time)
return []
# 动画更新函数(优化颜色绑定)
def update(frame):
ax.clear()
ax.set_yticks(range(len(machines)))
ax.set_yticklabels(machines)
current_total = 0
for i, s in enumerate(schedule[:frame+1]):
for m_idx in range(len(machines)):
start = s['start'][m_idx]
end = s['end'][m_idx]
duration = end - start
ax.broken_barh([(start, duration)],
(m_idx-0.4, 0.8),
facecolors=colors[i],
edgecolor='black',
linewidth=0.5)
current_total = max(current_total, end)
# 动态创建图例句柄(参考网页6)
handles = [plt.Rectangle((0,0),1,1, color=colors[i], ec='black')
for i in range(frame+1)]
ax.legend(handles, order[:frame+1],
loc='upper right',
title='加工序列',
facecolor='#F0F0F0',
edgecolor='black')
ax.set_title(f'流水车间调度进度({frame+1}/{len(order)})| 当前用时:{current_total} | 总用时:{total_time}')
return []
# 生成动画(调慢播放速度)
ani = animation.FuncAnimation(
fig,
update,
frames=len(order),
interval=1500, # 每帧间隔1.5秒
init_func=init,
blit=True,
repeat=False
)
plt.show()