网站页面设计尺寸地推任务网
监控指标设置
使用 prometheus-cpp 进行监控指标设置,这里以 mqtt-server 的活跃连接数为例,统计四种协议类型的活跃连接数,在接收到连接进行连接数加一,连接断开时进行连接数减一,使用 gauge 类型
#pragma once#include <unordered_map>#include "metrics/IMetrics.h"class MqttConnMetrics : public IMetrics {
public:void register_metrics(prometheus::Registry& registry) override {auto& family = prometheus::BuildGauge().Name("mqtt_active_connections").Help("Number of active MQTT connections").Register(registry);protocol_gauges_ = {{MQTT_PROTOCOL::MQTT, &family.Add({{"protocol", "mqtt"}})},{MQTT_PROTOCOL::MQTTS, &family.Add({{"protocol", "mqtts"}})},{MQTT_PROTOCOL::WS, &family.Add({{"protocol", "ws"}})},{MQTT_PROTOCOL::WSS, &family.Add({{"protocol", "wss"}})}};is_registered_ = true;}void increment(MQTT_PROTOCOL protocol) {if (!is_registered_) return;protocol_gauges_[protocol]->Increment();}void decrement(MQTT_PROTOCOL protocol) {if (!is_registered_) return;protocol_gauges_[protocol]->Decrement();}private:bool is_registered_ = false;std::unordered_map<MQTT_PROTOCOL, prometheus::Gauge*> protocol_gauges_;
};
开发完成后,可以通过 http://<address>:<port>/metrics 路径访问到所有的监控指标
prometheus 采集监控指标
安装好 prometheus 之后修改一下 prometheus.yml 配置中 采集的目的地址
# my global config
global:scrape_interval: 15s # Set the scrape interval to every 15 seconds. Default is every 1 minute.evaluation_interval: 15s # Evaluate rules every 15 seconds. The default is every 1 minute.# scrape_timeout is set to the global default (10s).# Alertmanager configuration
alerting:alertmanagers:- static_configs:- targets:# - alertmanager:9093# Load rules once and periodically evaluate them according to the global 'evaluation_interval'.
rule_files:# - "first_rules.yml"# - "second_rules.yml"# A scrape configuration containing exactly one endpoint to scrape:
# Here it's Prometheus itself.
scrape_configs:# The job name is added as a label `job=<job_name>` to any timeseries scraped from this config.- job_name: "mqtt-server"scrape_interval: 1s# metrics_path defaults to '/metrics'# scheme defaults to 'http'.static_configs:- targets: ["localhost:8085"]
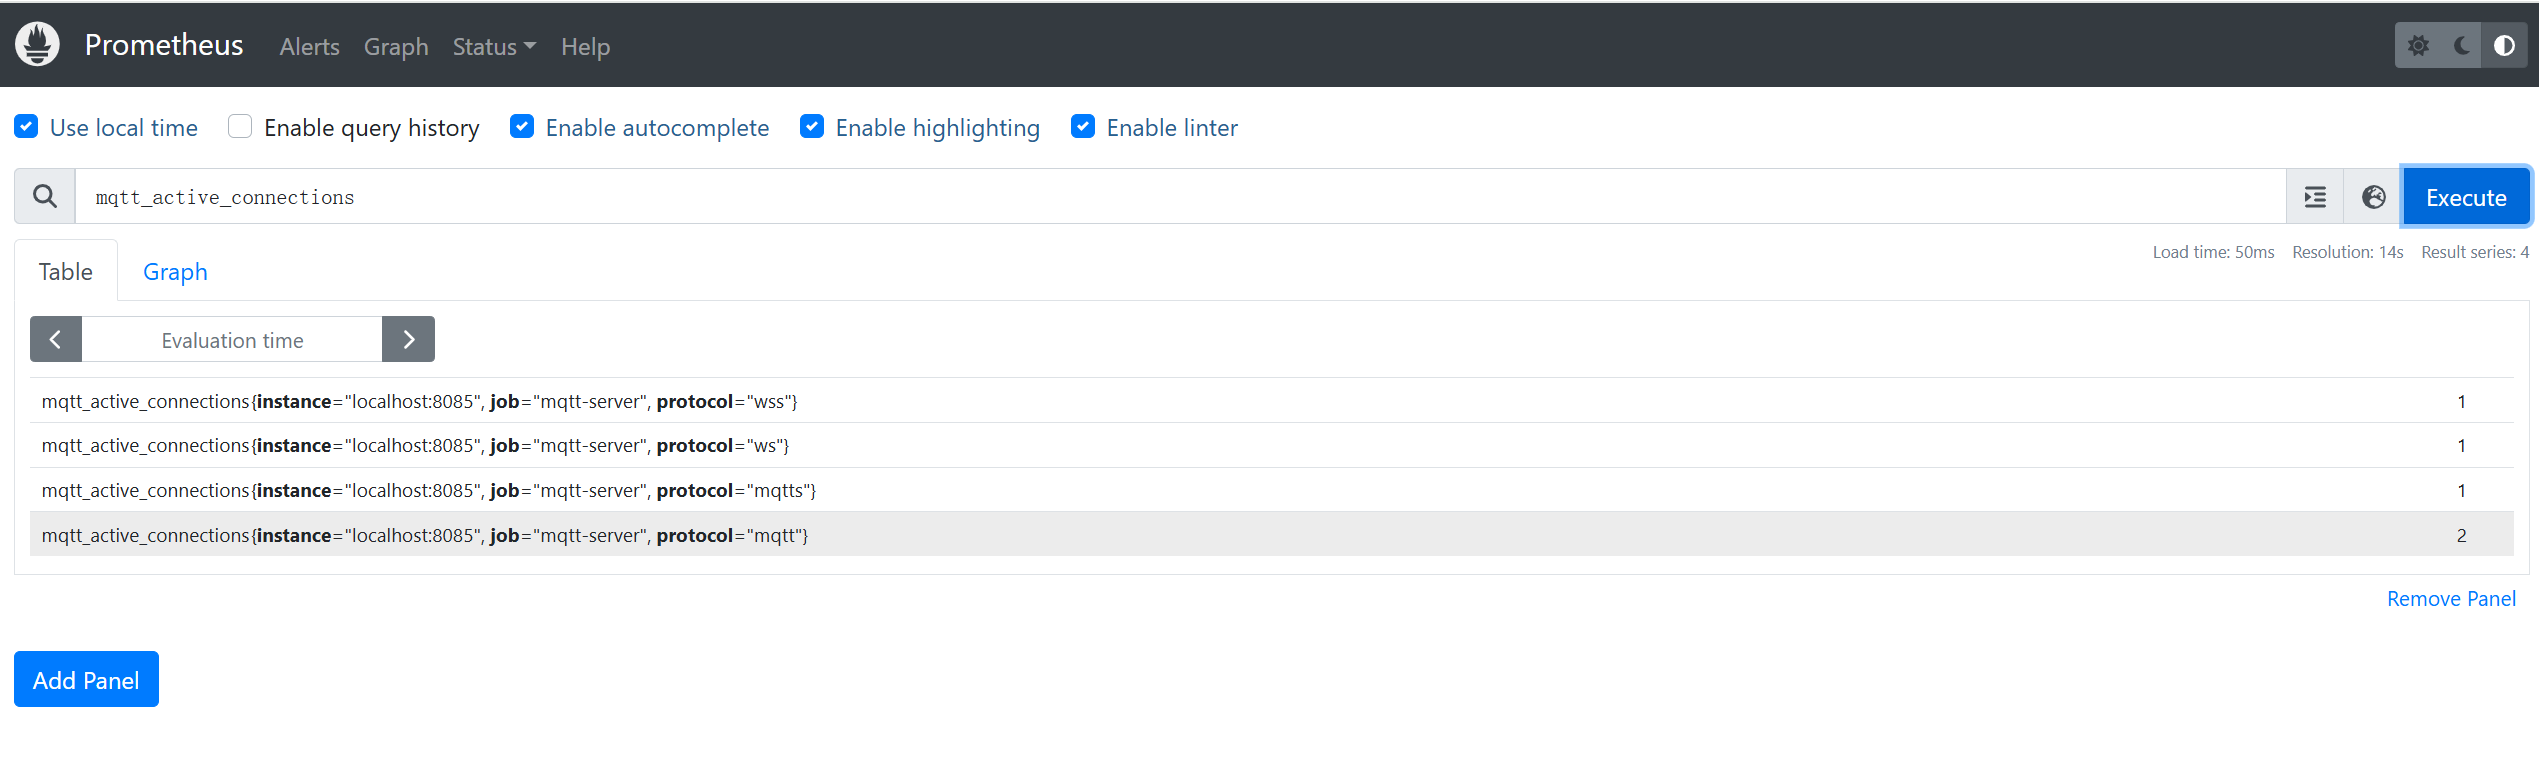
启动后访问 prometheus 界面,检查是否成功采集到,默认地址 http://localhost:9090
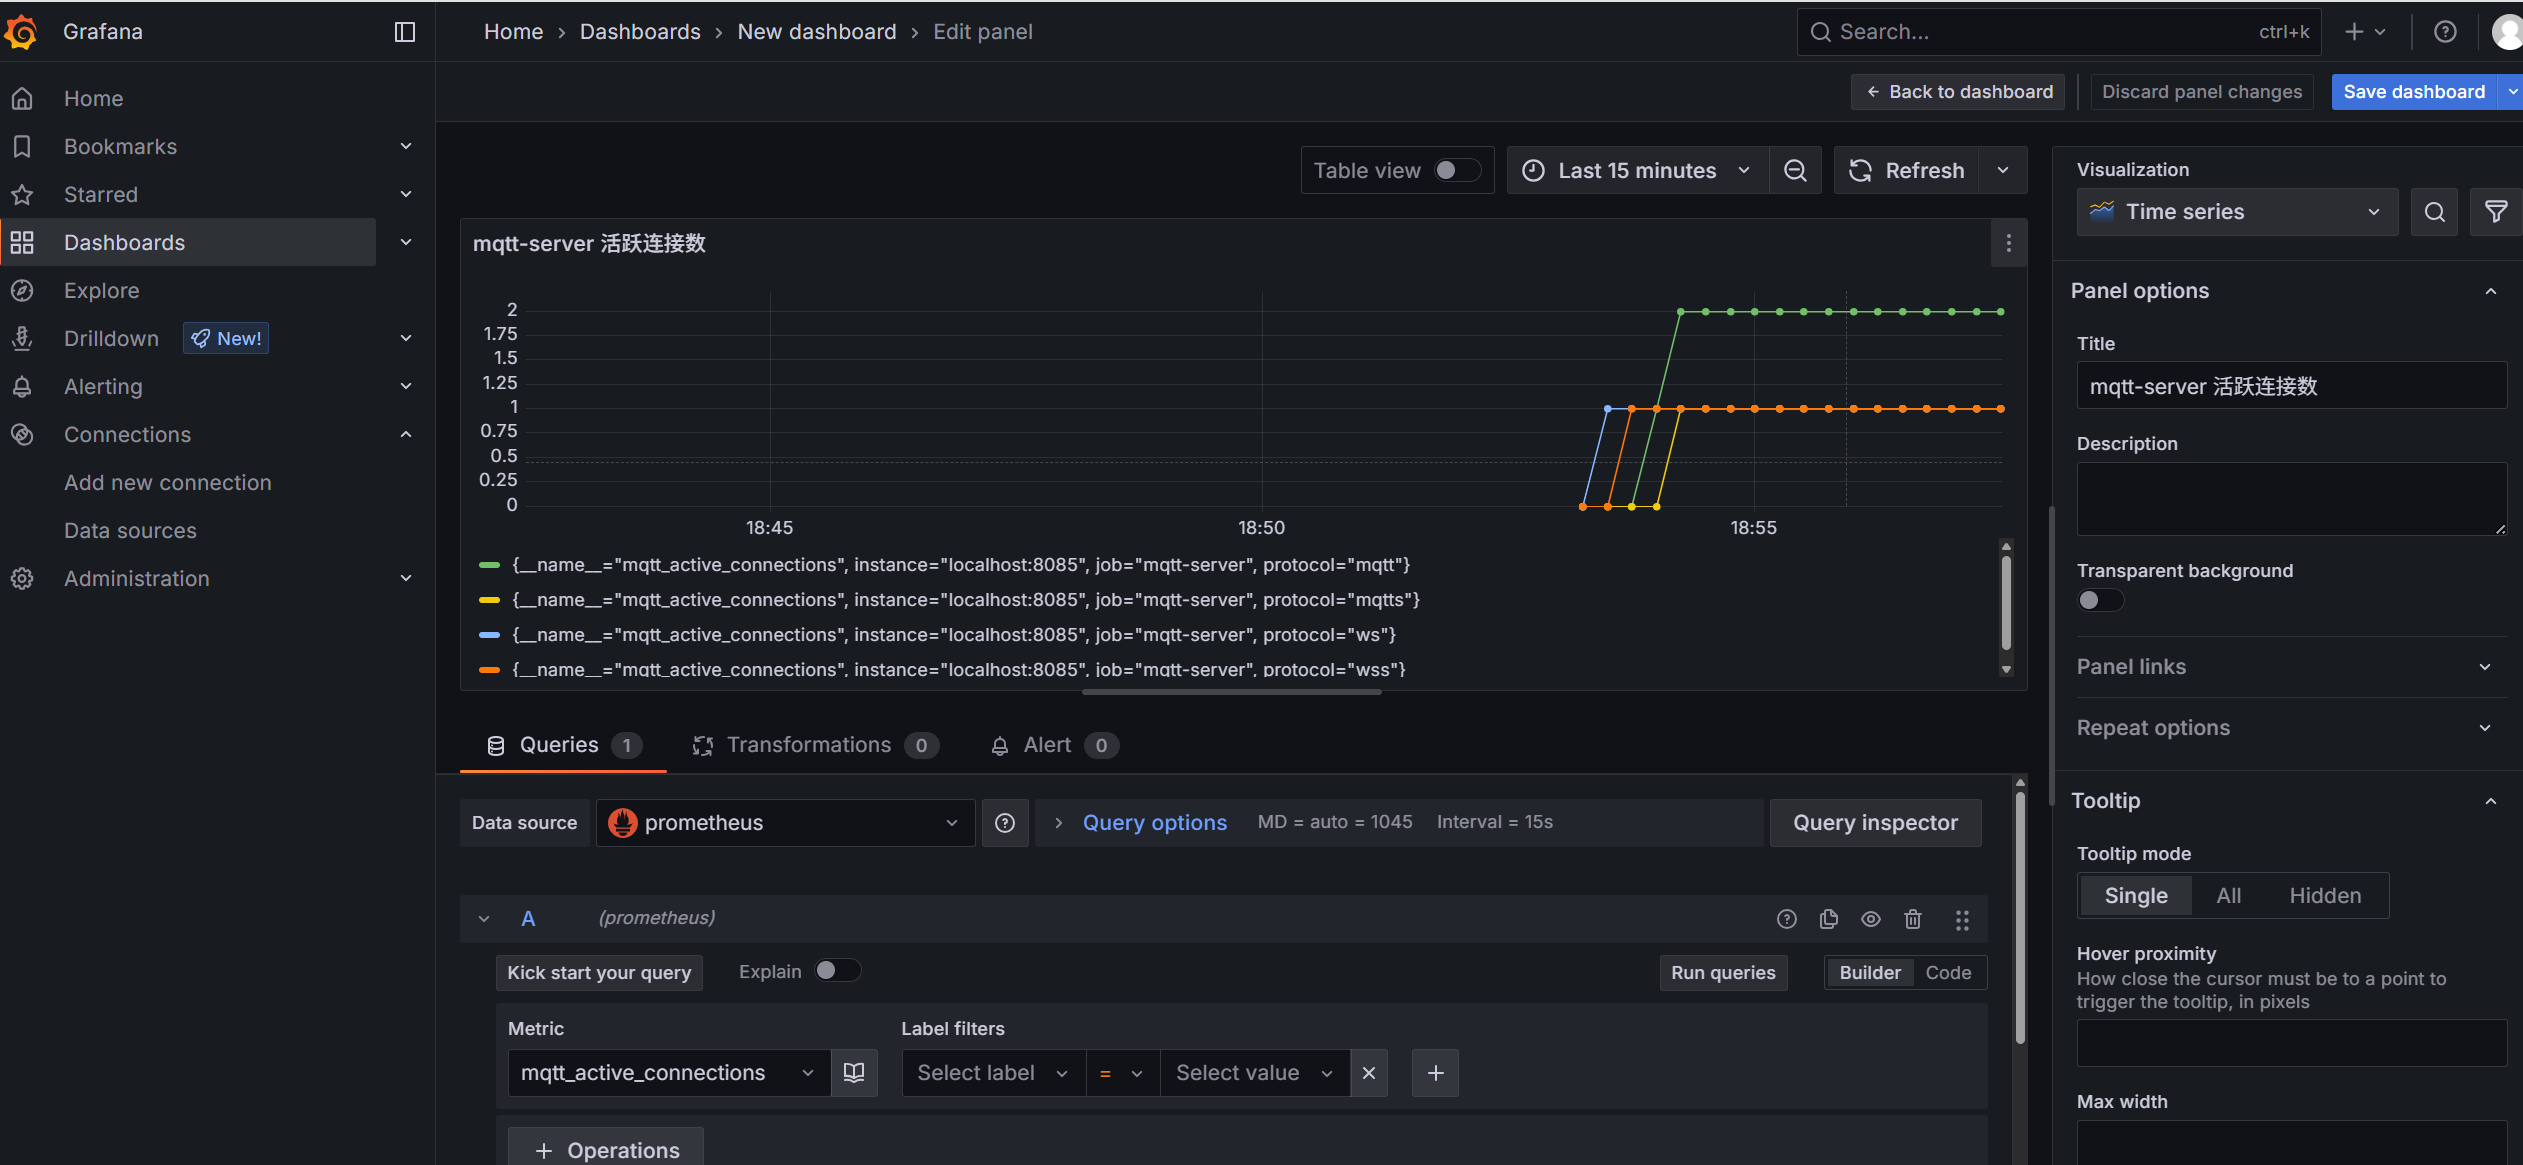
grafana 展示监控数据
安装完 grafana 之后,进入界面添加 prometheus 数据源,然后新增仪表盘,配置监控指标等