ElfBoard技术贴|如何在【RK3588】ELF 2开发板进行GDB调试
GDB(GNU Project Debugger)是在Linux环境下功能全面的调试工具。它提供了一系列强大的调试功能,包括设置断点、单步执行、打印与观察变量、查看寄存器及堆栈信息等。在Linux软件开发的实践中,GDB被视为调试C及C++程序的核心工具,广泛用于帮助开发者定位和解决程序中的问题。
1. 虚拟机中安装GDB工具
为避免符号解析错误或架构不兼容问题,用于远程调试的GDB应在版本上与开发板的工具链对齐。
elf@ubuntu:~/work/EDU/sdk/ELF2-linux-source$ ./build.sh bconfig路径:
-> Toolchain 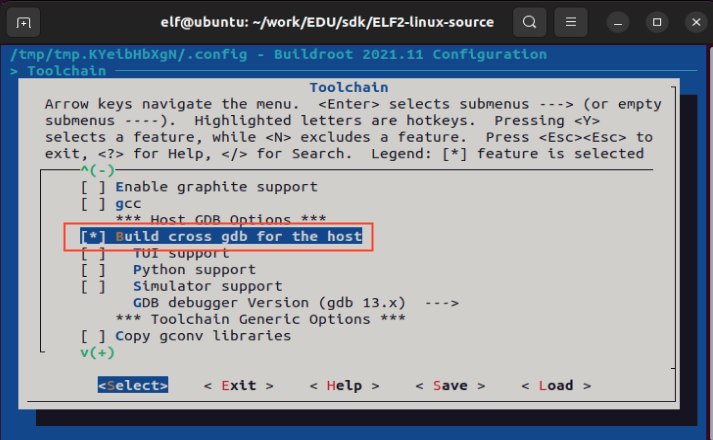
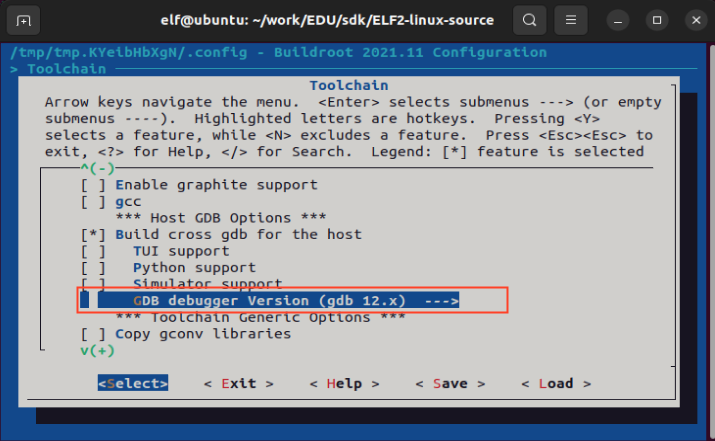
选择GDB版本,这里选择gdb12.x
2. 文件系统添加gdbserver功能
elf@ubuntu:~/work/EDU/sdk/ELF2-linux-source$ ./build.sh bconfig路径:
-> Target packages
-> Debugging, profiling and benchmark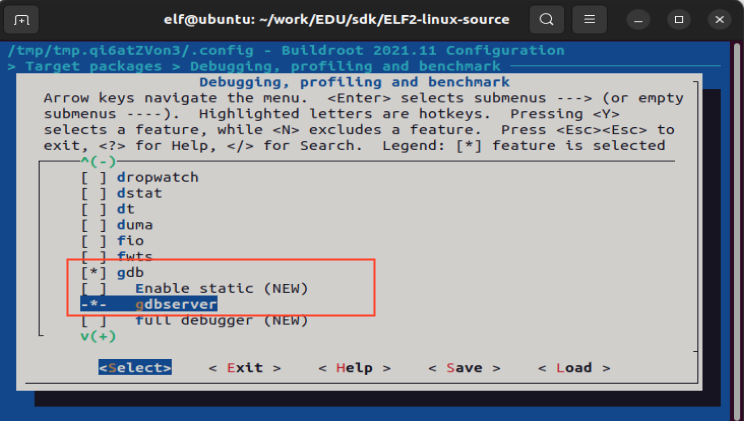
3. 重新编译
elf@ubuntu:~/work/EDU/sdk/ELF2-linux-source$ ./build.sh buildroot这样就可以将软件包直接编译到文件系统的镜像中了。
4. 烧写文件系统
5. 应用编译及拷贝
elf@ubuntu:~/work$ vi gdbdemo.c例程代码如下:
#include<stdio.h>
int main() {int a = 10;int b = 20;int sum = a + b;printf("a = %d, b = %d\n", a, b);printf("sum = %d\n", sum);for (int i = 0; i < 5; i++) {printf("Loop i = %d\n", i);}return 0;
}
添加交叉编译器路径,进行交叉编译,编译要调试的应用程序:必须要加-g选项
elf@ubuntu:~/work$ export PATH=/home/elf/aarch64-buildroot-linux-gnu_sdk-buildroot/bin/:$PATH
elf@ubuntu:~/work$ aarch64-linux-gcc -g gdbdemo.c -o gdbdemo
将编译生成的gdbdemo通过U盘拷贝到开发板上,比如/home/elf路径下,下述以U盘为例,拷贝到开发板。
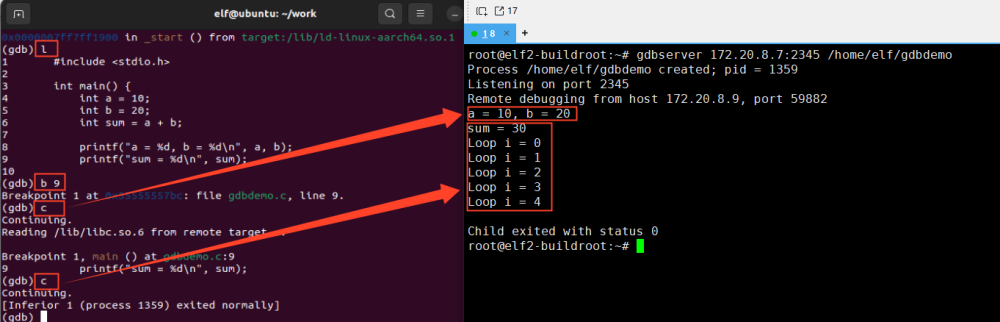
root@elf2-buildroot:~# cp /mnt/udisk/gdbdemo /home/elf6. 设置开发板IP和端口号
root@elf2-buildroot:~# gdbserver 172.20.8.7:2345 /home/elf/gdbdemo
Process /home/elf/gdbdemo created; pid = 1314
Listening on port 2345
7. 给虚拟机设置同网段的IP并保证可以ping通开发板IP
8. 调试
GDB工具所在路径:
ELF2-linux-source/buildroot/output/elf2_fs/host/bin/aarch64-linux-gdb
elf@ubuntu:~/work$ ./EDU/sdk/ELF2-linux-source/buildroot/output/elf2_fs/host/bin/aarch64-linux-gdb gdbdemo
GNU gdb (GDB) 12.1
Copyright (C) 2022 Free Software Foundation, Inc.
License GPLv3+: GNU GPL version 3 or later <http://gnu.org/licenses/gpl.html>
This is free software: you are free to change and redistribute it.
There is NO WARRANTY, to the extent permitted by law.
Type "show copying" and "show warranty" for details.
This GDB was configured as "--host=x86_64-pc-linux-gnu --target=aarch64-buildroot-linux-gnu".
Type "show configuration" for configuration details.
For bug reporting instructions, please see:
<https://www.gnu.org/software/gdb/bugs/>.
Find the GDB manual and other documentation resources online at:<http://www.gnu.org/software/gdb/documentation/>.
For help, type "help".
Type "apropos word" to search for commands related to "word"...
Reading symbols from gdbdemo...
(gdb) target remote 172.20.8.7:2345   //连接开发板
Remote debugging using 172.20.8.7:2345
Reading /lib/ld-linux-aarch64.so.1 from remote target...
warning: File transfers from remote targets can be slow. Use "set sysroot" to access files locally instead.
Reading /lib/ld-linux-aarch64.so.1 from remote target...
Reading symbols from target:/lib/ld-linux-aarch64.so.1...
(No debugging symbols found in target:/lib/ld-linux-aarch64.so.1)
Reading /home/elf/work/EDU/sdk/ELF2-linux-source/buildroot/output/elf2_fs/host/lib/debug/.build-id/01/bd8db25550e790a84285a6377baa031748d93c.debug from remote target...
0x0000007ff7ff1900 in _start () from target:/lib/ld-linux-aarch64.so.1
(gdb)
此时就可以根据需求进行调试了,下面是几个常用的命令
(1)l:列出所有源代码
(2)b:设置断点
(3)c:运行到断点处
(4)s:单步运行执行
(5)n:单步执行,但是step会进入函数里面,但是next不会
(6)p a:打印a这个变量的值
(7)q:退出,输入此命令则开发板上的gdbserver也退出
下面以具体示例介绍参数的使用方法。
(gdb) l   //列出源代码1
#include<stdio.h>
2
3int main() {
4    int a = 10;
5    int b = 20;
6    int sum = a + b;
7
8    printf("a = %d, b = %d\n", a, b);
9    printf("sum = %d\n", sum);
10
(gdb) b 9  //在第9行设置断点
Breakpoint 1 at 0x55555557d0: file gdbdemo.c, line 9.
(gdb) c  // 继续执行程序,直到遇到断点,此时终端打印a = 10, b = 20
Continuing.
Reading /lib/libc.so.6 from remote target...
Breakpoint 1, main () at gdbdemo.c:9
9    printf("sum = %d\n", sum);
(gdb) c  //从当前断点继续执行到程序结束。
Continuing.
[Inferior 1 (process 1367) exited normally]
(gdb)