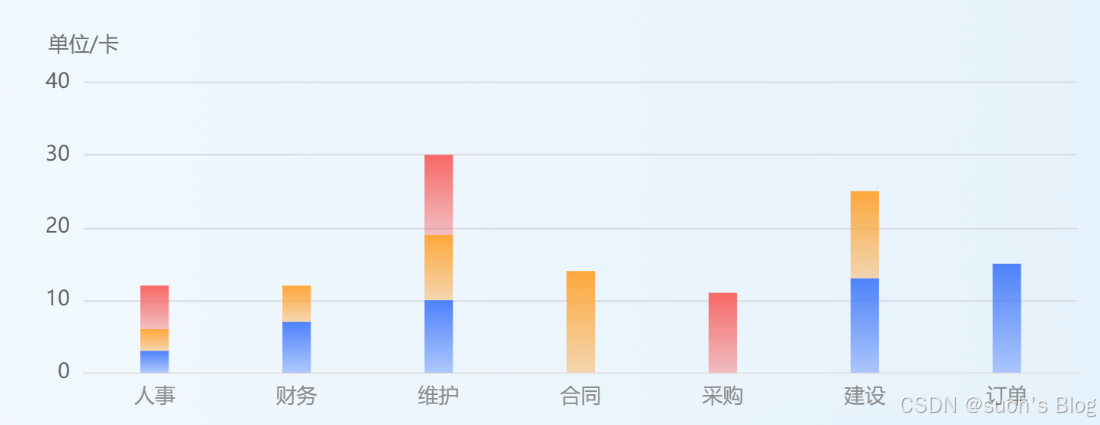
vue3中实现渐变三层柱状图
效果:
假数据标注在代码里,自行放开查看效果
组件 barEchart.vue
<script setup>
import { ref } from 'vue';
import * as echarts from 'echarts';const props = defineProps({id: {type: String,default: ''},width: {type: String,default: '100%'},height: {type: String,default: '230px'},data: {type: Array,default: () => {}}
})
// 生成渐变色
const basicColors = [['#F76866 ', 'rgba(247, 104, 102, 0.4)'],['#FEA73B ', 'rgba(254, 167, 59, 0.4)'],['#4E82FB ', 'rgba(78, 130, 251, 0.4)'],
]
function genLinearGradient(colors) {let color = {type: 'linear',x: 0,y: 0,x2: 0,y2: 1,colorStops: [{offset: 0,color: colors[0] // 0%处的颜色},{offset: 1,color: colors[1] // 100%处的颜色}],global: false}return color;
}
const option = ref({grid: {left: '5%',right: '1%',bottom: '3%',top: '15%',containLabel: true},tooltip: {trigger: 'axis',show: true},xAxis: {type: 'category',data: [],axisLabel: {//坐标轴字体颜色textStyle: {color: '#8C8C8C'}},axisLine: {lineStyle: {color: '#e5e5e5'}},axisTick: {//y轴刻度线show: false},splitLine: {//网格show: false}},yAxis: {type: 'value',boundaryGap: ['0%', '20%'],name: "单位/卡",axisLabel: {//坐标轴字体颜色textStyle: {color: 'rgb(0,0,0,0.6)'}},axisLine: {show: false},axisTick: {//y轴刻度线show: false},splitLine: {//网格show: true,lineStyle: {color: '#dadde4',}}},series: [{type: 'bar',name: '',stack: 'sum',color: '#00BFBC',barMaxWidth: '20%', //柱子宽度itemStyle: {color: genLinearGradient(basicColors[2]),},data: []},{type: 'bar',name: '',stack: 'sum',color: '#00BFBC',barMaxWidth: '20%', //柱子宽度itemStyle: {color: genLinearGradient(basicColors[1]),},data: []},{type: 'bar',name: '',stack: 'sum',barMaxWidth: '20%', //柱子宽度itemStyle: {color: genLinearGradient(basicColors[0]),},data: []},]
})
const initChart = () => {const chartDom = document.getElementById(props.id);if (!chartDom) return;const myChart = echarts.init(chartDom);option.value.xAxis.data = props.data.row //["人事","财务","维护","合同","采购","建设","订单"]// [//    { value: 45, name: "华为", icon: 'icon_hw.png' },//    { value: 40, name: "电信", icon: 'icon_dx.png' },//    { value: 35, name: "联通", icon: 'icon_lt.png' },//]option.value.series[0].data = props.data.series[0].dataoption.value.series[1].data = props.data.series[1].dataoption.value.series[2].data = props.data.series[2].dataoption.value.series[0].name = props.data.series[0].nameoption.value.series[1].name = props.data.series[1].nameoption.value.series[2].name = props.data.series[2].namemyChart.setOption(option.value);// 响应式调整window.addEventListener('resize', function () {myChart.resize();});
};
watch(() => props.data, (data) => {if (Object.keys(data).length === 0) returninitChart()
},{immediate: true})
</script><template><div><div :id="props.id" :style="{ width: props.width, height: props.height }"></div></div>
</template><style scoped lang=scss></style>
在页面中直接引入即可