Kubernetes:控制器 - HPA
1、介绍HPA
在前面的学习中我们使用用一个kubectl scale命令可以来实现 Pod 的扩缩容功能,但是这个毕竟是完全手动操作的,要应对线上的各种复杂情况,我们需要能够做到自动化去感知业务,来自动进行扩缩容。为此,Kubernetes 也为我们提供了这样的一个资源对象:Horizontal Pod Autoscaling(Pod 水平自动伸缩),简称HPA,HPA 通过监控分析一些控制器控制的所有 Pod 的负载变化情况来确定是否需要调整 Pod 的副本数量,这是 HPA 最基本的原理:
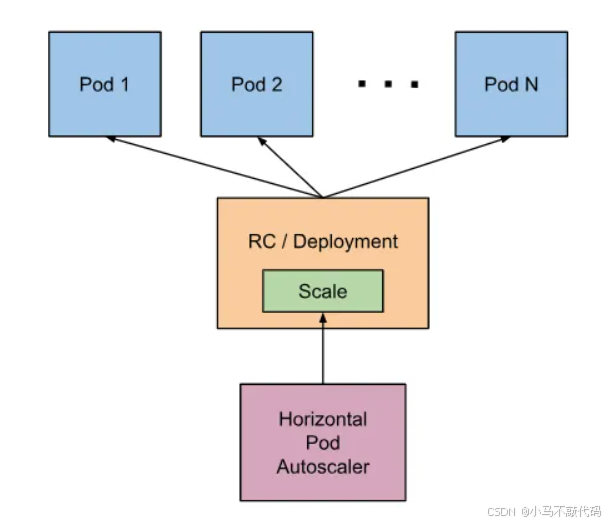
我们可以简单的通过kubectl autoscale命令来创建一个 HPA 资源对象,HPA Controller默认30s轮询一次(可通过kube-controller-manager的–horizontal-pod-autoscaler-sync-period参数进行设置),查询指定的资源中的 Pod 资源使用率,并且与创建时设定的值和指标做对比,从而实现自动伸缩的功能。
Metrics Server
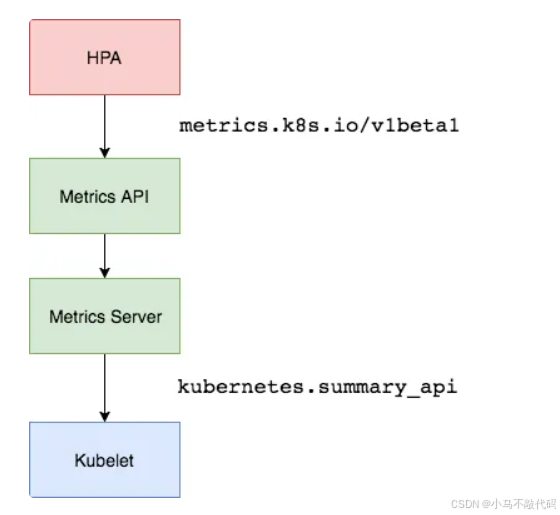
在 HPA 的第一个版本中,我们需要Heapster提供 CPU 和内存指标,在 HPA v2 过后就需要安装 Metrcis Server 了,Metrics Server可以通过标准的 Kubernetes API 把监控数据暴露出来,有了Metrics Server之后,我们就完全可以通过标准的 Kubernetes API 来访问我们想要获取的监控数据了:
https://10.96.0.1/apis/metrics.k8s.io/v1beta1/namespaces//pods/
比如当我们访问上面的 API 的时候,我们就可以获取到该 Pod 的资源数据,这些数据其实是来自于 kubelet 的Summary API采集而来的。不过需要说明的是我们这里可以通过标准的 API 来获取资源监控数据,并不是因为Metrics Server就是 APIServer 的一部分,而是通过 Kubernetes 提供的Aggregator汇聚插件来实现的,是独立于 APIServer 之外运行的。
聚合 API
Aggregator允许开发人员编写一个自己的服务,把这个服务注册到 Kubernetes 的 APIServer 里面去,这样我们就可以像原生的 APIServer 提供的 API 使用自己的 API 了,我们把自己的服务运行在 Kubernetes 集群里面,然后 Kubernetes 的Aggregator通过 Service 名称就可以转发到我们自己写的 Service 里面去了。这样这个聚合层就带来了很多好处:
● 增加了 API 的扩展性,开发人员可以编写自己的 API 服务来暴露他们想要的 API。
● 丰富了 API,核心 kubernetes 团队阻止了很多新的 API 提案,通过允许开发人员将他们的 API 作为单独的服务公开,这样就无须社区繁杂的审查了。
● 开发分阶段实验性 API,新的 API 可以在单独的聚合服务中开发,当它稳定之后,在合并会 APIServer 就很容易了。
● 确保新 API 遵循 Kubernetes 约定,如果没有这里提出的机制,社区成员可能会被迫推出自己的东西,这样很可能造成社区成员和社区约定不一致
2、MetricsServer安装
所以现在我们要使用 HPA,就需要在集群中安装Metrics Server服务,要安装Metrics Server就需要开启Aggregator,因为Metrics Server就是通过该代理进行扩展的,不过我们集群是通过 Kubeadm 搭建的,默认已经开启了,如果是二进制方式安装的集群,需要单独配置 kube-apsierver 添加如下所示的参数:
--requestheader-client-ca-file=<path to aggregator CA cert>
--requestheader-allowed-names=aggregator
--requestheader-extra-headers-prefix=X-Remote-Extra-
--requestheader-group-headers=X-Remote-Group
--requestheader-username-headers=X-Remote-User
--proxy-client-cert-file=<path to aggregator proxy cert>
--proxy-client-key-file=<path to aggregator proxy key>
如果kube-proxy没有和 APIServer 运行在同一台主机上,那么需要确保启用了如下 kube-apsierver 的参数:
--enable-aggregator-routing=true
对于这些证书的生成方式,我们可以查看官方文档:https://github.com/kubernetes-sigs/apiserver-builder-alpha/blob/master/docs/concepts/auth.md。
正式安装(即使是通过kubeadm部署的集群也要安装metricsServer)
Aggregator聚合层启动完成后,就可以来安装Metrics Server了,我们可以获取该仓库的官方安装资源清单:
# 官方仓库地址:https://github.com/kubernetes-sigs/metrics-server
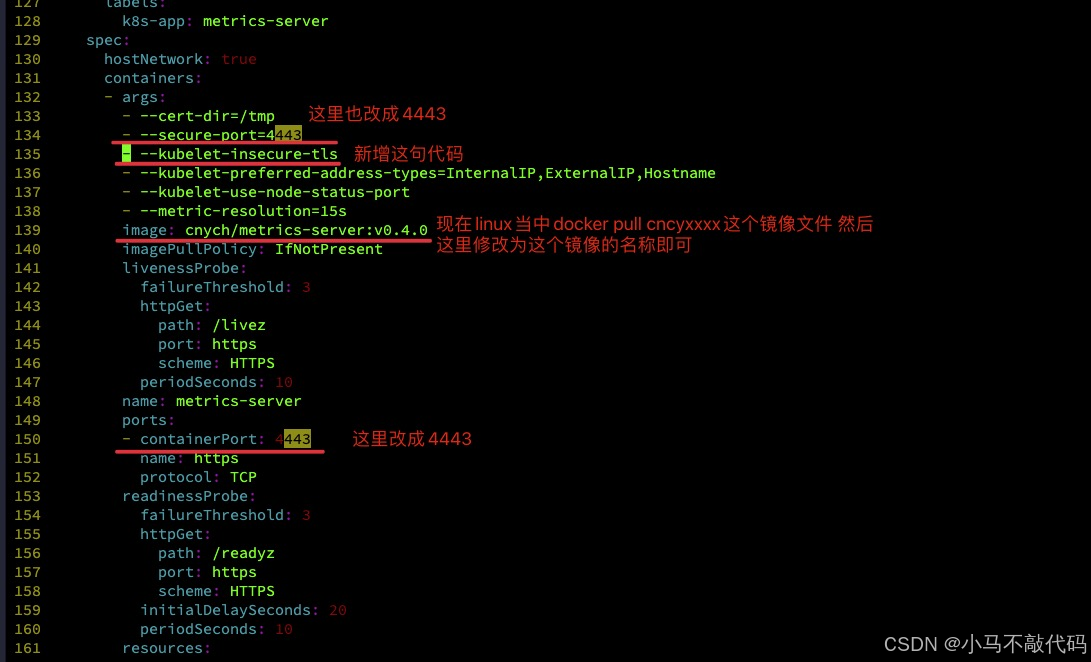
$ wget https://github.com/kubernetes-sigs/metrics-server/releases/download/v0.4.0/components.yaml
需要修改一下components.yaml资源清单:
然后就是执行命令安装了:
kubectl apply -f components.yaml
kubectl get pods -n kube-system -l k8s-app=metrics-server
这里可以看一下 只要是Running跑起来就ok的:
[root@master1 my-yaml-file]# kubectl get pods -n kube-system -l k8s-app=metrics-server
NAME                            READY   STATUS    RESTARTS   AGE
metrics-server-5d4c7d79-ptmjd   1/1     Running   0          9h
然后查看一下pod的日志 执行命令kubectl logs -f metrics-server-5d4c7d79-ptmjd -n kube-system:
[root@master1 my-yaml-file]# kubectl logs -f metrics-server-5d4c7d79-ptmjd -n kube-system
I0423 02:39:38.157810       1 serving.go:325] Generated self-signed cert (/tmp/apiserver.crt, /tmp/apiserver.key)
E0423 02:39:38.776388       1 pathrecorder.go:107] registered "/metrics" from goroutine 1 [running]:
runtime/debug.Stack(0x1942e80, 0xc0003f62a0, 0x1bb58b5)/usr/local/go/src/runtime/debug/stack.go:24 +0x9d
k8s.io/apiserver/pkg/server/mux.(*PathRecorderMux).trackCallers(0xc0001d7420, 0x1bb58b5, 0x8)/go/pkg/mod/k8s.io/apiserver@v0.19.2/pkg/server/mux/pathrecorder.go:109 +0x86
k8s.io/apiserver/pkg/server/mux.(*PathRecorderMux).Handle(0xc0001d7420, 0x1bb58b5, 0x8, 0x1e96f00, 0xc0003f7c80)/go/pkg/mod/k8s.io/apiserver@v0.19.2/pkg/server/mux/pathrecorder.go:173 +0x84
k8s.io/apiserver/pkg/server/routes.MetricsWithReset.Install(0xc0001d7420)/go/pkg/mod/k8s.io/apiserver@v0.19.2/pkg/server/routes/metrics.go:43 +0x5d
k8s.io/apiserver/pkg/server.installAPI(0xc00000a1e0, 0xc000535680)/go/pkg/mod/k8s.io/apiserver@v0.19.2/pkg/server/config.go:711 +0x6c
k8s.io/apiserver/pkg/server.completedConfig.New(0xc000535680, 0x1f099c0, 0xc00053f4a0, 0x1bbdb5a, 0xe, 0x1ef29e0, 0x2cef248, 0x0, 0x0, 0x0)/go/pkg/mod/k8s.io/apiserver@v0.19.2/pkg/server/config.go:657 +0xb45
sigs.k8s.io/metrics-server/pkg/server.Config.Complete(0xc000535680, 0xc0003a98c0, 0xc00052e240, 0x37e11d600, 0x324a9a700, 0x0, 0x0, 0x37e11d600)/go/src/sigs.k8s.io/metrics-server/pkg/server/config.go:52 +0x312
sigs.k8s.io/metrics-server/cmd/metrics-server/app.runCommand(0xc0000a6630, 0xc0001ae420, 0x0, 0x0)/go/src/sigs.k8s.io/metrics-server/cmd/metrics-server/app/start.go:66 +0x157
sigs.k8s.io/metrics-server/cmd/metrics-server/app.NewMetricsServerCommand.func1(0xc000497b80, 0xc000352f00, 0x0, 0x6, 0x0, 0x0)/go/src/sigs.k8s.io/metrics-server/cmd/metrics-server/app/start.go:37 +0x33
github.com/spf13/cobra.(*Command).execute(0xc000497b80, 0xc000130010, 0x6, 0x6, 0xc000497b80, 0xc000130010)/go/pkg/mod/github.com/spf13/cobra@v1.0.0/command.go:842 +0x453
github.com/spf13/cobra.(*Command).ExecuteC(0xc000497b80, 0xc00012a120, 0x0, 0x0)/go/pkg/mod/github.com/spf13/cobra@v1.0.0/command.go:950 +0x349
github.com/spf13/cobra.(*Command).Execute(...)/go/pkg/mod/github.com/spf13/cobra@v1.0.0/command.go:887
main.main()/go/src/sigs.k8s.io/metrics-server/cmd/metrics-server/metrics-server.go:38 +0xae
I0423 02:39:38.903029       1 secure_serving.go:197] Serving securely on [::]:4443
I0423 02:39:38.903070       1 requestheader_controller.go:169] Starting RequestHeaderAuthRequestController
I0423 02:39:38.903078       1 shared_informer.go:240] Waiting for caches to sync for RequestHeaderAuthRequestController
I0423 02:39:38.903098       1 dynamic_serving_content.go:130] Starting serving-cert::/tmp/apiserver.crt::/tmp/apiserver.key
I0423 02:39:38.903169       1 tlsconfig.go:240] Starting DynamicServingCertificateController
I0423 02:39:38.904874       1 configmap_cafile_content.go:202] Starting client-ca::kube-system::extension-apiserver-authentication::client-ca-file
I0423 02:39:38.904890       1 shared_informer.go:240] Waiting for caches to sync for client-ca::kube-system::extension-apiserver-authentication::client-ca-file
I0423 02:39:38.904911       1 configmap_cafile_content.go:202] Starting client-ca::kube-system::extension-apiserver-authentication::requestheader-client-ca-file
I0423 02:39:38.904915       1 shared_informer.go:240] Waiting for caches to sync for client-ca::kube-system::extension-apiserver-authentication::requestheader-client-ca-file
I0423 02:39:39.003305       1 shared_informer.go:247] Caches are synced for RequestHeaderAuthRequestController
I0423 02:39:39.004950       1 shared_informer.go:247] Caches are synced for client-ca::kube-system::extension-apiserver-authentication::requestheader-client-ca-file
I0423 02:39:39.004980       1 shared_informer.go:247] Caches are synced for client-ca::kube-system::extension-apiserver-authentication::client-ca-file
只要是日志里面没有报错 就是ok的!
[root@master1 my-yaml-file]# kubectl get apiservice | grep metrics
v1beta1.metrics.k8s.io                 kube-system/metrics-server   True        9h
这个时候就可以测试了 执行命令:
[root@master1 ~]# kubectl top nodes
NAME      CPU(cores)   CPU%   MEMORY(bytes)   MEMORY%
master1   192m         9%     1977Mi          56%
node1     167m         8%     1756Mi          50%
如果出现结果 那就说明一切正常 安装成功了!!!
3、HPA实战(基于cpu)
现在我们用 Deployment 来创建一个 Nginx Pod,然后利用HPA来进行自动扩缩容。资源清单如下所示:(hpa-demo.yaml)
apiVersion: apps/v1
kind: Deployment
metadata:name: hpa-demo
spec:selector:matchLabels:app: nginxtemplate:metadata:labels:app: nginxspec:containers:- name: nginximage: nginxports:- containerPort: 80
然后直接创建 Deployment:
$ kubectl apply -f hpa-demo.yaml
deployment.apps/hpa-demo created
$ kubectl get pods -l app=nginx
NAME                        READY   STATUS    RESTARTS   AGE
hpa-demo-85ff79dd56-pz8th   1/1     Running   0          21s
现在我们来创建一个HPA资源对象,可以使用kubectl autoscale命令来创建:
$ kubectl autoscale deployment hpa-demo --cpu-percent=10 --min=1 --max=10
horizontalpodautoscaler.autoscaling/hpa-demo autoscaled
$ kubectl get hpa
NAME       REFERENCE             TARGETS         MINPODS   MAXPODS   REPLICAS   AGE
hpa-demo   Deployment/hpa-demo   <unknown>/10%   1         10        0          6s
此命令创建了一个关联资源 hpa-demo 的 HPA,最小的 Pod 副本数为1,最大为10。HPA 会根据设定的 cpu 使用率(10%)动态的增加或者减少 Pod 数量。
当然我们依然还是可以通过创建 YAML 文件的形式来创建 HPA 资源对象。如果我们不知道怎么编写的话,可以查看上面命令行创建的HPA的YAML文件:
$ kubectl get hpa hpa-demo -o yaml
apiVersion: autoscaling/v1
kind: HorizontalPodAutoscaler
metadata:annotations:autoscaling.alpha.kubernetes.io/conditions: '[{"type":"AbleToScale","status":"True","lastTransitionTime":"2020-11-07T10:02:51Z","reason":"SucceededGetScale","message":"theHPA controller was able to get the target''s current scale"},{"type":"ScalingActive","status":"False","lastTransitionTime":"2020-11-07T10:02:51Z","reason":"FailedGetResourceMetric","message":"theHPA was unable to compute the replica count: missing request for cpu"}]'creationTimestamp: "2020-11-07T10:02:35Z"managedFields:- apiVersion: autoscaling/v1fieldsType: FieldsV1fieldsV1:f:spec:f:maxReplicas: {}f:minReplicas: {}f:scaleTargetRef:f:apiVersion: {}f:kind: {}f:name: {}f:targetCPUUtilizationPercentage: {}manager: kubectloperation: Updatetime: "2020-11-07T10:02:35Z"- apiVersion: autoscaling/v1fieldsType: FieldsV1fieldsV1:f:metadata:f:annotations:.: {}f:autoscaling.alpha.kubernetes.io/conditions: {}f:status:f:currentReplicas: {}manager: kube-controller-manageroperation: Updatetime: "2020-11-07T10:02:51Z"name: hpa-demonamespace: defaultresourceVersion: "4219341"selfLink: /apis/autoscaling/v1/namespaces/default/horizontalpodautoscalers/hpa-demouid: 030bc938-5dda-4b95-b335-78e12a39a093
spec:maxReplicas: 10minReplicas: 1scaleTargetRef:apiVersion: apps/v1kind: Deploymentname: hpa-demotargetCPUUtilizationPercentage: 10
status:currentReplicas: 1desiredReplicas: 0
然后我们可以根据上面的 YAML 文件就可以自己来创建一个基于 YAML 的 HPA 描述文件了。但是我们发现上面信息里面出现了一些 Fail 信息,我们来查看下这个 HPA 对象的信息:
$ kubectl describe hpa hpa-demo
Name:                                                  hpa-demo
Namespace:                                             default
Labels:                                                <none>
Annotations:                                           <none>
CreationTimestamp:                                     Sat, 07 Nov 2020 18:02:35 +0800
Reference:                                             Deployment/hpa-demo
Metrics:                                               ( current / target )resource cpu on pods  (as a percentage of request):  <unknown> / 10%
Min replicas:                                          1
Max replicas:                                          10
Deployment pods:                                       1 current / 0 desired
Conditions:Type           Status  Reason                   Message----           ------  ------                   -------AbleToScale    True    SucceededGetScale        the HPA controller was able to get the target's current scaleScalingActive  False   FailedGetResourceMetric  the HPA was unable to compute the replica count: missing request for cpu
Events:Type     Reason                        Age               From                       Message----     ------                        ----              ----                       -------Warning  FailedGetResourceMetric       8s (x4 over 54s)  horizontal-pod-autoscaler  missing request for cpuWarning  FailedComputeMetricsReplicas  8s (x4 over 54s)  horizontal-pod-autoscaler  invalid metrics (1 invalid out of 1), first error is: failed to get cpu utilization: missing request for cpu
我们可以看到上面的事件信息里面出现了failed to get cpu utilization: missing request for cpu这样的错误信息。这是因为我们上面创建的 Pod 对象没有添加 request 资源声明,这样导致 HPA 读取不到 CPU 指标信息,所以如果要想让 HPA 生效,对应的 Pod 资源必须添加 requests 资源声明,更新我们的资源清单文件:
apiVersion: apps/v1
kind: Deployment
metadata:name: hpa-demo
spec:selector:matchLabels:app: nginxtemplate:metadata:labels:app: nginxspec:containers:- name: nginximage: nginxports:- containerPort: 80resources:requests:memory: 50Micpu: 50m
然后重新更新 Deployment,重新创建 HPA 对象:
$ kubectl apply -f hpa.yaml
deployment.apps/hpa-demo configured
$ kubectl get pods -o wide -l app=nginx
NAME                        READY   STATUS        RESTARTS   AGE   IP             NODE    NOMINATED NODE   READINESS GATES
hpa-demo-6b4467b546-th974   1/1     Running       0          31s   10.244.1.113   node1   <none>           <none>
$ kubectl delete hpa hpa-demo
horizontalpodautoscaler.autoscaling "hpa-demo" deleted
$ kubectl autoscale deployment hpa-demo --cpu-percent=10 --min=1 --max=10
horizontalpodautoscaler.autoscaling/hpa-demo autoscaled
$ kubectl describe hpa hpa-demo
Name:                                                  hpa-demo
Namespace:                                             default
Labels:                                                <none>
Annotations:                                           <none>
CreationTimestamp:                                     Sat, 07 Nov 2020 18:05:22 +0800
Reference:                                             Deployment/hpa-demo
Metrics:                                               ( current / target )resource cpu on pods  (as a percentage of request):  0% (0) / 10%
Min replicas:                                          1
Max replicas:                                          10
Deployment pods:                                       1 current / 1 desired
Conditions:Type            Status  Reason               Message----            ------  ------               -------AbleToScale     True    ScaleDownStabilized  recent recommendations were higher than current one, applying the highest recent recommendationScalingActive   True    ValidMetricFound     the HPA was able to successfully calculate a replica count from cpu resource utilization (percentage of request)ScalingLimited  False   DesiredWithinRange   the desired count is within the acceptable range
Events:           <none>
$ kubectl get hpa
NAME       REFERENCE             TARGETS   MINPODS   MAXPODS   REPLICAS   AGE
hpa-demo   Deployment/hpa-demo   0%/10%    1         10        1          36s
现在可以看到 HPA 资源对象已经正常了,现在我们来增大负载进行测试,我们来创建一个 busybox 的 Pod,并且循环访问上面创建的 Pod:
# 其中10.244.1.113就是pod在集群内的地址
$ kubectl run -it --image busybox test-hpa --restart=Never --rm /bin/sh
If you don't see a command prompt, try pressing enter.
/ # while true; do wget -q -O- http://10.244.1.113; done
下图可以看到,HPA 已经开始工作:
#$ kubectl get hpa
NAME       REFERENCE             TARGETS    MINPODS   MAXPODS   REPLICAS   AGE
hpa-demo   Deployment/hpa-demo   320%/10%   1         10        1          2m7s
$ kubectl get pods -l app=nginx --watch
NAME                        READY   STATUS              RESTARTS   AGE
hpa-demo-69968bb59f-8hjnn   1/1     Running             0          22s
hpa-demo-69968bb59f-9ss9f   1/1     Running             0          22s
hpa-demo-69968bb59f-bllsd   1/1     Running             0          22s
hpa-demo-69968bb59f-lnh8k   1/1     Running             0          37s
hpa-demo-69968bb59f-r8zfh   1/1     Running             0          22s
hpa-demo-69968bb59f-twtdp   1/1     Running             0          6m43s
hpa-demo-69968bb59f-w792g   1/1     Running             0          37s
hpa-demo-69968bb59f-zlxkp   1/1     Running             0          37s
hpa-demo-69968bb59f-znp6q   0/1     ContainerCreating   0          6s
hpa-demo-69968bb59f-ztnvx   1/1     Running             0          6s
我们可以看到已经自动拉起了很多新的 Pod,最后定格在了我们上面设置的 10 个 Pod,同时查看资源 hpa-demo 的副本数量,副本数量已经从原来的1变成了10个:
$ kubectl get deployment hpa-demo
NAME       READY   UP-TO-DATE   AVAILABLE   AGE
hpa-demo   10/10   10           10          17m
查看 HPA 资源的对象了解工作过程:
$ kubectl describe hpa hpa-demo
Name:                                                  hpa-demo
Namespace:                                             default
Labels:                                                <none>
Annotations:                                           <none>
CreationTimestamp:                                     Sat, 07 Nov 2020 18:05:22 +0800
Reference:                                             Deployment/hpa-demo
Metrics:                                               ( current / target )resource cpu on pods  (as a percentage of request):  320% (160m) / 10%
Min replicas:                                          1
Max replicas:                                          10
Deployment pods:                                       8 current / 10 desired
Conditions:Type            Status  Reason            Message----            ------  ------            -------AbleToScale     True    SucceededRescale  the HPA controller was able to update the target scale to 10ScalingActive   True    ValidMetricFound  the HPA was able to successfully calculate a replica count from cpu resource utilization (percentage of request)ScalingLimited  True    TooManyReplicas   the desired replica count is more than the maximum replica count
Events:Type    Reason             Age   From                       Message----    ------             ----  ----                       -------Normal  SuccessfulRescale  46s   horizontal-pod-autoscaler  New size: 4; reason: cpu resource utilization (percentage of request) above targetNormal  SuccessfulRescale  30s   horizontal-pod-autoscaler  New size: 8; reason: cpu resource utilization (percentage of request) above targetNormal  SuccessfulRescale  14s   horizontal-pod-autoscaler  New size: 10; reason: cpu resource utilization (percentage of request) above target
同样的这个时候我们来关掉 busybox 来减少负载,然后等待一段时间观察下 HPA 和 Deployment 对象:
$ kubectl get hpa
NAME       REFERENCE             TARGETS   MINPODS   MAXPODS   REPLICAS   AGE
hpa-demo   Deployment/hpa-demo   0%/10%    1         10        1          14m
$ kubectl get deployment hpa-demo
NAME       READY   UP-TO-DATE   AVAILABLE   AGE
hpa-demo   1/1     1            1           24m
缩放间隙
从 Kubernetesv1.12版本开始我们可以通过设置kube-controller-manager组件的–horizontal-pod-autoscaler-downscale-stabilization参数来设置一个持续时间,用于指定在当前操作完成后,HPA必须等待多长时间才能执行另一次缩放操作。默认为5分钟,也就是默认需要等待5分钟后才会开始自动缩放。
可以看到副本数量已经由 10 变为 1,当前我们只是演示了 CPU 使用率这一个指标,在后面我们还会学习到根据自定义的监控指标来自动对 Pod 进行扩缩容。
hpa-demo-cpu.yaml
# 作用:hpa自动扩容测试需要用到的Deployment  另外如何启动一个基于cpu的hpa请参考博客文章或者看手册http://blog.myidns.com/index.php/archives/3030/
# 前提是先安装metrics服务
apiVersion: apps/v1
kind: Deployment
metadata:name: hpa-demo1
spec:selector:matchLabels:app: nginx-hpatemplate:metadata:labels:app: nginx-hpaspec:containers:- name: nginx-hpaimage: nginxports:- containerPort: 80resources:                        # HPA 读取不到 CPU 指标信息 就是因为没有配置resources 所以这里需要配置  配置上了Hpa当中就可以获取到Pod资源和node节点资源requests:memory: 10Micpu: 10m
4、HPA实战(基于内存)
要使用基于内存或者自定义指标进行扩缩容(现在的版本都必须依赖 metrics-server 这个项目)。现在我们再用 Deployment 来创建一个 Nginx Pod,然后利用 HPA 来进行自动扩缩容。资源清单如下所示:(hpa-mem-demo.yaml)
apiVersion: apps/v1
kind: Deployment
metadata:name: hpa-mem-demo
spec:selector:matchLabels:app: nginxtemplate:metadata:labels:app: nginxspec:volumes:- name: increase-mem-scriptconfigMap:name: increase-mem-configcontainers:- name: nginximage: nginxports:- containerPort: 80volumeMounts:- name: increase-mem-scriptmountPath: /etc/scriptresources:requests:memory: 50Micpu: 50msecurityContext:privileged: true
这里和前面普通的应用有一些区别,我们将一个名为increase-mem-config的 ConfigMap 资源对象挂载到了容器中,该配置文件是用于后面增加容器内存占用的脚本,配置文件如下所示:(increase-mem-cm.yaml)
apiVersion: v1
kind: ConfigMap
metadata:name: increase-mem-config
data:increase-mem.sh: |#!/bin/bash  mkdir /tmp/memory  mount -t tmpfs -o size=40M tmpfs /tmp/memory  dd if=/dev/zero of=/tmp/memory/block  sleep 60 rm /tmp/memory/block  umount /tmp/memory  rmdir /tmp/memory
由于这里增加内存的脚本需要使用到mount命令,这需要声明为特权模式,所以我们添加了securityContext.privileged=true这个配置。现在我们直接创建上面的资源对象即可:
$ kubectl apply -f increase-mem-cm.yaml
$ kubectl apply -f hpa-mem-demo.yaml
$ kubectl get pods -l app=nginx
NAME                            READY   STATUS    RESTARTS   AGE
hpa-mem-demo-66944b79bf-tqrn9   1/1     Running   0          35s
然后需要创建一个基于内存的 HPA 资源对象:(hpa-mem.yaml)
apiVersion: autoscaling/v2beta1
kind: HorizontalPodAutoscaler
metadata:name: nginx-hpa
spec:scaleTargetRef:apiVersion: apps/v1kind: Deploymentname: hpa-mem-demominReplicas: 1maxReplicas: 5metrics:- type: Resourceresource:name: memorytargetAverageUtilization: 60
要注意这里使用的apiVersion是autoscaling/v2beta1,然后metrics属性里面指定的是内存的配置,直接创建上面的资源对象即可:
$ kubectl apply -f hpa-mem.yaml
horizontalpodautoscaler.autoscaling/nginx-hpa created
$ kubectl get hpa
NAME        REFERENCE                 TARGETS   MINPODS   MAXPODS   REPLICAS   AGE
nginx-hpa   Deployment/hpa-mem-demo   2%/60%    1         5         1          12s
到这里证明 HPA 资源对象已经部署成功了,接下来我们对应用进行压测,将内存压上去,直接执行上面我们挂载到容器中的increase-mem.sh脚本即可:
$ kubectl exec -it hpa-mem-demo-66944b79bf-tqrn9 /bin/bash
root@hpa-mem-demo-66944b79bf-tqrn9:/# ls /etc/script/
increase-mem.sh
root@hpa-mem-demo-66944b79bf-tqrn9:/# source /etc/script/increase-mem.sh
dd: writing to '/tmp/memory/block': No space left on device
81921+0 records in
81920+0 records out
41943040 bytes (42 MB, 40 MiB) copied, 0.584029 s, 71.8 MB/s
然后打开另外一个终端观察 HPA 资源对象的变化情况:
$ kubectl get hpa
NAME        REFERENCE                 TARGETS   MINPODS   MAXPODS   REPLICAS   AGE
nginx-hpa   Deployment/hpa-mem-demo   83%/60%   1         5         1          5m3s
$ kubectl describe hpa nginx-hpa
Name:                                                     nginx-hpa
Namespace:                                                default
Labels:                                                   <none>
Annotations:                                              kubectl.kubernetes.io/last-applied-configuration:{"apiVersion":"autoscaling/v2beta1","kind":"HorizontalPodAutoscaler","metadata":{"annotations":{},"name":"nginx-hpa","namespace":"default"...
CreationTimestamp:                                        Tue, 07 Apr 2020 13:13:59 +0800
Reference:                                                Deployment/hpa-mem-demo
Metrics:                                                  ( current / target )resource memory on pods  (as a percentage of request):  3% (1740800) / 60%
Min replicas:                                             1
Max replicas:                                             5
Deployment pods:                                          2 current / 2 desired
Conditions:Type            Status  Reason               Message----            ------  ------               -------AbleToScale     True    ScaleDownStabilized  recent recommendations were higher than current one, applying the highest recent recommendationScalingActive   True    ValidMetricFound     the HPA was able to successfully calculate a replica count from memory resource utilization (percentage of request)ScalingLimited  False   DesiredWithinRange   the desired count is within the acceptable range
Events:Type     Reason                        Age                    From                       Message----     ------                        ----                   ----                       -------Warning  FailedGetResourceMetric       5m26s (x3 over 5m58s)  horizontal-pod-autoscaler  unable to get metrics for resource memory: no metrics returned from resource metrics APIWarning  FailedComputeMetricsReplicas  5m26s (x3 over 5m58s)  horizontal-pod-autoscaler  invalid metrics (1 invalid out of 1), first error is: failed to get memory utilization: unable to get metrics for resource memory: no metrics returned from resource metrics APINormal   SuccessfulRescale             77s                    horizontal-pod-autoscaler  New size: 2; reason: memory resource utilization (percentage of request) above target
$ kubectl top pod hpa-mem-demo-66944b79bf-tqrn9
NAME                            CPU(cores)   MEMORY(bytes)
hpa-mem-demo-66944b79bf-tqrn9   0m           41Mi
可以看到内存使用已经超过了我们设定的 60% 这个阈值了,HPA 资源对象也已经触发了自动扩容,变成了两个副本了:
$ kubectl get pods -l app=nginx
NAME                            READY   STATUS    RESTARTS   AGE
hpa-mem-demo-66944b79bf-8m4d9   1/1     Running   0          2m51s
hpa-mem-demo-66944b79bf-tqrn9   1/1     Running   0          8m11s
当内存释放掉后,controller-manager 默认5分钟过后会进行缩放,到这里就完成了基于内存的 HPA 操作。
hpa-demo-mem.yaml
# 作用: 生成ConfigMap
apiVersion: v1
kind: ConfigMap
metadata:name: increase-mem-config                      # ConfigMap的名称
data:increase-mem.sh: |                             # 生成的sh的名称就在这里规定了  以下是sh里面的内容#!/bin/bash  mkdir /tmp/memory  mount -t tmpfs -o size=40M tmpfs /tmp/memory  dd if=/dev/zero of=/tmp/memory/block  sleep 60 rm /tmp/memory/block  umount /tmp/memory  rmdir /tmp/memory---# 作用:hpa自动扩容测试需要用到的Deployment   这是基于内存做的一个hpa自动扩容用到的deployment的案例
apiVersion: apps/v1
kind: Deployment
metadata:name: hpa-mem-demo
spec:selector:matchLabels:app: nginx-mem                   # 这个deployment管理哪些个pod 这里的app: nginx-mem要和下边template.metadata.labels里面的app: nginx-mem保持一致template:                            # pod模版metadata:labels:app: nginx-memspec:volumes:                         # 挂载- name: increase-mem-script      # 挂载的名称  这个地方会读取configMap里面的内容和下边的volumeMounts当中的mountPath结合 将configMap当中内容以文件的形式写入到这个路径下configMap:name: increase-mem-config    # 这里会去寻找configMap名称为increase-mem-config的configMap 我们需要先创建它!在configMap的data里面我们规定了文件的名称就是increase-mem.sh 所以也就会在 /etc/script/下生成increase-mem.sh文件containers:- name: nginx-memimage: nginxports:- containerPort: 80volumeMounts:                  # 挂载呗- name: increase-mem-script    # 指明挂载的名称 这个名称increase-mem-script就会找到绑定的configMap 进而找到configMap 拿到里面的文件写到/etc/script目录下边去mountPath: /etc/script       # 表示将configMap当中的文件生成到的具体的路径位置是哪里resources:                     # 这个也是为了让hpa找到对应的内存的资源  这是必须的 在通过cpu扩容的那个地方就已经介绍过了......requests:memory: 50Micpu: 50msecurityContext:               # 由于这里增加内存的脚本需要使用到 mount 命令,这需要声明为特权模式,所以我们添加了 securityContext.privileged=true 这个配置privileged: true---
# 作用: 生成hpa  这里和通过监控cpu进行扩容的地方还不一样 这里必须通过写这么一个yaml清单配置文件来监控内存 进而进行pod的扩容
apiVersion: autoscaling/v2beta1
kind: HorizontalPodAutoscaler
metadata:name: nginx-hpa
spec:scaleTargetRef:apiVersion: apps/v1kind: Deploymentname: hpa-mem-demo                          # 绑定要监控的deployment的资源对象minReplicas: 1                                # 最小的pod数量maxReplicas: 5                                # 最大的pod数量metrics:- type: Resourceresource:name: memory                              # 声明监控的是内存targetAverageUtilization: 60              # 内存达到60%的时候进行扩容