性能测试+监控体系一站式搭建指南:从脚本设计到服务器资源全景监控
课程:B站大学
记录软件测试-性能测试学习历程、掌握前端性能测试、后端性能测试、服务端性能测试的你才是一个专业的软件测试工程师
从脚本设计到服务器资源全景监控
- 一、性能测试JMX脚本SOP流程
- 阶段1:需求分析与测试目标确认
- 阶段2:JMX脚本开发(Windows本地)
- 阶段3:脚本上传与Linux环境准备(含跨平台兼容性处理)
- 3.1 文件上传
- 3.2 Linux环境依赖检查
- 3.3 跨平台兼容性处理(核心!)
- 阶段4:JMX脚本执行(Linux非GUI模式)
- 关键工具与脚本说明
- 1. 编写启动脚本(.sh文件)
- 性能测试压力测试数据:
- excel表格性能优化前后报告:
- 压力测试服务器端监控:
- 告警规则:
- 2. 参数说明
- 3. 执行脚本
- 4. 过程监控
- 5.输出结果
- 阶段5:结果分析与报告输出
- 如何验证inluxdb容器启动成功并且成功创建数据库db0
- 如何使用本地jmeter连接influxdb并调用写入接口,将性能结果数据写入influxdb数据库db0中
- 注意事项:(已解决且遇到的问题)
- 问题1:Windows→Linux跨平台常见问题与解决方案(聚焦“转码”)
- 问题2:jmeter属性变量存储均为字符串(String)类型,后续接口需要转换为intger型,数组格式等不同数据结构
- 问题3:如何复用已存储的全局jmeter属性变(String),并且重新构造出接口指定结构和格式
- 问题4:在windows下CSV(已使用vscode转码为UTF-8)提取中文字符转义问题,比如需要批量创建商品,提取CSV中的中文字符后,jmeter中字符未展示为中文(显示的是json转义符)。
- 问题5、在windows下编写的jmx脚本可以成功运行且无报错信息,更改CSV文件编码格式(UTF-8)后,上传文件到linux下,更改csv文件路径,运行Startup_Linux.sh文件,输出报错:
- 问题6、当存在线程组A(存在登录事务(用例定义变量和csv变量均为线程变量))和线程组B(存在登录模块控制器),当程序运行到线程组B下登录模块控制器下无法使用线程组A存储变量问题?
- 三、附录:关键命令速查表
- 实践是检验真理的唯一标准
相关使用工具:jmeter+influxdb+grafana+Nginx+docker
后续补充监控行业标准以及分布式测试(jmeter代理服务器模拟多个机器)
目前脚本都是单机器(但是可以动态配置用户)
一、性能测试JMX脚本SOP流程
阶段1:需求分析与测试目标确认
- 输入:产品需求文档、接口文档、历史性能基线数据、明确的性能指标(如TPS、RT、错误率、并发用户数)。
- 关键动作:
- 与开发/产品对齐测试场景(单接口/业务流程/混合场景)、预期指标(例如“首页接口支持1000TPS,平均响应时间≤200ms,错误率<0.1%”)。
- 明确压测环境(Linux服务器IP/端口、依赖中间件、测试数据量级)、数据隔离要求(避免污染线上数据)。
- 输出:《性能测试需求确认单》(含场景、指标、环境、数据说明)。
阶段2:JMX脚本开发(Windows本地)
-
工具:JMeter(推荐5.6.3最新版本,jdk8)、插件管理器(JMeter Plugins Manager)、APIfox(辅助调试)。
-
关键步骤:
- 基础脚本搭建:配置HTTP请求(URL、方法、Headers/Body)、线程组(并发数、Ramp-Up、循环逻辑)、定时器(思考时间)、断言(状态码/关键字段)。
- 参数化与动态数据:
-
用户参数:通过“CSV Data Set Config”读取本地CSV(如name_password.csv),字段映射到请求参数(例如 n a m e , {name}, name,{password})。
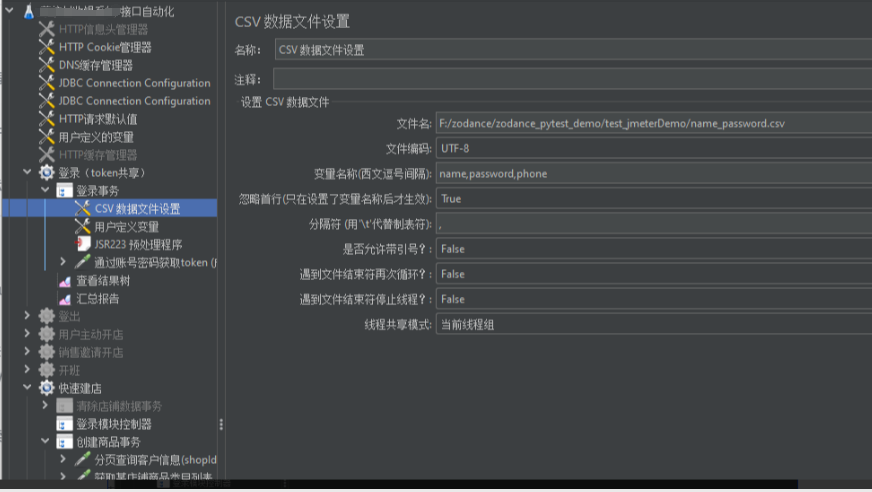
-
动态关联:用“正则表达式提取器”“JSON提取器”从上游响应提取关键值(如token、orderId),传递给下游请求,构成接口之间的参数和传递。
![[图片]](https://i-blog.csdnimg.cn/direct/523903b2c2cb42ba9f89a6593102482a.png)
- 调试与验证:本地用JMeter GUI模式运行(仅调试用!),通过“查看结果树”“聚合报告”检查请求成功性、参数传递、响应时间。
-
注意事项:
- 避免硬编码敏感信息(如密码/Token),通过配置文件或环境变量管理。
- 复杂业务场景需按真实用户路径编排请求,验证数据一致性(如订单状态流转)。
-
输出:可执行JMX脚本(如zodance_teahouses.jmx)、配套CSV数据文件(如name_password.csv)、参数说明文档(apifox预览文档)等。
阶段3:脚本上传与Linux环境准备(含跨平台兼容性处理)
3.1 文件上传
- 工具:WinSCP/Xftp(SFTP传输)。
- 动作:将JMX脚本、CSV文件、依赖JAR包(如自定义插件)上传至Linux压测机指定目录(如/root/test_jmeterDemo)。
3.2 Linux环境依赖检查
- 确认项:
- Java:java -version(需与JMeter兼容,如JMeter 5.6+需Java 8/11/17)。
- JMeter:/root/apache-jmeter-5.6/bin/jmeter -v(推荐与Windows开发环境同版本)。
- 插件:若JMX依赖特殊插件(如WebSocket/gRPC),将插件JAR包放入/root/apache-jmeter-5.6/lib/ext/。
- 安装jmeter插件
- 通过插件包管理器:
https://jmeterplugins.org/install/Install/进行安装 - 通过maven构建工具编辑打包输出jar包:
- jmeter-plugins的github仓库
https://github.com/undera/jmeter-plugins
![[图片]](https://i-blog.csdnimg.cn/direct/f9561fd1f6d74da492d9895328ec5e92.png)
- jmeter-plugins的github仓库
- 通过插件包管理器:
3.3 跨平台兼容性处理(核心!)
- 问题场景:Windows生成的JMX/CVS文件可能存在换行符(CRLF→LF)、编码(GBK→UTF-8)、中文/空格异常,需在Linux执行前转换。
- 处理步骤:
- 换行符转换(CRLF→LF):
- 安装工具(若无):
yum install dos2unix -y(CentOS)或apt-get install dos2unix -y(Ubuntu)。 - 执行转换:对JMX和CSV文件运行
dos2unix 文件名(如dos2unix login.jmx,dos2unix Startup_Linux.sh)。 - 替代方案(无dos2unix时):
sed -i 's/\r$//' 文件名(删除所有行尾\r)。
- 编码转换(非UTF-8→UTF-8):
- 检查编码:file 登录.jmx(若显示GBK/ISO-8859等非UTF-8,需转换)。
- 执行转换:
iconv -f GBK -t UTF-8 原文件.jmx -o 新文件_utf8.jmx,确认无误后替换原文件(如 mv 新文件_utf8.jmx 原文件.jmx)。
- 空格/特殊字符清理(可选):
- 清理CSV字段多余空格(如逗号周围空格):
sed -i 's/ *, */,/g' test_user.csv。
- 验证处理结果:
- 检查换行符:
cat -v 登录.jmx | head -n 5(无^M符号即正常)。 - 检查编码:
file 登录.jmx(应显示UTF-8)。 - 检查中文:
less 登录.jmx或vim 登录.jmx(中文正常显示,无乱码)。
- 输出:Linux压测机上的兼容性处理后的脚本目录(含JMX、CSV、JAR插件),环境验证通过(Java/JMeter可执行,文件无编码/换行符问题)。
此步骤影响linux上是否执行脚本成功,需要转码,目前sh文件和jmx文件均是UTF-8(不带BOM)编码格式
阶段4:JMX脚本执行(Linux非GUI模式)
关键工具与脚本说明
- 核心工具:JMeter命令行(路径:
/root/apache-jmeter-5.6.3/bin/jmeter,根据实际安装路径调整)。 - 执行模式:非GUI模式(必须,避免资源消耗且支持长时间压测)。
- 脚本功能:通过sh脚本(
.sh文件)动态生成多并发场景的压测任务,执行JMX脚本并输出结果到指定目录。
1. 编写启动脚本(.sh文件)
目前可以动态更改线程数,后续补充动态参数(Ramp-Up时间,循环次数,持续时间、启动延迟等参数)
sh文件中指定生成测试报告目录路径,nginx指定该/var/www/TestReport路径,故通过域名或者IP地址访问多个版本报告。
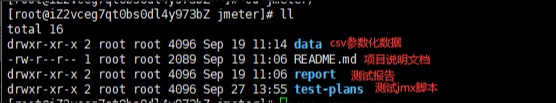
服务端项目结构:
![[图片]](https://i-blog.csdnimg.cn/direct/65817f7f11444a7da9b4b70fffd77540.png)
性能测试项目结构:
测试jmx脚本:
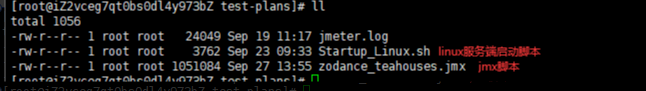
Startup_Linux.sh配置:
#!/bin/bash#---FUNCTION-----------------------------------------------------------------------------------------------------------
#   NAME:  性能自动化
#   DESCRIPTION:  脚本入口函数,自动化执行JMeter压测并生成报告,报告统一存放到 /var/www/TestReport/
#----------------------------------------------------------------------------------------------------------------------function __echo_info() {echo "$(date +'%F %T') - [INFO] : $*"
}run() {ls -l# ======================# JMeter 环境配置# ======================export PATH=$PATH:/root/apache-jmeter-5.6.3/binexport jmx_template="zodance_teahouses"         # 压测 jmx 模板名称(不含后缀)export suffix=".jmx"export jmx_template_filename="$jmx_template${suffix}"export os_type="Linux"# ======================# 定义测试报告输出根目录(关键修改:输出到 /var/www/TestReport)# ======================export TEST_REPORT_BASE_DIR="/var/www/TestReport"# 确保报告根目录存在(如果不存在则自动创建)mkdir -p "${TEST_REPORT_BASE_DIR}"__echo_info "---------> 自动化压测开始 <---------"# 清理旧的 TestReport(如果之前是在当前目录下,这里可省略或改成清理 /var/www/TestReport 下的内容)# 如果你希望每次运行都清空 /var/www/TestReport 下的内容,可以使用:# rm -rf "${TEST_REPORT_BASE_DIR}"/*# 但建议保留历史报告,所以这里不做删除,如需清理请按需手动或添加逻辑# ======================# 压测并发数列表# ======================thread_number_array=(1 3)# 可按需调整为:(100 200 500 1000 2000 ...) 或其它并发数for num in "${thread_number_array[@]}"do__echo_info "当前并发数: ${num}"# 定义当前并发数对应的 jmx 和 jtl 文件名export jmx_filename="${jmx_template}_$num${suffix}"export jtl_filename="test_$num.jtl"# 复制模板 jmx 文件并重命名为带并发数的文件cp "${jmx_template_filename}" "${jmx_filename}"__echo_info "生成jmx压测脚本: ${jmx_filename}"# 替换 jmx 文件中的线程数变量 thread_num 为实际并发数 ${num}if [[ "${os_type}" == "Mac" ]]; thensed -i "" "s/thread_num/${num}/g" "${jmx_filename}"elsesed -i "s/thread_num/${num}/g" "${jmx_filename}"fi# ======================# 执行 JMeter 压测(核心修改:报告输出到 /var/www/TestReport/...)# ======================if [[ "${num}" -gt 0 ]]; then# 创建按模板和并发数分组的子目录,存放在 /var/www/TestReport/mkdir -p "${TEST_REPORT_BASE_DIR}/${jmx_template}/${num}"__echo_info "执行 JMeter 压测,报告输出到:${TEST_REPORT_BASE_DIR}/${jmx_template}/${num}"__echo_info "命令:jmeter -n -t ${jmx_filename} -l ${jtl_filename} -e -o ${TEST_REPORT_BASE_DIR}/${jmx_template}/${num}"jmeter -n -t "${jmx_filename}" -l "${jtl_filename}" -e -o "${TEST_REPORT_BASE_DIR}/${jmx_template}/${num}"else__echo_info "执行 JMeter 压测(并发数<=0),报告输出到:${TEST_REPORT_BASE_DIR}/${jmx_template}"jmeter -n -t "${jmx_filename}" -l "${jtl_filename}" -e -o "${TEST_REPORT_BASE_DIR}/${jmx_template}"fi# 清理临时文件:jmx 和 jtlrm -f "${jmx_filename}" "${jtl_filename}"done__echo_info "---------> 自动化压测全部结束 <---------"
}# 执行主函数,如果失败则退出脚本并返回错误码 1
run || exit 1
zodance_teahouses.jmx项目结构配置:
monitoring-stack监控项目结构:
![[图片]](https://i-blog.csdnimg.cn/direct/17d83eba7d7d493a8b2369b61ae04312.png)
docker-compose.yml配置:
version: '3.1'services:influxdb:image: influxdb:1.8container_name: influxdbvolumes:- ./influxdb-storage:/var/lib/influxdb- ./influxdb.conf:/etc/influxdb/influxdb.confnetworks:- monitoring-netenvironment:- INFLUXDB_DB=db0- INFLUXDB_ADMIN_USER=${INFLUXDB_USERNAME}- INFLUXDB_ADMIN_PASSWORD=${INFLUXDB_PASSWORD}grafana:image: grafana/grafana:latestcontainer_name: grafanadepends_on:- influxdb- prometheus user: "0"networks:- monitoring-netvolumes:- ./grafana-storage:/var/lib/grafana- ./grafana.ini:/etc/grafana/grafana.ini- ./grafana-provisioning/:/etc/grafana/provisioningenvironment:- GF_SECURITY_ADMIN_USER=${GRAFANA_USERNAME}- GF_SECURITY_ADMIN_PASSWORD=${GRAFANA_PASSWORD}nginx:image: nginx:latestcontainer_name: nginx-proxyports:- "443:443"- "80:80"volumes:- /var/www/TestReport:/var/www/TestReport:ro- ./nginx.conf:/etc/nginx/nginx.conf:ro- ./ssl:/etc/nginx/ssl:ronetworks:- monitoring-netdepends_on:- grafana- influxdb- prometheus - alertmanagerrestart: unless-stoppedprometheus:image: prom/prometheus:latestuser: "root"container_name: prometheusvolumes:- ./prometheus.yml:/etc/prometheus/prometheus.yml:ro- ./prometheus-data:/prometheus- ./alert.rules.yml:/etc/prometheus/alert.rules.ymlnetworks:- monitoring-netdepends_on:- node_exporterrestart: unless-stoppedenvironment:- PROMETHEUS_GLOBAL_SCRAPE_INTERVAL=15snode_exporter:image: prom/node-exporter:latest container_name: node-exporternetworks:- monitoring-netrestart: unless-stoppedalertmanager:image: prom/alertmanager:latestcontainer_name: alertmanageruser: "root"volumes:- ./alertmanager.yml:/etc/alertmanager/alertmanager.yml:ro- ./alertmanager-data:/alertmanagernetworks:- monitoring-netrestart: unless-stopped command:- '--config.file=/etc/alertmanager/alertmanager.yml'- '--storage.path=/alertmanager'networks:monitoring-net:driver: bridge
nginx.conf配置:
events {}http {log_format main '$remote_addr - $remote_user [$time_local] "$request"''$status $body_bytes_sent "$http_referer"''"$http_user_agent" "$http_x_forwarded_for"';access_log /var/log/nginx/access.log main;error_log /var/log/nginx/error.log;# HTTP server - redirect to HTTPSserver {listen 80;listen [::]:80;server_name <公网IP> <域名>;        # InfluxDB proxylocation /influxdb/ {proxy_pass http://influxdb:8086/;proxy_set_header Host $host;proxy_set_header X-Real-IP $remote_addr;proxy_set_header X-Forwarded-For $proxy_add_x_forwarded_for;proxy_set_header X-Forwarded-Proto $scheme;}# Prometheus proxylocation /prometheus/ {proxy_pass http://prometheus:9090/;proxy_set_header Host $host;proxy_set_header X-Real-IP $remote_addr;proxy_set_header X-Forwarded-For $proxy_add_x_forwarded_for;proxy_set_header X-Forwarded-Proto $scheme;}# node-exporter proxylocation /node_exporter/ {proxy_pass http://node_exporter:9100/;proxy_set_header Host $host;proxy_set_header X-Real-IP $remote_addr;proxy_set_header X-Forwarded-For $proxy_add_x_forwarded_for;proxy_set_header X-Forwarded-Proto $scheme;}# Alertmanager proxylocation /alertmanager/ {proxy_pass http://alertmanager:9093/;proxy_set_header Host $host;proxy_set_header X-Real-IP $remote_addr;proxy_set_header X-Forwarded-For $proxy_add_x_forwarded_for;proxy_set_header X-Forwarded-Proto $scheme;}}# HTTPS serverserver {listen 443 ssl;listen [::]:443 ssl http2;server_name <公网IP> <域名>;root /var/www/TestReport/zodance_teahouses;# SSL configurationssl_certificate     /etc/nginx/ssl/<公钥>.pem;ssl_certificate_key /etc/nginx/ssl/<私钥>.key;ssl_protocols TLSv1.2 TLSv1.3;ssl_ciphers HIGH:!aNULL:!MD5;ssl_prefer_server_ciphers on;include /etc/nginx/default.d/*.conf;# Grafana proxylocation /grafana/ {proxy_pass http://grafana:3000/;proxy_set_header Host $host;proxy_set_header X-Real-IP $remote_addr;proxy_set_header X-Forwarded-For $proxy_add_x_forwarded_for;proxy_set_header X-Forwarded-Proto $scheme;}# InfluxDB proxylocation /influxdb/ {proxy_pass http://influxdb:8086/;proxy_set_header Host $host;proxy_set_header X-Real-IP $remote_addr;proxy_set_header X-Forwarded-For $proxy_add_x_forwarded_for;proxy_set_header X-Forwarded-Proto $scheme;}# Prometheus proxylocation /prometheus/ {proxy_pass http://prometheus:9090/;proxy_set_header Host $host;proxy_set_header X-Real-IP $remote_addr;proxy_set_header X-Forwarded-For $proxy_add_x_forwarded_for;proxy_set_header X-Forwarded-Proto $scheme;}# node-exporter proxylocation /node_exporter/ {proxy_pass http://node_exporter:9100/;proxy_set_header Host $host;proxy_set_header X-Real-IP $remote_addr;proxy_set_header X-Forwarded-For $proxy_add_x_forwarded_for;proxy_set_header X-Forwarded-Proto $scheme;}# Alertmanager proxylocation /alertmanager/ {proxy_pass http://alertmanager:9093/;proxy_set_header Host $host;proxy_set_header X-Real-IP $remote_addr;proxy_set_header X-Forwarded-For $proxy_add_x_forwarded_for;proxy_set_header X-Forwarded-Proto $scheme;}# Static file serving with directory listinglocation / {autoindex on;autoindex_exact_size off;autoindex_localtime on;}# Error pageserror_page 404 /404.html;location = /40x.html {}error_page 500 502 503 504 /50x.html;location = /50x.html {}}
}
influxdb.conf配置:(influxdb-storage默认空:挂载卷)
[http]bind-address = "0.0.0.0:8086"[meta]dir = "/var/lib/influxdb/meta"[data]dir = "/var/lib/influxdb/data"engine = "tsm1"wal-dir = "/var/lib/influxdb/wal"
grafana.ini配置(用于挂载,grafana-provisioning和grafana-storage默认空【挂载卷】):
##################### Grafana Configuration Example #####################
#
# Everything has defaults so you only need to uncomment things you want to
# change# possible values : production, development
;app_mode = production# instance name, defaults to HOSTNAME environment variable value or hostname if HOSTNAME var is empty
;instance_name = ${HOSTNAME}#################################### Paths ####################################
[paths]
# Path to where grafana can store temp files, sessions, and the sqlite3 db (if that is used)
;data = /var/lib/grafana# Temporary files in `data` directory older than given duration will be removed
;temp_data_lifetime = 24h# Directory where grafana can store logs
;logs = /var/log/grafana# Directory where grafana will automatically scan and look for plugins
;plugins = /var/lib/grafana/plugins# folder that contains provisioning config files that grafana will apply on startup and while running.
;provisioning = conf/provisioning#################################### Server ####################################
[server]
# Protocol (http, https, h2, socket)
;protocol = http# The ip address to bind to, empty will bind to all interfaces
;http_addr =# The http port  to use
;http_port = 3000# The public facing domain name used to access grafana from a browser
;domain = localhost# Redirect to correct domain if host header does not match domain
# Prevents DNS rebinding attacks
;enforce_domain = false# The full public facing url you use in browser, used for redirects and emails
# If you use reverse proxy and sub path specify full url (with sub path)
;root_url = %(protocol)s://%(domain)s:%(http_port)s/
root_url = https://<域名或者主机IP>/grafana/# Serve Grafana from subpath specified in `root_url` setting. By default it is set to `false` for compatibility reasons.
serve_from_sub_path = true# Log web requests
;router_logging = false# the path relative working path
;static_root_path = public# enable gzip
;enable_gzip = false# https certs & key file
;cert_file =
;cert_key =# Unix socket path
;socket =# CDN Url
;cdn_url =# Sets the maximum time using a duration format (5s/5m/5ms) before timing out read of an incoming request and closing idle connections.
# `0` means there is no timeout for reading the request.
;read_timeout = 0#################################### Database ####################################
[database]
# You can configure the database connection by specifying type, host, name, user and password
# as separate properties or as on string using the url properties.# Either "mysql", "postgres" or "sqlite3", it's your choice
;type = sqlite3
;host = 127.0.0.1:3306
;name = grafana
;user = root
# If the password contains # or ; you have to wrap it with triple quotes. Ex """#password;"""
;password =# Use either URL or the previous fields to configure the database
# Example: mysql://user:secret@host:port/database
;url =# For "postgres" only, either "disable", "require" or "verify-full"
;ssl_mode = disable# Database drivers may support different transaction isolation levels.
# Currently, only "mysql" driver supports isolation levels.
# If the value is empty - driver's default isolation level is applied.
# For "mysql" use "READ-UNCOMMITTED", "READ-COMMITTED", "REPEATABLE-READ" or "SERIALIZABLE".
;isolation_level =;ca_cert_path =
;client_key_path =
;client_cert_path =
;server_cert_name =# For "sqlite3" only, path relative to data_path setting
;path = grafana.db# Max idle conn setting default is 2
;max_idle_conn = 2# Max conn setting default is 0 (mean not set)
;max_open_conn =# Connection Max Lifetime default is 14400 (means 14400 seconds or 4 hours)
;conn_max_lifetime = 14400# Set to true to log the sql calls and execution times.
;log_queries =# For "sqlite3" only. cache mode setting used for connecting to the database. (private, shared)
;cache_mode = private################################### Data sources #########################
[datasources]
# Upper limit of data sources that Grafana will return. This limit is a temporary configuration and it will be deprecated when pagination will be introduced on the list data sources API.
;datasource_limit = 5000#################################### Cache server #############################
[remote_cache]
# Either "redis", "memcached" or "database" default is "database"
;type = database# cache connectionstring options
# database: will use Grafana primary database.
# redis: config like redis server e.g. `addr=127.0.0.1:6379,pool_size=100,db=0,ssl=false`. Only addr is required. ssl may be 'true', 'false', or 'insecure'.
# memcache: 127.0.0.1:11211
;connstr =#################################### Data proxy ###########################
[dataproxy]# This enables data proxy logging, default is false
;logging = false# How long the data proxy waits to read the headers of the response before timing out, default is 30 seconds.
# This setting also applies to core backend HTTP data sources where query requests use an HTTP client with timeout set.
;timeout = 30# How long the data proxy waits to establish a TCP connection before timing out, default is 10 seconds.
;dialTimeout = 10# How many seconds the data proxy waits before sending a keepalive probe request.
;keep_alive_seconds = 30# How many seconds the data proxy waits for a successful TLS Handshake before timing out.
;tls_handshake_timeout_seconds = 10# How many seconds the data proxy will wait for a server's first response headers after
# fully writing the request headers if the request has an "Expect: 100-continue"
# header. A value of 0 will result in the body being sent immediately, without
# waiting for the server to approve.
;expect_continue_timeout_seconds = 1# Optionally limits the total number of connections per host, including connections in the dialing,
# active, and idle states. On limit violation, dials will block.
# A value of zero (0) means no limit.
;max_conns_per_host = 0# The maximum number of idle connections that Grafana will keep alive.
;max_idle_connections = 100# How many seconds the data proxy keeps an idle connection open before timing out.
;idle_conn_timeout_seconds = 90# If enabled and user is not anonymous, data proxy will add X-Grafana-User header with username into the request, default is false.
;send_user_header = false# Limit the amount of bytes that will be read/accepted from responses of outgoing HTTP requests.
;response_limit = 0# Limits the number of rows that Grafana will process from SQL data sources.
;row_limit = 1000000#################################### Analytics ####################################
[analytics]
# Server reporting, sends usage counters to stats.grafana.org every 24 hours.
# No ip addresses are being tracked, only simple counters to track
# running instances, dashboard and error counts. It is very helpful to us.
# Change this option to false to disable reporting.
;reporting_enabled = true# The name of the distributor of the Grafana instance. Ex hosted-grafana, grafana-labs
;reporting_distributor = grafana-labs# Set to false to disable all checks to https://grafana.net
# for new versions (grafana itself and plugins), check is used
# in some UI views to notify that grafana or plugin update exists
# This option does not cause any auto updates, nor send any information
# only a GET request to http://grafana.com to get latest versions
;check_for_updates = true# Google Analytics universal tracking code, only enabled if you specify an id here
;google_analytics_ua_id =# Google Tag Manager ID, only enabled if you specify an id here
;google_tag_manager_id =#################################### Security ####################################
[security]
# disable creation of admin user on first start of grafana
;disable_initial_admin_creation = false# default admin user, created on startup
;admin_user = admin# default admin password, can be changed before first start of grafana,  or in profile settings
;admin_password = admin# used for signing
;secret_key = SW2YcwTIb9zpOOhoPsMm# current key provider used for envelope encryption, default to static value specified by secret_key
;encryption_provider = secretKey# list of configured key providers, space separated (Enterprise only): e.g., awskms.v1 azurekv.v1
;available_encryption_providers =# disable gravatar profile images
;disable_gravatar = false# data source proxy whitelist (ip_or_domain:port separated by spaces)
;data_source_proxy_whitelist =# disable protection against brute force login attempts
;disable_brute_force_login_protection = false# set to true if you host Grafana behind HTTPS. default is false.
;cookie_secure = false# set cookie SameSite attribute. defaults to `lax`. can be set to "lax", "strict", "none" and "disabled"
;cookie_samesite = lax# set to true if you want to allow browsers to render Grafana in a <frame>, <iframe>, <embed> or <object>. default is false.
;allow_embedding = false# Set to true if you want to enable http strict transport security (HSTS) response header.
# This is only sent when HTTPS is enabled in this configuration.
# HSTS tells browsers that the site should only be accessed using HTTPS.
;strict_transport_security = false# Sets how long a browser should cache HSTS. Only applied if strict_transport_security is enabled.
;strict_transport_security_max_age_seconds = 86400# Set to true if to enable HSTS preloading option. Only applied if strict_transport_security is enabled.
;strict_transport_security_preload = false# Set to true if to enable the HSTS includeSubDomains option. Only applied if strict_transport_security is enabled.
;strict_transport_security_subdomains = false# Set to true to enable the X-Content-Type-Options response header.
# The X-Content-Type-Options response HTTP header is a marker used by the server to indicate that the MIME types advertised
# in the Content-Type headers should not be changed and be followed.
;x_content_type_options = true# Set to true to enable the X-XSS-Protection header, which tells browsers to stop pages from loading
# when they detect reflected cross-site scripting (XSS) attacks.
;x_xss_protection = true# Enable adding the Content-Security-Policy header to your requests.
# CSP allows to control resources the user agent is allowed to load and helps prevent XSS attacks.
;content_security_policy = false# Set Content Security Policy template used when adding the Content-Security-Policy header to your requests.
# $NONCE in the template includes a random nonce.
# $ROOT_PATH is server.root_url without the protocol.
;content_security_policy_template = """script-src 'self' 'unsafe-eval' 'unsafe-inline' 'strict-dynamic' $NONCE;object-src 'none';font-src 'self';style-src 'self' 'unsafe-inline' blob:;img-src * data:;base-uri 'self';connect-src 'self' grafana.com ws://$ROOT_PATH wss://$ROOT_PATH;manifest-src 'self';media-src 'none';form-action 'self';"""#################################### Snapshots ###########################
[snapshots]
# snapshot sharing options
;external_enabled = true
;external_snapshot_url = https://snapshots-origin.raintank.io
;external_snapshot_name = Publish to snapshot.raintank.io# Set to true to enable this Grafana instance act as an external snapshot server and allow unauthenticated requests for
# creating and deleting snapshots.
;public_mode = false# remove expired snapshot
;snapshot_remove_expired = true#################################### Dashboards History ##################
[dashboards]
# Number dashboard versions to keep (per dashboard). Default: 20, Minimum: 1
;versions_to_keep = 20# Minimum dashboard refresh interval. When set, this will restrict users to set the refresh interval of a dashboard lower than given interval. Per default this is 5 seconds.
# The interval string is a possibly signed sequence of decimal numbers, followed by a unit suffix (ms, s, m, h, d), e.g. 30s or 1m.
;min_refresh_interval = 5s# Path to the default home dashboard. If this value is empty, then Grafana uses StaticRootPath + "dashboards/home.json"
;default_home_dashboard_path =#################################### Users ###############################
[users]
# disable user signup / registration
;allow_sign_up = true# Allow non admin users to create organizations
;allow_org_create = true# Set to true to automatically assign new users to the default organization (id 1)
;auto_assign_org = true# Set this value to automatically add new users to the provided organization (if auto_assign_org above is set to true)
;auto_assign_org_id = 1# Default role new users will be automatically assigned (if disabled above is set to true)
;auto_assign_org_role = Viewer# Require email validation before sign up completes
;verify_email_enabled = false# Background text for the user field on the login page
;login_hint = email or username
;password_hint = password# Default UI theme ("dark" or "light")
;default_theme = dark# Path to a custom home page. Users are only redirected to this if the default home dashboard is used. It should match a frontend route and contain a leading slash.
; home_page =# External user management, these options affect the organization users view
;external_manage_link_url =
;external_manage_link_name =
;external_manage_info =# Viewers can edit/inspect dashboard settings in the browser. But not save the dashboard.
;viewers_can_edit = false# Editors can administrate dashboard, folders and teams they create
;editors_can_admin = false# The duration in time a user invitation remains valid before expiring. This setting should be expressed as a duration. Examples: 6h (hours), 2d (days), 1w (week). Default is 24h (24 hours). The minimum supported duration is 15m (15 minutes).
;user_invite_max_lifetime_duration = 24h# Enter a comma-separated list of users login to hide them in the Grafana UI. These users are shown to Grafana admins and themselves.
; hidden_users =[auth]
# Login cookie name
;login_cookie_name = grafana_session# The maximum lifetime (duration) an authenticated user can be inactive before being required to login at next visit. Default is 7 days (7d). This setting should be expressed as a duration, e.g. 5m (minutes), 6h (hours), 10d (days), 2w (weeks), 1M (month). The lifetime resets at each successful token rotation.
;login_maximum_inactive_lifetime_duration =# The maximum lifetime (duration) an authenticated user can be logged in since login time before being required to login. Default is 30 days (30d). This setting should be expressed as a duration, e.g. 5m (minutes), 6h (hours), 10d (days), 2w (weeks), 1M (month).
;login_maximum_lifetime_duration =# How often should auth tokens be rotated for authenticated users when being active. The default is each 10 minutes.
;token_rotation_interval_minutes = 10# Set to true to disable (hide) the login form, useful if you use OAuth, defaults to false
;disable_login_form = false# Set to true to disable the sign out link in the side menu. Useful if you use auth.proxy or auth.jwt, defaults to false
;disable_signout_menu = false# URL to redirect the user to after sign out
;signout_redirect_url =# Set to true to attempt login with OAuth automatically, skipping the login screen.
# This setting is ignored if multiple OAuth providers are configured.
;oauth_auto_login = false# OAuth state max age cookie duration in seconds. Defaults to 600 seconds.
;oauth_state_cookie_max_age = 600# limit of api_key seconds to live before expiration
;api_key_max_seconds_to_live = -1# Set to true to enable SigV4 authentication option for HTTP-based datasources.
;sigv4_auth_enabled = false#################################### Anonymous Auth ######################
[auth.anonymous]
# enable anonymous access
;enabled = false# specify organization name that should be used for unauthenticated users
;org_name = Main Org.# specify role for unauthenticated users
;org_role = Viewer# mask the Grafana version number for unauthenticated users
;hide_version = false#################################### GitHub Auth ##########################
[auth.github]
;enabled = false
;allow_sign_up = true
;client_id = some_id
;client_secret = some_secret
;scopes = user:email,read:org
;auth_url = https://github.com/login/oauth/authorize
;token_url = https://github.com/login/oauth/access_token
;api_url = https://api.github.com/user
;allowed_domains =
;team_ids =
;allowed_organizations =#################################### GitLab Auth #########################
[auth.gitlab]
;enabled = false
;allow_sign_up = true
;client_id = some_id
;client_secret = some_secret
;scopes = api
;auth_url = https://gitlab.com/oauth/authorize
;token_url = https://gitlab.com/oauth/token
;api_url = https://gitlab.com/api/v4
;allowed_domains =
;allowed_groups =#################################### Google Auth ##########################
[auth.google]
;enabled = false
;allow_sign_up = true
;client_id = some_client_id
;client_secret = some_client_secret
;scopes = https://www.googleapis.com/auth/userinfo.profile https://www.googleapis.com/auth/userinfo.email
;auth_url = https://accounts.google.com/o/oauth2/auth
;token_url = https://accounts.google.com/o/oauth2/token
;api_url = https://www.googleapis.com/oauth2/v1/userinfo
;allowed_domains =
;hosted_domain =#################################### Grafana.com Auth ####################
[auth.grafana_com]
;enabled = false
;allow_sign_up = true
;client_id = some_id
;client_secret = some_secret
;scopes = user:email
;allowed_organizations =#################################### Azure AD OAuth #######################
[auth.azuread]
;name = Azure AD
;enabled = false
;allow_sign_up = true
;client_id = some_client_id
;client_secret = some_client_secret
;scopes = openid email profile
;auth_url = https://login.microsoftonline.com/<tenant-id>/oauth2/v2.0/authorize
;token_url = https://login.microsoftonline.com/<tenant-id>/oauth2/v2.0/token
;allowed_domains =
;allowed_groups =#################################### Okta OAuth #######################
[auth.okta]
;name = Okta
;enabled = false
;allow_sign_up = true
;client_id = some_id
;client_secret = some_secret
;scopes = openid profile email groups
;auth_url = https://<tenant-id>.okta.com/oauth2/v1/authorize
;token_url = https://<tenant-id>.okta.com/oauth2/v1/token
;api_url = https://<tenant-id>.okta.com/oauth2/v1/userinfo
;allowed_domains =
;allowed_groups =
;role_attribute_path =
;role_attribute_strict = false#################################### Generic OAuth ##########################
[auth.generic_oauth]
;enabled = false
;name = OAuth
;allow_sign_up = true
;client_id = some_id
;client_secret = some_secret
;scopes = user:email,read:org
;empty_scopes = false
;email_attribute_name = email:primary
;email_attribute_path =
;login_attribute_path =
;name_attribute_path =
;id_token_attribute_name =
;auth_url = https://foo.bar/login/oauth/authorize
;token_url = https://foo.bar/login/oauth/access_token
;api_url = https://foo.bar/user
;teams_url =
;allowed_domains =
;team_ids =
;allowed_organizations =
;role_attribute_path =
;role_attribute_strict = false
;groups_attribute_path =
;team_ids_attribute_path =
;tls_skip_verify_insecure = false
;tls_client_cert =
;tls_client_key =
;tls_client_ca =
;use_pkce = false#################################### Basic Auth ##########################
[auth.basic]
;enabled = true#################################### Auth Proxy ##########################
[auth.proxy]
;enabled = false
;header_name = X-WEBAUTH-USER
;header_property = username
;auto_sign_up = true
;sync_ttl = 60
;whitelist = 192.168.1.1, 192.168.2.1
;headers = Email:X-User-Email, Name:X-User-Name
# Read the auth proxy docs for details on what the setting below enables
;enable_login_token = false#################################### Auth JWT ##########################
[auth.jwt]
;enabled = true
;header_name = X-JWT-Assertion
;email_claim = sub
;username_claim = sub
;jwk_set_url = https://foo.bar/.well-known/jwks.json
;jwk_set_file = /path/to/jwks.json
;cache_ttl = 60m
;expected_claims = {"aud": ["foo", "bar"]}
;key_file = /path/to/key/file#################################### Auth LDAP ##########################
[auth.ldap]
;enabled = false
;config_file = /etc/grafana/ldap.toml
;allow_sign_up = true# LDAP background sync (Enterprise only)
# At 1 am every day
;sync_cron = "0 0 1 * * *"
;active_sync_enabled = true#################################### AWS ###########################
[aws]
# Enter a comma-separated list of allowed AWS authentication providers.
# Options are: default (AWS SDK Default), keys (Access && secret key), credentials (Credentials field), ec2_iam_role (EC2 IAM Role)
; allowed_auth_providers = default,keys,credentials# Allow AWS users to assume a role using temporary security credentials.
# If true, assume role will be enabled for all AWS authentication providers that are specified in aws_auth_providers
; assume_role_enabled = true#################################### Azure ###############################
[azure]
# Azure cloud environment where Grafana is hosted
# Possible values are AzureCloud, AzureChinaCloud, AzureUSGovernment and AzureGermanCloud
# Default value is AzureCloud (i.e. public cloud)
;cloud = AzureCloud# Specifies whether Grafana hosted in Azure service with Managed Identity configured (e.g. Azure Virtual Machines instance)
# If enabled, the managed identity can be used for authentication of Grafana in Azure services
# Disabled by default, needs to be explicitly enabled
;managed_identity_enabled = false# Client ID to use for user-assigned managed identity
# Should be set for user-assigned identity and should be empty for system-assigned identity
;managed_identity_client_id =#################################### SMTP / Emailing ##########################
[smtp]
;enabled = false
;host = localhost:25
;user =
# If the password contains # or ; you have to wrap it with triple quotes. Ex """#password;"""
;password =
;cert_file =
;key_file =
;skip_verify = false
;from_address = admin@grafana.localhost
;from_name = Grafana
# EHLO identity in SMTP dialog (defaults to instance_name)
;ehlo_identity = dashboard.example.com
# SMTP startTLS policy (defaults to 'OpportunisticStartTLS')
;startTLS_policy = NoStartTLS[emails]
;welcome_email_on_sign_up = false
;templates_pattern = emails/*.html, emails/*.txt
;content_types = text/html#################################### Logging ##########################
[log]
# Either "console", "file", "syslog". Default is console and  file
# Use space to separate multiple modes, e.g. "console file"
;mode = console file# Either "debug", "info", "warn", "error", "critical", default is "info"
;level = info# optional settings to set different levels for specific loggers. Ex filters = sqlstore:debug
;filters =# For "console" mode only
[log.console]
;level =# log line format, valid options are text, console and json
;format = console# For "file" mode only
[log.file]
;level =# log line format, valid options are text, console and json
;format = text# This enables automated log rotate(switch of following options), default is true
;log_rotate = true# Max line number of single file, default is 1000000
;max_lines = 1000000# Max size shift of single file, default is 28 means 1 << 28, 256MB
;max_size_shift = 28# Segment log daily, default is true
;daily_rotate = true# Expired days of log file(delete after max days), default is 7
;max_days = 7[log.syslog]
;level =# log line format, valid options are text, console and json
;format = text# Syslog network type and address. This can be udp, tcp, or unix. If left blank, the default unix endpoints will be used.
;network =
;address =# Syslog facility. user, daemon and local0 through local7 are valid.
;facility =# Syslog tag. By default, the process' argv[0] is used.
;tag =[log.frontend]
# Should Sentry javascript agent be initialized
;enabled = false# Sentry DSN if you want to send events to Sentry.
;sentry_dsn =# Custom HTTP endpoint to send events captured by the Sentry agent to. Default will log the events to stdout.
;custom_endpoint = /log# Rate of events to be reported between 0 (none) and 1 (all), float
;sample_rate = 1.0# Requests per second limit enforced an extended period, for Grafana backend log ingestion endpoint (/log).
;log_endpoint_requests_per_second_limit = 3# Max requests accepted per short interval of time for Grafana backend log ingestion endpoint (/log).
;log_endpoint_burst_limit = 15#################################### Usage Quotas ########################
[quota]
; enabled = false#### set quotas to -1 to make unlimited. ####
# limit number of users per Org.
; org_user = 10# limit number of dashboards per Org.
; org_dashboard = 100# limit number of data_sources per Org.
; org_data_source = 10# limit number of api_keys per Org.
; org_api_key = 10# limit number of alerts per Org.
;org_alert_rule = 100# limit number of orgs a user can create.
; user_org = 10# Global limit of users.
; global_user = -1# global limit of orgs.
; global_org = -1# global limit of dashboards
; global_dashboard = -1# global limit of api_keys
; global_api_key = -1# global limit on number of logged in users.
; global_session = -1# global limit of alerts
;global_alert_rule = -1#################################### Unified Alerting ####################
[unified_alerting]
#Enable the Unified Alerting sub-system and interface. When enabled we'll migrate all of your alert rules and notification channels to the new system. New alert rules will be created and your notification channels will be converted into an Alertmanager configuration. Previous data is preserved to enable backwards compatibility but new data is removed.```
;enabled = true# Comma-separated list of organization IDs for which to disable unified alerting. Only supported if unified alerting is enabled.
;disabled_orgs =# Specify the frequency of polling for admin config changes.
# The interval string is a possibly signed sequence of decimal numbers, followed by a unit suffix (ms, s, m, h, d), e.g. 30s or 1m.
;admin_config_poll_interval = 60s# Specify the frequency of polling for Alertmanager config changes.
# The interval string is a possibly signed sequence of decimal numbers, followed by a unit suffix (ms, s, m, h, d), e.g. 30s or 1m.
;alertmanager_config_poll_interval = 60s# Listen address/hostname and port to receive unified alerting messages for other Grafana instances. The port is used for both TCP and UDP. It is assumed other Grafana instances are also running on the same port. The default value is `0.0.0.0:9094`.
;ha_listen_address = "0.0.0.0:9094"# Listen address/hostname and port to receive unified alerting messages for other Grafana instances. The port is used for both TCP and UDP. It is assumed other Grafana instances are also running on the same port. The default value is `0.0.0.0:9094`.
;ha_advertise_address = ""# Comma-separated list of initial instances (in a format of host:port) that will form the HA cluster. Configuring this setting will enable High Availability mode for alerting.
;ha_peers = ""# Time to wait for an instance to send a notification via the Alertmanager. In HA, each Grafana instance will
# be assigned a position (e.g. 0, 1). We then multiply this position with the timeout to indicate how long should
# each instance wait before sending the notification to take into account replication lag.
# The interval string is a possibly signed sequence of decimal numbers, followed by a unit suffix (ms, s, m, h, d), e.g. 30s or 1m.
;ha_peer_timeout = "15s"# The interval between sending gossip messages. By lowering this value (more frequent) gossip messages are propagated
# across cluster more quickly at the expense of increased bandwidth usage.
# The interval string is a possibly signed sequence of decimal numbers, followed by a unit suffix (ms, s, m, h, d), e.g. 30s or 1m.
;ha_gossip_interval = "200ms"# The interval between gossip full state syncs. Setting this interval lower (more frequent) will increase convergence speeds
# across larger clusters at the expense of increased bandwidth usage.
# The interval string is a possibly signed sequence of decimal numbers, followed by a unit suffix (ms, s, m, h, d), e.g. 30s or 1m.
;ha_push_pull_interval = "60s"# Enable or disable alerting rule execution. The alerting UI remains visible. This option has a legacy version in the `[alerting]` section that takes precedence.
;execute_alerts = true# Alert evaluation timeout when fetching data from the datasource. This option has a legacy version in the `[alerting]` section that takes precedence.
# The timeout string is a possibly signed sequence of decimal numbers, followed by a unit suffix (ms, s, m, h, d), e.g. 30s or 1m.
;evaluation_timeout = 30s# Number of times we'll attempt to evaluate an alert rule before giving up on that evaluation. This option has a legacy version in the `[alerting]` section that takes precedence.
;max_attempts = 3# Minimum interval to enforce between rule evaluations. Rules will be adjusted if they are less than this value  or if they are not multiple of the scheduler interval (10s). Higher values can help with resource management as we'll schedule fewer evaluations over time. This option has a legacy version in the `[alerting]` section that takes precedence.
# The interval string is a possibly signed sequence of decimal numbers, followed by a unit suffix (ms, s, m, h, d), e.g. 30s or 1m.
;min_interval = 10s#################################### Alerting ############################
[alerting]
# Disable legacy alerting engine & UI features
;enabled = false# Makes it possible to turn off alert execution but alerting UI is visible
;execute_alerts = true# Default setting for new alert rules. Defaults to categorize error and timeouts as alerting. (alerting, keep_state)
;error_or_timeout = alerting# Default setting for how Grafana handles nodata or null values in alerting. (alerting, no_data, keep_state, ok)
;nodata_or_nullvalues = no_data# Alert notifications can include images, but rendering many images at the same time can overload the server
# This limit will protect the server from render overloading and make sure notifications are sent out quickly
;concurrent_render_limit = 5# Default setting for alert calculation timeout. Default value is 30
;evaluation_timeout_seconds = 30# Default setting for alert notification timeout. Default value is 30
;notification_timeout_seconds = 30# Default setting for max attempts to sending alert notifications. Default value is 3
;max_attempts = 3# Makes it possible to enforce a minimal interval between evaluations, to reduce load on the backend
;min_interval_seconds = 1# Configures for how long alert annotations are stored. Default is 0, which keeps them forever.
# This setting should be expressed as a duration. Examples: 6h (hours), 10d (days), 2w (weeks), 1M (month).
;max_annotation_age =# Configures max number of alert annotations that Grafana stores. Default value is 0, which keeps all alert annotations.
;max_annotations_to_keep =#################################### Annotations #########################
[annotations]
# Configures the batch size for the annotation clean-up job. This setting is used for dashboard, API, and alert annotations.
;cleanupjob_batchsize = 100[annotations.dashboard]
# Dashboard annotations means that annotations are associated with the dashboard they are created on.# Configures how long dashboard annotations are stored. Default is 0, which keeps them forever.
# This setting should be expressed as a duration. Examples: 6h (hours), 10d (days), 2w (weeks), 1M (month).
;max_age =# Configures max number of dashboard annotations that Grafana stores. Default value is 0, which keeps all dashboard annotations.
;max_annotations_to_keep =[annotations.api]
# API annotations means that the annotations have been created using the API without any
# association with a dashboard.# Configures how long Grafana stores API annotations. Default is 0, which keeps them forever.
# This setting should be expressed as a duration. Examples: 6h (hours), 10d (days), 2w (weeks), 1M (month).
;max_age =# Configures max number of API annotations that Grafana keeps. Default value is 0, which keeps all API annotations.
;max_annotations_to_keep =#################################### Explore #############################
[explore]
# Enable the Explore section
;enabled = true#################################### Internal Grafana Metrics ##########################
# Metrics available at HTTP API Url /metrics
[metrics]
# Disable / Enable internal metrics
;enabled           = true
# Graphite Publish interval
;interval_seconds  = 10
# Disable total stats (stat_totals_*) metrics to be generated
;disable_total_stats = false#If both are set, basic auth will be required for the metrics endpoint.
; basic_auth_username =
; basic_auth_password =# Metrics environment info adds dimensions to the `grafana_environment_info` metric, which
# can expose more information about the Grafana instance.
[metrics.environment_info]
#exampleLabel1 = exampleValue1
#exampleLabel2 = exampleValue2# Send internal metrics to Graphite
[metrics.graphite]
# Enable by setting the address setting (ex localhost:2003)
;address =
;prefix = prod.grafana.%(instance_name)s.#################################### Grafana.com integration  ##########################
# Url used to import dashboards directly from Grafana.com
[grafana_com]
;url = https://grafana.com#################################### Distributed tracing ############
[tracing.jaeger]
# Enable by setting the address sending traces to jaeger (ex localhost:6831)
;address = localhost:6831
# Tag that will always be included in when creating new spans. ex (tag1:value1,tag2:value2)
;always_included_tag = tag1:value1
# Type specifies the type of the sampler: const, probabilistic, rateLimiting, or remote
;sampler_type = const
# jaeger samplerconfig param
# for "const" sampler, 0 or 1 for always false/true respectively
# for "probabilistic" sampler, a probability between 0 and 1
# for "rateLimiting" sampler, the number of spans per second
# for "remote" sampler, param is the same as for "probabilistic"
# and indicates the initial sampling rate before the actual one
# is received from the mothership
;sampler_param = 1
# sampling_server_url is the URL of a sampling manager providing a sampling strategy.
;sampling_server_url =
# Whether or not to use Zipkin propagation (x-b3- HTTP headers).
;zipkin_propagation = false
# Setting this to true disables shared RPC spans.
# Not disabling is the most common setting when using Zipkin elsewhere in your infrastructure.
;disable_shared_zipkin_spans = false#################################### External image storage ##########################
[external_image_storage]
# Used for uploading images to public servers so they can be included in slack/email messages.
# you can choose between (s3, webdav, gcs, azure_blob, local)
;provider =[external_image_storage.s3]
;endpoint =
;path_style_access =
;bucket =
;region =
;path =
;access_key =
;secret_key =[external_image_storage.webdav]
;url =
;public_url =
;username =
;password =[external_image_storage.gcs]
;key_file =
;bucket =
;path =[external_image_storage.azure_blob]
;account_name =
;account_key =
;container_name =[external_image_storage.local]
# does not require any configuration[rendering]
# Options to configure a remote HTTP image rendering service, e.g. using https://github.com/grafana/grafana-image-renderer.
# URL to a remote HTTP image renderer service, e.g. http://localhost:8081/render, will enable Grafana to render panels and dashboards to PNG-images using HTTP requests to an external service.
;server_url =
# If the remote HTTP image renderer service runs on a different server than the Grafana server you may have to configure this to a URL where Grafana is reachable, e.g. http://grafana.domain/.
;callback_url =
# Concurrent render request limit affects when the /render HTTP endpoint is used. Rendering many images at the same time can overload the server,
# which this setting can help protect against by only allowing a certain amount of concurrent requests.
;concurrent_render_request_limit = 30[panels]
# If set to true Grafana will allow script tags in text panels. Not recommended as it enable XSS vulnerabilities.
;disable_sanitize_html = false[plugins]
;enable_alpha = false
;app_tls_skip_verify_insecure = false
# Enter a comma-separated list of plugin identifiers to identify plugins to load even if they are unsigned. Plugins with modified signatures are never loaded.
;allow_loading_unsigned_plugins =
# Enable or disable installing / uninstalling / updating plugins directly from within Grafana.
;plugin_admin_enabled = false
;plugin_admin_external_manage_enabled = false
;plugin_catalog_url = https://grafana.com/grafana/plugins/
# Enter a comma-separated list of plugin identifiers to hide in the plugin catalog.
;plugin_catalog_hidden_plugins =#################################### Grafana Live ##########################################
[live]
# max_connections to Grafana Live WebSocket endpoint per Grafana server instance. See Grafana Live docs
# if you are planning to make it higher than default 100 since this can require some OS and infrastructure
# tuning. 0 disables Live, -1 means unlimited connections.
;max_connections = 100# allowed_origins is a comma-separated list of origins that can establish connection with Grafana Live.
# If not set then origin will be matched over root_url. Supports wildcard symbol "*".
;allowed_origins =# engine defines an HA (high availability) engine to use for Grafana Live. By default no engine used - in
# this case Live features work only on a single Grafana server. Available options: "redis".
# Setting ha_engine is an EXPERIMENTAL feature.
;ha_engine =# ha_engine_address sets a connection address for Live HA engine. Depending on engine type address format can differ.
# For now we only support Redis connection address in "host:port" format.
# This option is EXPERIMENTAL.
;ha_engine_address = "127.0.0.1:6379"#################################### Grafana Image Renderer Plugin ##########################
[plugin.grafana-image-renderer]
# Instruct headless browser instance to use a default timezone when not provided by Grafana, e.g. when rendering panel image of alert.
# See ICU’s metaZones.txt (https://cs.chromium.org/chromium/src/third_party/icu/source/data/misc/metaZones.txt) for a list of supported
# timezone IDs. Fallbacks to TZ environment variable if not set.
;rendering_timezone =# Instruct headless browser instance to use a default language when not provided by Grafana, e.g. when rendering panel image of alert.
# Please refer to the HTTP header Accept-Language to understand how to format this value, e.g. 'fr-CH, fr;q=0.9, en;q=0.8, de;q=0.7, *;q=0.5'.
;rendering_language =# Instruct headless browser instance to use a default device scale factor when not provided by Grafana, e.g. when rendering panel image of alert.
# Default is 1. Using a higher value will produce more detailed images (higher DPI), but will require more disk space to store an image.
;rendering_viewport_device_scale_factor =# Instruct headless browser instance whether to ignore HTTPS errors during navigation. Per default HTTPS errors are not ignored. Due to
# the security risk it's not recommended to ignore HTTPS errors.
;rendering_ignore_https_errors =# Instruct headless browser instance whether to capture and log verbose information when rendering an image. Default is false and will
# only capture and log error messages. When enabled, debug messages are captured and logged as well.
# For the verbose information to be included in the Grafana server log you have to adjust the rendering log level to debug, configure
# [log].filter = rendering:debug.
;rendering_verbose_logging =# Instruct headless browser instance whether to output its debug and error messages into running process of remote rendering service.
# Default is false. This can be useful to enable (true) when troubleshooting.
;rendering_dumpio =# Additional arguments to pass to the headless browser instance. Default is --no-sandbox. The list of Chromium flags can be found
# here (https://peter.sh/experiments/chromium-command-line-switches/). Multiple arguments is separated with comma-character.
;rendering_args =# You can configure the plugin to use a different browser binary instead of the pre-packaged version of Chromium.
# Please note that this is not recommended, since you may encounter problems if the installed version of Chrome/Chromium is not
# compatible with the plugin.
;rendering_chrome_bin =# Instruct how headless browser instances are created. Default is 'default' and will create a new browser instance on each request.
# Mode 'clustered' will make sure that only a maximum of browsers/incognito pages can execute concurrently.
# Mode 'reusable' will have one browser instance and will create a new incognito page on each request.
;rendering_mode =# When rendering_mode = clustered, you can instruct how many browsers or incognito pages can execute concurrently. Default is 'browser'
# and will cluster using browser instances.
# Mode 'context' will cluster using incognito pages.
;rendering_clustering_mode =
# When rendering_mode = clustered, you can define the maximum number of browser instances/incognito pages that can execute concurrently. Default is '5'.
;rendering_clustering_max_concurrency =
# When rendering_mode = clustered, you can specify the duration a rendering request can take before it will time out. Default is `30` seconds.
;rendering_clustering_timeout =# Limit the maximum viewport width, height and device scale factor that can be requested.
;rendering_viewport_max_width =
;rendering_viewport_max_height =
;rendering_viewport_max_device_scale_factor =# Change the listening host and port of the gRPC server. Default host is 127.0.0.1 and default port is 0 and will automatically assign
# a port not in use.
;grpc_host =
;grpc_port =[enterprise]
# Path to a valid Grafana Enterprise license.jwt file
;license_path =[feature_toggles]
# enable features, separated by spaces
;enable =[date_formats]
# For information on what formatting patterns that are supported https://momentjs.com/docs/#/displaying/# Default system date format used in time range picker and other places where full time is displayed
;full_date = YYYY-MM-DD HH:mm:ss# Used by graph and other places where we only show small intervals
;interval_second = HH:mm:ss
;interval_minute = HH:mm
;interval_hour = MM/DD HH:mm
;interval_day = MM/DD
;interval_month = YYYY-MM
;interval_year = YYYY# Experimental feature
;use_browser_locale = false# Default timezone for user preferences. Options are 'browser' for the browser local timezone or a timezone name from IANA Time Zone database, e.g. 'UTC' or 'Europe/Amsterdam' etc.
;default_timezone = browser[expressions]
# Enable or disable the expressions functionality.
;enabled = true[geomap]
# Set the JSON configuration for the default basemap
;default_baselayer_config = `{
;  "type": "xyz",
;  "config": {
;    "attribution": "Open street map",
;    "url": "https://tile.openstreetmap.org/{z}/{x}/{y}.png"
;  }
;}`# Enable or disable loading other base map layers
;enable_custom_baselayers = true
prometheus.yml配置:
global:scrape_interval: 15sscrape_timeout: 10sevaluation_interval: 15srule_files:- "/etc/prometheus/alert.rules.yml" alerting:alertmanagers:- static_configs:- targets: ['alertmanager:9093']scrape_configs:- job_name: "jmeter-pressure-server"static_configs:- targets: ["node_exporter:9100"]labels:env: "production"role: "jmeter-pressure"- job_name: "prometheus-self"static_configs:- targets: ["localhost:9090"]
alert.rules.yml配置:
groups:
- name: cpu-alertsrules:- alert: CPU使用率过高expr: 100 - (avg by(instance) (irate(node_cpu_seconds_total{mode="idle"}[5m])) * 100) > 85for: 5mlabels:severity: warningannotations:summary: "🔥 CPU 使用率过高 - {{ $labels.instance }}"description: |实例 {{ $labels.instance }} 的 CPU 使用率已达到 {{ $value | printf "%.1f" }}%,持续 5 分钟。**建议**:生产环境 CPU 长期 > 85% 可影响性能,> 90% 建议立即优化或扩容。请使用 `top` 或 `htop` 检查高负载进程。- alert: 系统负载过高expr: node_load1 / count without (cpu, mode) (node_cpu_seconds_total{mode="idle"}) > 1for: 10mlabels:severity: warningannotations:summary: "⚠️ 系统负载偏高 - {{ $labels.instance }}"description: |实例 {{ $labels.instance }} 的 1 分钟平均负载为 {{ $value | printf "%.2f" }},**建议**:该值为负载与 CPU 核心数的比值,如果持续超过 1,说明系统负载偏高,任务可能开始排队,影响性能。- name: memory-alertsrules:- alert: 内存使用率过高expr: (node_memory_MemTotal_bytes - node_memory_MemAvailable_bytes) / node_memory_MemTotal_bytes * 100 > 85for: 5mlabels:severity: warningannotations:summary: "🧠 内存使用率过高 - {{ $labels.instance }}"description: |实例 {{ $labels.instance }} 的内存使用率为 {{ $value | printf "%.1f" }}%,剩余可用内存较少。**建议**:内存长期 > 85% 可能引发 OOM 或使用 Swap,建议排查内存占用进程。若使用率 > 95%,系统可能不稳定。- alert: 系统开始使用 Swapexpr: node_memory_SwapUsed_bytes > 0for: 10mlabels:severity: warningannotations:summary: "💾 系统已使用 Swap - {{ $labels.instance }}"description: |实例 {{ $labels.instance }} 已开始使用 Swap 空间,说明物理内存不足。**建议**:生产环境应尽量避免使用 Swap,否则会导致性能急剧下降。请优化应用内存使用或扩容内存。- name: disk-alertsrules:- alert: 根分区磁盘空间不足expr: (node_filesystem_avail_bytes{mountpoint="/", fstype=~"ext4|xfs|btrfs"} / node_filesystem_size_bytes{mountpoint="/", fstype=~"ext4|xfs|btrfs"}) * 100 < 10for: 10mlabels:severity: criticalannotations:summary: "🚨 根分区磁盘空间严重不足 - {{ $labels.instance }}"description: |实例 {{ $labels.instance }} 的根分区(/)磁盘使用率超过 90%,剩余空间仅 {{ $value | printf "%.1f" }}%。**风险**:根分区满了将导致系统无法写入日志、更新或崩溃!必须立即处理。- alert: 磁盘空间不足(通用数据盘)expr: (node_filesystem_avail_bytes{fstype=~"ext4|xfs|btrfs"} / node_filesystem_size_bytes{fstype=~"ext4|xfs|btrfs"}) * 100 < 15for: 10mlabels:severity: warningannotations:summary: "⚠️ 磁盘空间不足 - {{ $labels.instance }} ({{ $labels.mountpoint }})"description: |实例 {{ $labels.instance }} 的挂载点 {{ $labels.mountpoint }} 磁盘使用率超过 85%,剩余空间仅 {{ $value | printf "%.1f" }}%。**建议**:请及时清理无用文件或考虑扩容,避免影响业务。- alert: Inode 资源不足expr: (node_filesystem_files_free{fstype=~"ext4|xfs"} / node_filesystem_files{fstype=~"ext4|xfs"}) * 100 < 10for: 10mlabels:severity: warningannotations:summary: "📂 Inode 资源不足 - {{ $labels.instance }} ({{ $labels.mountpoint }})"description: |实例 {{ $labels.instance }} 的挂载点 {{ $labels.mountpoint }} 的 Inode 可用率低于 10%。**风险**:即使磁盘空间足够,Inode 耗尽也会导致无法创建新文件或目录。**常见于**:大量小文件(如日志、缓存、上传目录)场景。- name: hardware-alertsrules:- alert: CPU 温度过高expr: node_hwmon_temp_celsius{sensor=~"core.*|cpu.*"} > 80for: 5mlabels:severity: warningannotations:summary: "🌡️ CPU 温度过高 - {{ $labels.instance }}"description: |实例 {{ $labels.instance }} 的 CPU 温度传感器 {{ $labels.sensor }} 当前温度为 {{ $value }}°C。**建议**:一般 CPU 安全工作温度 < 80°C,> 80°C 请检查散热与通风,> 90°C 可能触发降频保护。- alert: 硬盘温度过高expr: node_hwmon_temp_celsius{sensor=~"disk.*|sda.*|nvme.*"} > 60for: 5mlabels:severity: warningannotations:summary: "💿 硬盘温度过高 - {{ $labels.instance }}"description: |实例 {{ $labels.instance }} 的硬盘传感器 {{ $labels.sensor }} 温度为 {{ $value }}°C。**建议**:SSD/HDD 理想工作温度通常 < 50°C,> 60°C 可能影响寿命与性能,建议改善散热。
alertmanager.yml配置:
global:resolve_timeout: 5mroute:group_by: ['alertname', 'instance', 'severity']group_wait: 30sgroup_interval: 5mrepeat_interval: 1hreceiver: 'prometheusalert-receiver'receivers:- name: 'prometheusalert-receiver'webhook_configs:- url: 'http://prometheusalert:8081/prometheusalert?type=webhook&tpl=prometheus-flybook'send_resolved: trueinhibit_rules:- source_match:severity: 'critical'target_match:severity: 'warning'equal: ['alertname', 'instance']
prometheusalert-config下 PrometheusAlert.xml配置如下:
<?xml version="1.0" encoding="utf-8"?>
<Configuration><Port>8081</Port><RunMode>release</RunMode><Add key="FlyBook_Url" value="https://open.feishu.cn<webhook>" /><Add key="StaticFilePath" value="./static" /><Add key="UrlPrefix" value="/" />
</Configuration>
ssl证书:
![[图片]](https://i-blog.csdnimg.cn/direct/16191b9c0c8d4f7aaf602eab0bbb8083.png)
服务端部署:
#关闭容器
docker compose down
#快速启动容器
docker compose up -d
# 查看容器运行
docker ps
#查看docker守护进程
sudo systemctl start docker
#设置 Docker 开机自启
sudo systemctl enable docker
访问grafana、prometheus、alertmanager:
#多版本测试报告
https://<主机IP或者域名>/
#grafana仪表板
https://<主机IP或者域名>/grafana/login
#prometheus监控
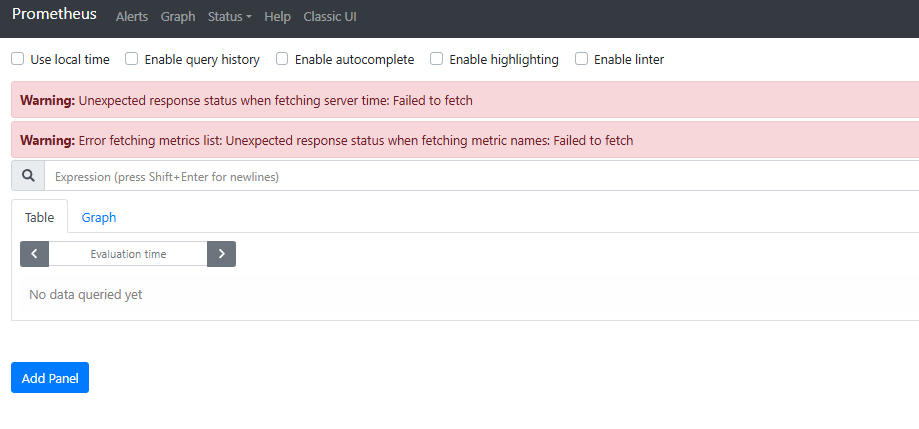
https://<主机IP或者域名>/prometheus/graph
#alertmanager告警
https://<主机IP或者域名>/alertmanager/#/alerts
到此基本监控体系就已经配置完了,持续集成后续引入jenkins用例自动通知和运行
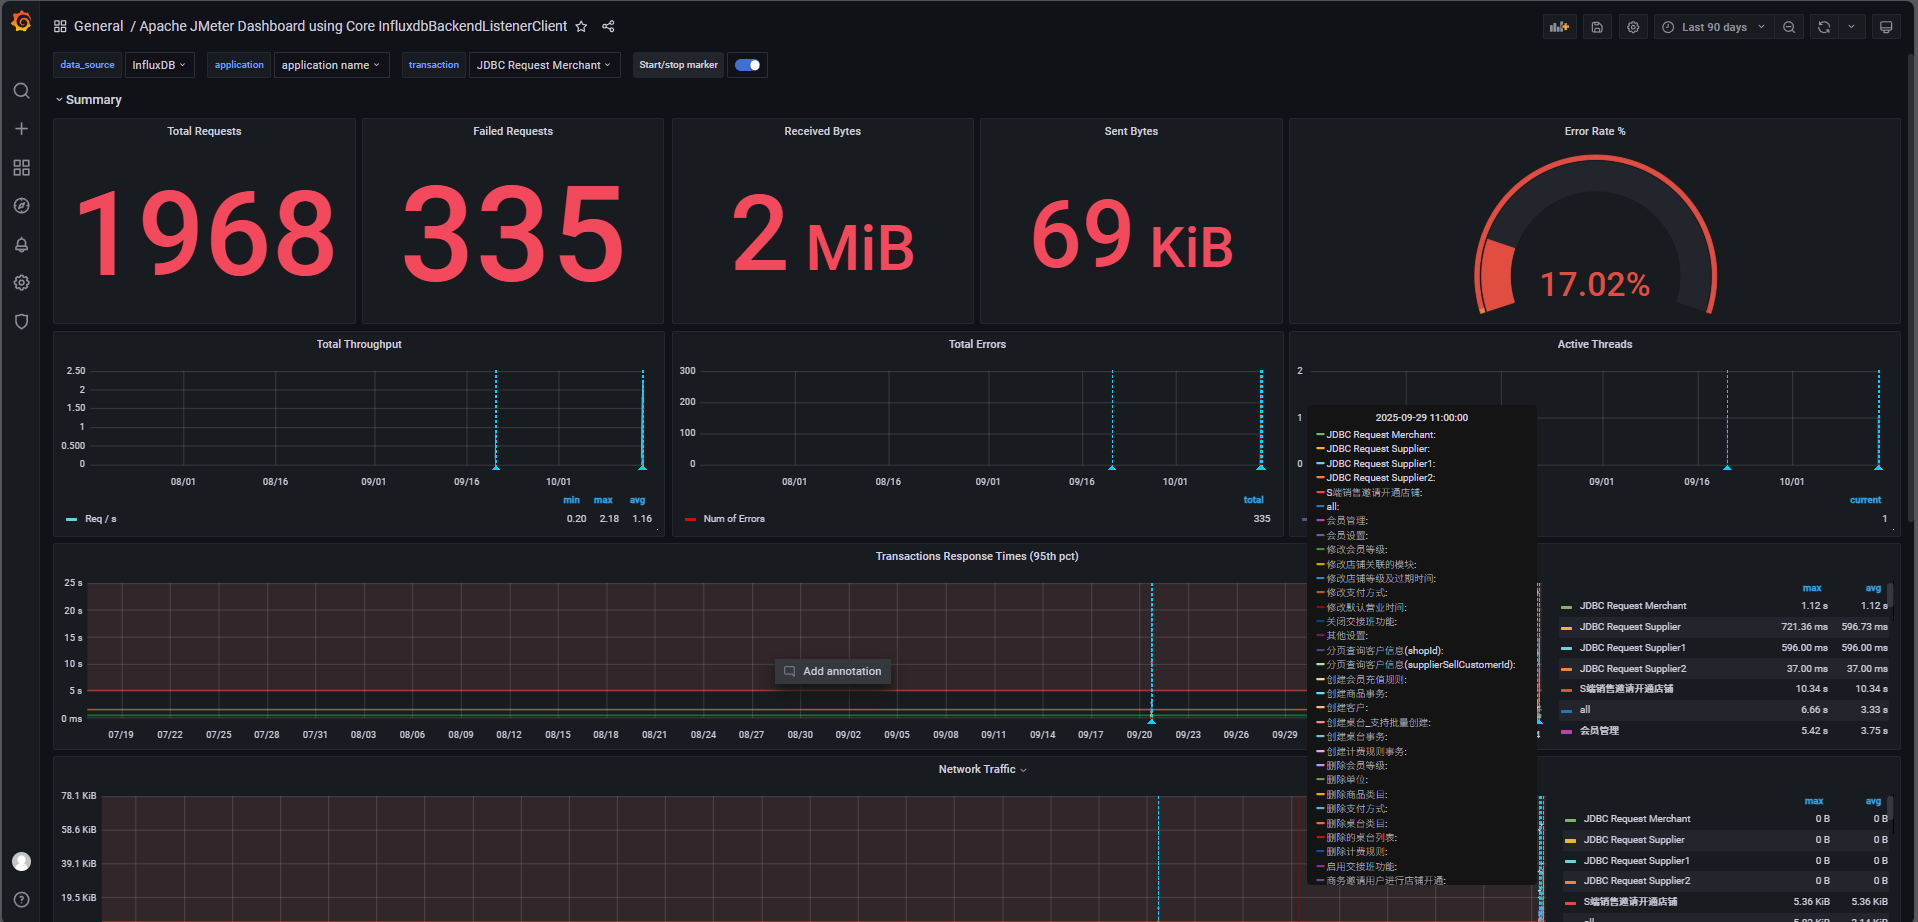
性能测试压力测试数据:
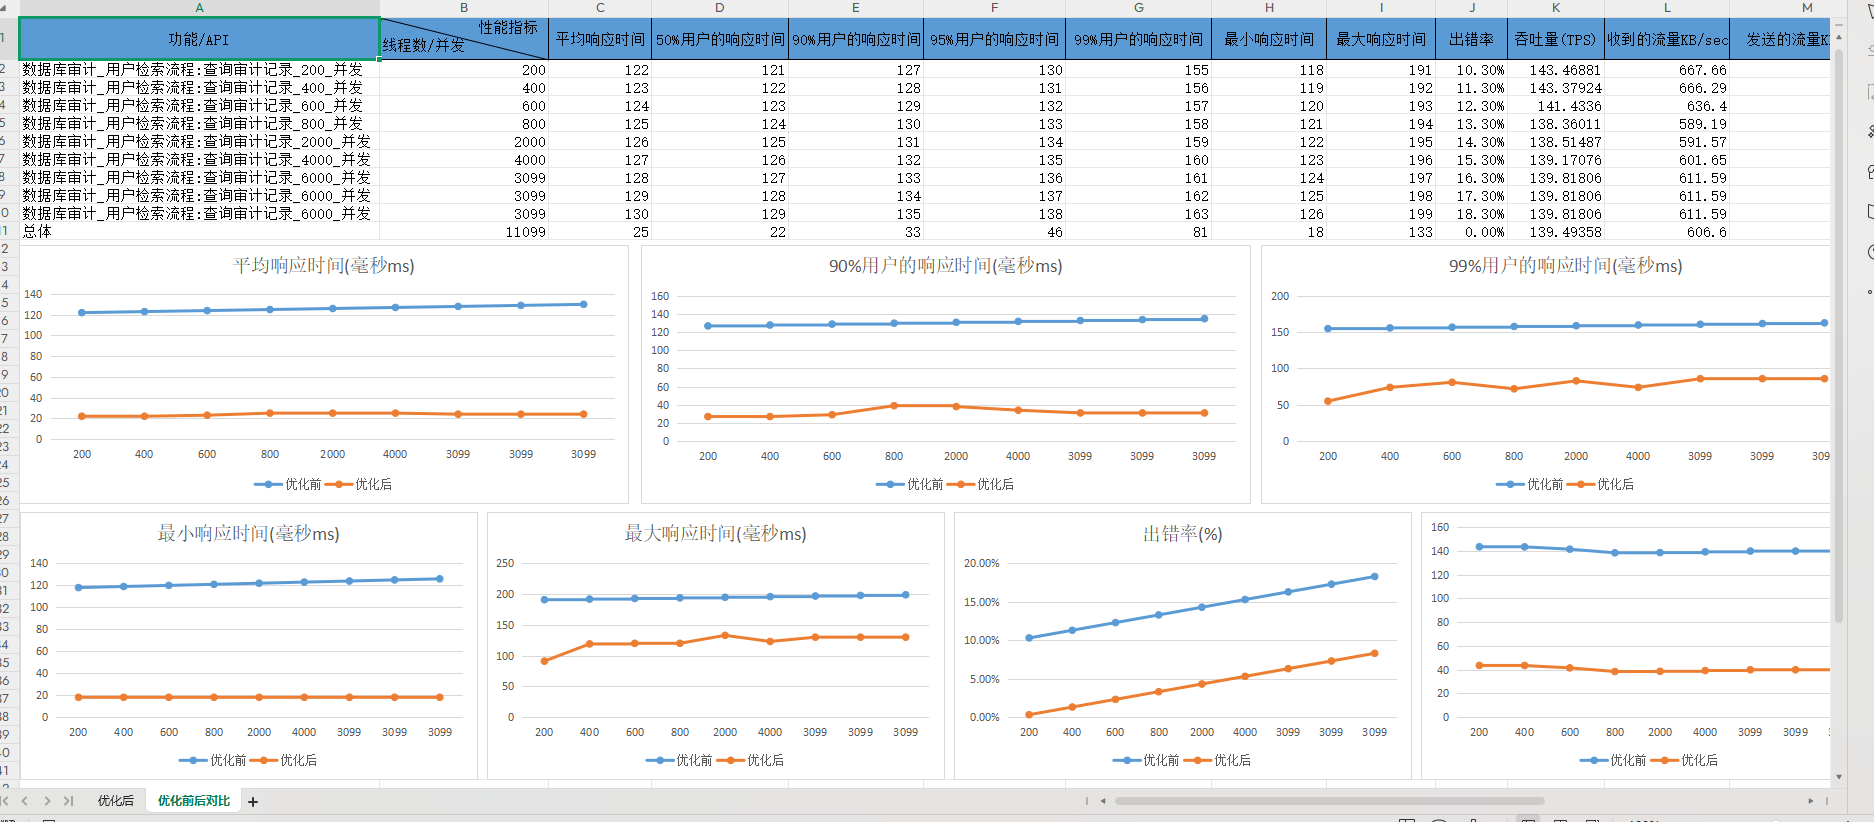
excel表格性能优化前后报告:
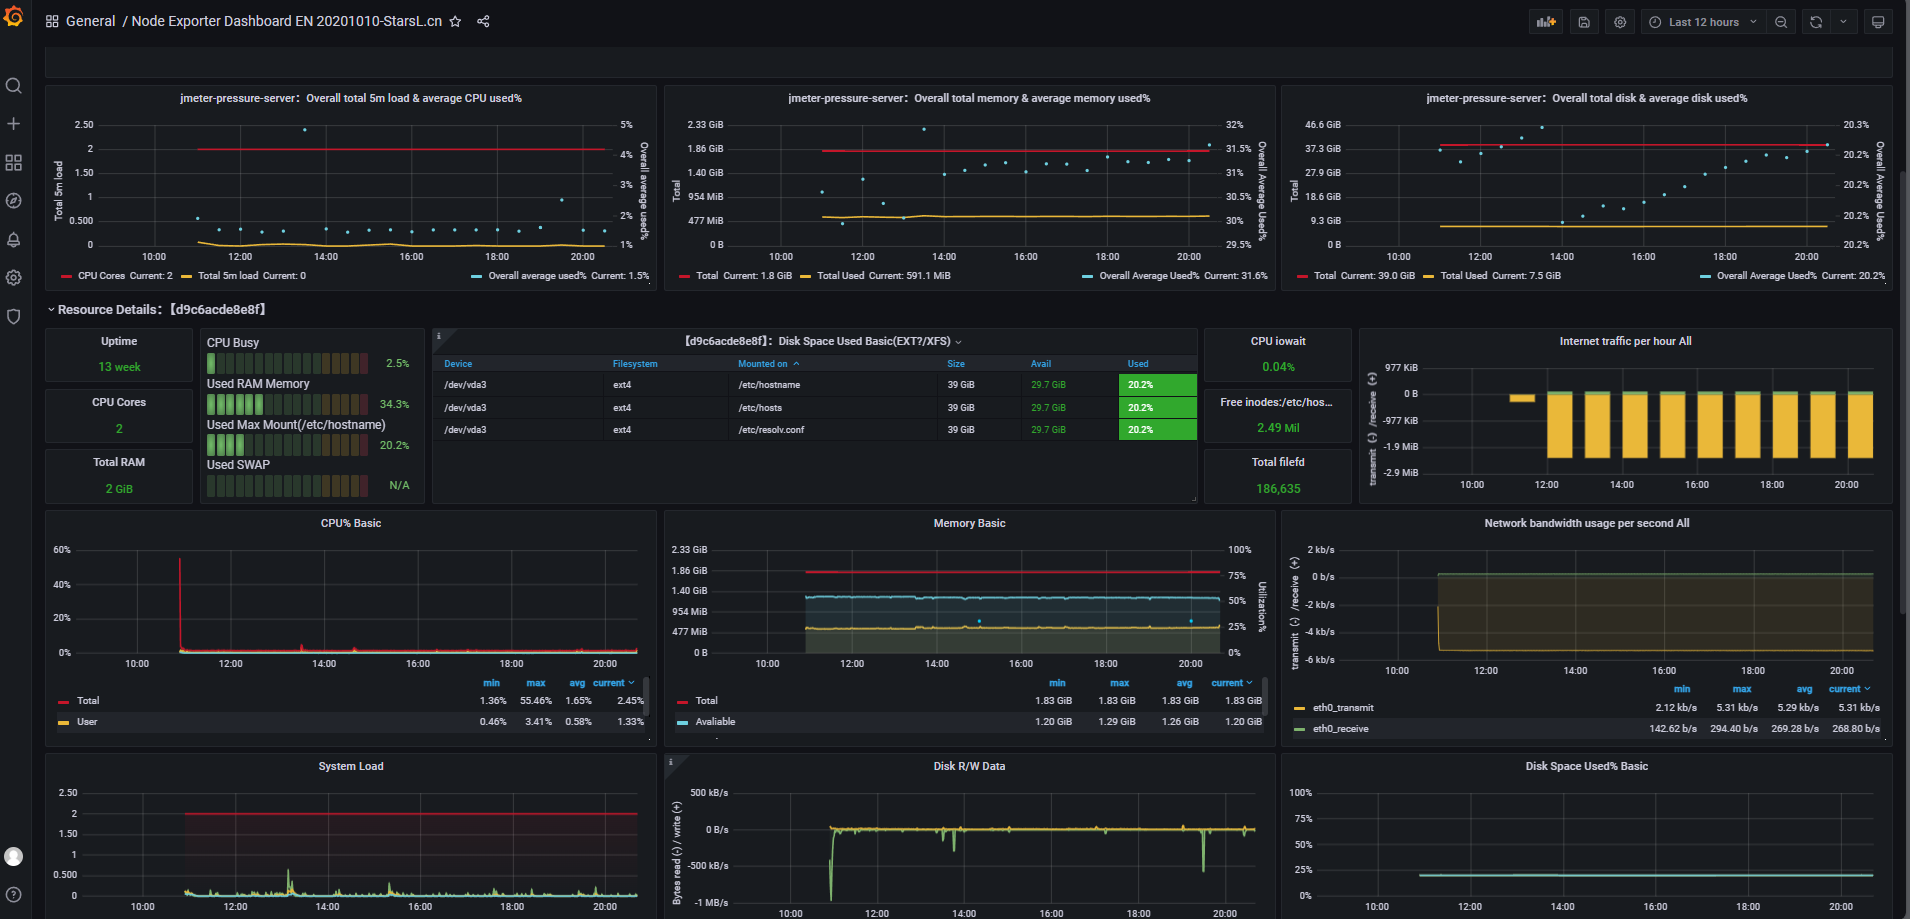
压力测试服务器端监控:
告警规则:
2. 参数说明
-n:非GUI模式(必须,生产环境压测务必使用!)。-t ${jmx_filename}:指定动态生成的JMX脚本路径(如zodance_teahouses_1.jmx)。-l ${jtl_filename}:指定结果文件(JTL格式,记录每个请求的详细数据,如test_1.jtl)。-e:压测结束后生成HTML报告(需JMeter 5.0+)。-o $TestReport/${num}:指定HTML报告的输出目录(如/root/jmeter_results/TestReport/1/)。
覆盖JMX变量的参数(通过-J传递):-Jthreads=${num}:覆盖JMX脚本中通过${__P(threads,10)}定义的线程数变量(将并发数动态注入)。-Jrampup=60:覆盖JMX中定义的Ramp-Up时间(如从0到最大并发数的过渡时间,单位:秒)。-Jduration=300:覆盖JMX中定义的压测持续时间(单位:秒)。
注意:若您的JMX脚本中未定义这些变量(如直接硬编码了线程数),则-J参数不生效,需修改JMX脚本使用${__P(threads,默认值)}格式。
3. 执行脚本
添加执行权限chmod +x Startup_Linux.sh
启动压测(脚本会遍历thread_number_array中的并发数,依次执行)
./Startup_Linux.sh
![[图片]](https://i-blog.csdnimg.cn/direct/d6be601c039d43acb06eee0354448428.png)
4. 过程监控
- 资源监控:通过top或htop命令实时查看压测机的CPU、内存、网络IO使用情况,避免压测机成为瓶颈(命令示例:
top -d 1 -c)。 - 日志监控:通过
tail -f /opt/jmeter_results/log_*.log(后续补充转换为结构化数据)实时查看JMeter执行日志,快速定位报错(如接口超时、CSV文件未找到、JMX语法错误)。 - (后续补充结构化日志)
5.输出结果
- 压测结果文件:
JTL格式(如test_1.jtl、test_3.jtl),记录每个请求的响应时间、状态码、线程信息等。 - 执行日志:记录压测过程的详细信息(如启动时间、结束时间、错误警告)。
HTML可视化报告:按并发数分目录生成(如/root/jmeter_results/TestReport/1/、/root/jmeter_results/TestReport/3/),可通过浏览器打开index.html查看聚合报告(TPS、响应时间分布、错误率等)。
此处使用Nginx反向代理服务器,将测试报告index.html文件通过公网访问(阿里云配置安全组指定IP可以访问)
根据报告对照行业标准分析是否存在性能瓶颈:书籍


阶段5:结果分析与报告输出
- 工具:JMeter聚合报告(HTML)、自定义输出Excel脚本(Python/Excel)、服务端监控(如Influxdb(Prometheus)+Grafana)。
- 关键动作:
- 基础指标提取:通过HTML报告查看TPS、平均/90%/99%响应时间、错误率。
- 深度分析:
- 检查JTL中的失败请求(筛选状态码非200的请求),分析原因(如接口返回错误信息、数据校验失败)。
- 关联服务端监控数据(如数据库慢查询、Redis命中率),定位瓶颈(如“TPS上不去因数据库索引缺失”)。
- 报告输出:生成《性能测试报告》,包含测试场景、执行环境、实际指标vs目标、问题列表及优化建议。
- 输出:性能测试报告(含结论与改进建议)、原始数据(JTL/LOG文件归档)。
如何验证inluxdb容器启动成功并且成功创建数据库db0
# 进入容器influxdb
docker exec -it aa5235f6ef17(容器id) /bin/bash
# 切换为influx命令行
influx -precision rfc3339
# 登录influx数据库进行连接
influx -username <账号> -password <密码> -database 'db0'<数据库名称> -precision rfc3339
# 查看数据库
show databases
回显如下:
name: databases
name
----
db0
_interna
当docker-compose.yml和nginx均配置好以后,可以在windows本机浏览器访问https://<域名>/influxdb/
页面是否显示为404 page not found且F12查看请求头是否带上:
#若带上下面请求头则访问成功
X-Influxdb-Build:OSS
X-Influxdb-Version:1.8.10
当把grafana+influxdb+nginx均作为容器时,grafana中的database:inifluxdb中的
![[图片]](https://i-blog.csdnimg.cn/direct/86939f242e894a9aad83441778417410.png)
![[图片]](https://i-blog.csdnimg.cn/direct/629ff9196a184766bd4ca8a2487c8bc6.png)
如何使用本地jmeter连接influxdb并调用写入接口,将性能结果数据写入influxdb数据库db0中
jmeter中添加元件:后端监听器配置:org.apache.jmeter.visualizers.backend.influx db.InfluxdbBackendListenerClient
influxdbMetricsSenderorg.apache.jmeter.visualizers.backend.influxdb.HttpMetricsSender
influxdbUrlhttps://<主机IP或者域名>/influxdb/write?db=db0
applicationapplication name
measurementjmeter
summaryOnlyfalse
samplersRegex.*
percentiles99;95;90
testTitleTest name
eventTags
注意点,influxdb1.8不支持域名+ssl证书
可以选择用http协议+公网ip
也可以选择用https协议+公网ip
注意事项:(已解决且遇到的问题)
问题1:Windows→Linux跨平台常见问题与解决方案(聚焦“转码”)
| 问题现象 | 根本原因 | 解决方案 |
|---|---|---|
| JMeter报错“Invalid char in XML”或脚本无法解析 | JMX文件含Windows换行符(\r)或非UTF-8编码的中文 | 执行 dos2unix your_script.jmx(或 sed -i 's/\r$//' your_script.jmx),用 iconv -f GBK -t UTF-8 your_script.jmx -o fixed.jmx 转换编码 |
| CSV数据未正确读取(参数值带空格/乱码) | CSV文件含多余空格或编码非UTF-8(如GBK) | 用 dos2unix 转换换行符,用 iconv 转编码(如 iconv -f GBK -t UTF-8 csv_file.csv -o fixed.csv),用 sed -i 's/ *, */,/g' 清理字段空格 |
| 中文参数传到接口后乱码(如“张三”变乱码) | JMX/CVS文件编码为GBK,Linux用UTF-8解析 | 执行 iconv -f GBK -t UTF-8 test_user.csv -o test_user_utf8.csv,更新JMX中CSV路径为转换后的文件 |
| 脚本中的中文注释显示为乱码 | JMX文件保存时编码非UTF-8 | 用 VS Code / Notepad++ 将 JMX 另存为“UTF-8无BOM”格式,再上传 |
| 执行报错“找不到文件”或“权限不足” | CSV文件未转换换行符导致Linux读取异常,或文件权限未开放 | 确保所有文件通过 dos2unix 处理,执行 chmod 644 文件名 赋予权限 |
问题2:jmeter属性变量存储均为字符串(String)类型,后续接口需要转换为intger型,数组格式等不同数据结构
解决方式:通过JSR223 预处理程序/后置处理器等编写脚本进行数据格式转化,构造出对应的数据结构
示例:itemIdArrayStr是jmeter属性变量,存储为字符串[21694,21695,21696]
后续接口(商品批量停/启售)/teashop_merchant/merchant/pms/item/update_sales请求参数如下:
{"itemIds": ${REQUEST_BODY_JSON},"isSales": 0
}
此时会因为类型不一致会报错:服务端期望是一个数组对象格式,但jmeter传参均为string类型
编写脚本进行数据格式转化
import groovy.json.JsonOutput// 1. 从全局属性拿到 itemIds 字符串(假设是 "[21694,21695,21696]")
def itemIdArrayStr = props.get("itemIdArrayStr")  // 2. 去掉首尾的 [ 和 ],得到 "21694,21695,21696"
def itemIdListStr = itemIdArrayStr.substring(1, itemIdArrayStr.length()-1)  // 3. 拼成纯 JSON 数组(注意:如果 itemId 是数字,直接写;如果是字符串,要加引号)
def requestBody = "[" + itemIdListStr + "]"  // 4. 打印调试
log.info("构造的纯数组请求体:" + requestBody)  // 5. 放到变量里,供下一个请求使用
vars.put("REQUEST_BODY_JSON", requestBody)
问题3:如何复用已存储的全局jmeter属性变(String),并且重新构造出接口指定结构和格式
示例接口:/teashop_merchant/merchant/pms/item/update_stock_manage
请求参数如下:
[{"itemId": 0,"itemName": "string","itemType": 0,"isStockManage": 0}
]
前面itemIdArrayStr属性变量中已存在[21694,21695,21696]商品id,通过JSR233脚本构造数据:
import groovy.json.JsonOutput// 获取响应
def response = prev.getResponseDataAsString()// 解析 JSON
def json = new groovy.json.JsonSlurper().parseText(response)// 提取 data 列表中的目标字段
def result = json.data.collect { item ->[itemId        : item.itemId,itemName      : item.itemName,itemType      : item.itemType,isStockManage : item.isStockManage]
}// 转为 JSON 字符串
def outputJson = JsonOutput.toJson(result)// 存入 JMeter 变量
vars.put("extractedItemsBody", outputJson)// 打印日志(调试用)
log.info("构造的请求体 JSON: " + outputJson)
问题4:在windows下CSV(已使用vscode转码为UTF-8)提取中文字符转义问题,比如需要批量创建商品,提取CSV中的中文字符后,jmeter中字符未展示为中文(显示的是json转义符)。
解决方式:更改jmeter.properties配置文件
#Preferred GUI language. Comment out to use the JVM default locale's language.
language=zh_CN
csv.dataset.encoding=UTF-8
更改jmeter.bat启动项目
rem   =====================================================setlocalset JVM_ARGS=-Dfile.encoding=UTF-8
问题5、在windows下编写的jmx脚本可以成功运行且无报错信息,更改CSV文件编码格式(UTF-8)后,上传文件到linux下,更改csv文件路径,运行Startup_Linux.sh文件,输出报错:
目前该问题问了下AI,说是上传到linux系统转码后节点路径值变了,试过AI给的方法,没有得到解决
AI提供的方式:更改编码格式(区分UTF-8和UTF-8(带bom))jmeter支持不带BOM的UTF-8(试验过无效果)
此处我推测还是编码的问题,可能是中文的问题
自己想的解决方式(可选):不通过模块控制器复用事务控制器(一系列操作),即可成功运行,但可读性会变差,脚本会变得冗余
[root@iZ2vceg7qt0bs0dl4y973bZ test_jmeterDemo]# ./Startup_Linux.sh
total 444
-rw-r--r-- 1 root root   6302 Sep 15 14:24 jmeter.log
-rw-r--r-- 1 root root     47 Sep 15 13:00 name_password.csv
-rw-r--r-- 1 root root    753 Sep 15 13:00 README.md
drwxr-xr-x 2 root root   4096 Sep 15 13:00 report
-rwxr-xr-x 1 root root   2195 Sep 15 13:47 Startup_Linux.sh
drwxr-xr-x 3 root root   4096 Sep 15 14:24 TestReport
-rw-r--r-- 1 root root 422934 Sep 15 14:34 zodance_teahouses.jmx
2025-09-15 14:35:12 - [INFO] : ---------> 自动化压测开始 <---------
2025-09-15 14:35:12 - [INFO] : 当前并发数: 1
2025-09-15 14:35:12 - [INFO] : 生成jmx压测脚本 zodance_teahouses_1.jmx
2025-09-15 14:35:12 - [INFO] : jmeter -n -t zodance_teahouses_1.jmx -l test_1.jtl -e -o TestReport/zodance_teahouses/1
WARN StatusConsoleListener The use of package scanning to locate plugins is deprecated and will be removed in a future release
WARN StatusConsoleListener The use of package scanning to locate plugins is deprecated and will be removed in a future release
WARN StatusConsoleListener The use of package scanning to locate plugins is deprecated and will be removed in a future release
WARN StatusConsoleListener The use of package scanning to locate plugins is deprecated and will be removed in a future release
Error in NonGUIDriver org.apache.jorphan.util.JMeterStopTestException: ModuleController:模块控制器 has no selected Controller (did you rename some element in the path to target controller?), test was shutdown as a consequence
An error occurred: Error in NonGUIDriver ModuleController:模块控制器 has no selected Controller (did you rename some element in the path to target controller?), test was shutdown as a consequence
2025-09-15 14:35:14 - [INFO] : ---------> 自动化压测全部结束 <---------
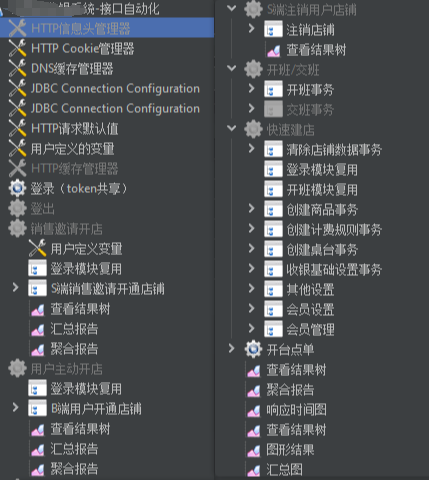
已使用的解决方式:简单控制下不能放模块控制器,控制器与控制器之间作用域是平级,故复用事务时直接用模块控制器引用即可。
![[图片]](https://i-blog.csdnimg.cn/direct/6987f472705f4870b681dfc93865ac72.png)
问题6、当存在线程组A(存在登录事务(用例定义变量和csv变量均为线程变量))和线程组B(存在登录模块控制器),当程序运行到线程组B下登录模块控制器下无法使用线程组A存储变量问题?
原因:模块控制器本质是引用执行逻辑,但是不会跨线程组使用线程组A中线程变量(线程变量:只在当前线程组使用,执行完后自动销毁),故事务里面的变量不能设置为线程组变量
解决方式:将登录事务下接口需要使用的参数等在事务同级定义且设置为Jmeter属性变量,事务内使用该全局变量即可
![[图片]](https://i-blog.csdnimg.cn/direct/902b83f3c88d41ba9e10f75934ffcb7b.png)
三、附录:关键命令速查表
| 场景 | 命令 | 说明 |
|---|---|---|
| 检查文件编码 | file 文件名 | 显示文件当前编码(如 UTF-8 / GBK) |
| 检查换行符 | cat -v 文件名 | head -n 5 | 若输出含 ^M,说明存在 Windows 换行符(\r) |
| 转换换行符(CRLF → LF) | dos2unix 文件名 或 sed -i 's/\r$//' 文件名 | 标准化换行符为 Linux 格式 |
| 转换编码(GBK → UTF-8) | iconv -f GBK -t UTF-8 原文件 -o 新文件 | 解决中文乱码问题 |
| 清理CSV字段空格 | sed -i 's/ *, */,/g' 文件名.csv | 去除逗号周围的多余空格 |
| 赋予脚本执行权限 | chmod +x 脚本名.sh | 允许执行 .sh 启动脚本 |