Prometheus监控物理服务器
Prometheus监控物理服务器
一、Prometheus介绍
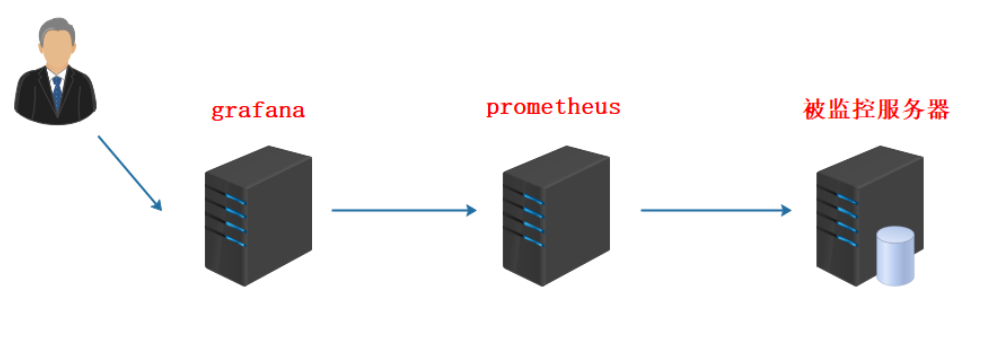
Prometheus(普罗米修斯)是一套开源的监控&报警&时间序列数据库的组合, 由go语言开发。适合监控容器平台, 因为kubernetes(俗称k8s)的流行带动了prometheus的发展。
PS:使用prometheus监控仍然监控物理服务器。
官方网站: https://prometheus.io/

二、Prometheus监控
实验环境准备
1、所有服务器静态ip(要求能上外网),所有服务器各配置主机名并绑定
//各自配置好主机名
[root@stw ~]# hostnamectl set-hostname grafana.example.com
[root@stw ~]# bash
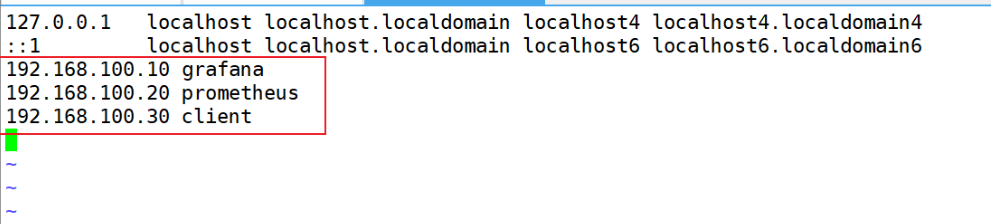
//三台都互相绑定IP与主机名
[root@grafana ~]# vim /etc/hosts
2、所有服务器时间同步(时间同步一定要做)
[root@client ~]# systemctl restart chronyd
[root@client ~]# systemctl enable chronyd
[root@client ~]# systemctl status firewalld.service
3、所有服务器关闭防火墙,selinux
[root@client ~]# systemctl status firewalld.service
● firewalld.service - firewalld - dynamic firewall daemonLoaded: loaded (/usr/lib/systemd/system/firewalld.service; disabled; vendor preset: enabled)Active: inactive (dead)Docs: man:firewalld(1)
[root@client ~]# getenforce
Disabled
安装Prometheus
下载地址: https://prometheus.io/download/ (请使用共享的软件版本,以免出现不兼容问题)
1、二进制版解压就能用,不需要编译
[root@prometheus ~]# rz -E
rz waiting to receive.
[root@prometheus ~]# ls
anaconda-ks.cfg  Downloads             Pictures                              Templates
Desktop          initial-setup-ks.cfg  prometheus-2.54.0.linux-amd64.tar.gz  Videos
Documents        Music                 Public
[root@prometheus ~]# tar -zxvf prometheus-2.54.0.linux-amd64.tar.gz -C /usr/local/
[root@prometheus ~]# cd /usr/local
[root@prometheus local]# ls
bin  games    lib    libexec                        sbin   src
etc  include  lib64  prometheus-2.54.0.linux-amd64  share
[root@prometheus ~]# mv /usr/local/prometheus-2.54.0.linux-amd64/ /usr/local/prometheus
[root@prometheus ~]# cd /usr/local/
[root@prometheus local]# ls
bin  etc  games  include  lib  lib64  libexec  prometheus  sbin  share  src
[root@prometheus local]# cd prometheus/
[root@prometheus prometheus]# ls
console_libraries  consoles  LICENSE  NOTICE  prometheus  prometheus.yml  promtool
配置文件说明
[root@prometheus ~]# cd /usr/local/prometheus/
[root@prometheus prometheus]# ls
console_libraries  consoles  LICENSE  NOTICE  prometheus  prometheus.yml  promtool
[root@prometheus prometheus]# vim prometheus.yml
2:global:                                                           //全局配置段
3:  scrape_interval:     15s                                    //每15s抓取(采集)数据一次
4:  evaluation_interval: 15s                                 //每15秒计算一次规则
8:alerting:                                                        //Alertmanager报警相关
9:  alertmanagers:
10:  - static_configs:
11:    - targets:
12:
15:rule_files:                                                   //规则文件列表
19:
21:scrape_configs:                                          //抓取的配置文件(也就是监控的实例)
23:  - job_name: 'prometheus'                                 //监控的实例名称
28:    static_configs:
29:    - targets: ['localhost:9090']                 //监控的实例IP与端口,在这里为监控服务器本身
2、直接使用默认配置文件启动, 建议加 & 后台符号并验证9090端口
[root@prometheus ~]# /usr/local/prometheus/prometheus --config.file="/usr/local/prometheus/prometheus.yml" &
[1] 10149
[root@prometheus ~]# ts=2025-10-13T10:18:40.680Z caller=main.go:601 level=info msg="No time or size retention was set so using the default time retention" duration=15d
ts=2025-10-13T10:18:40.680Z caller=main.go:645 level=info msg="Starting Prometheus Server" mode=server version="(version=2.54.0, branch=HEAD, revision=5354e87a70d3eb26b81b601b286d66ff983990f6)"
......
......
ts=2025-10-13T10:18:41.113Z caller=manager.go:164 level=info component="rule manager" msg="Starting rule manager..."[root@prometheus ~]# netstat -ntlup | grep :9090
tcp6       0      0 :::9090                 :::*                    LISTEN      10149/prometheus
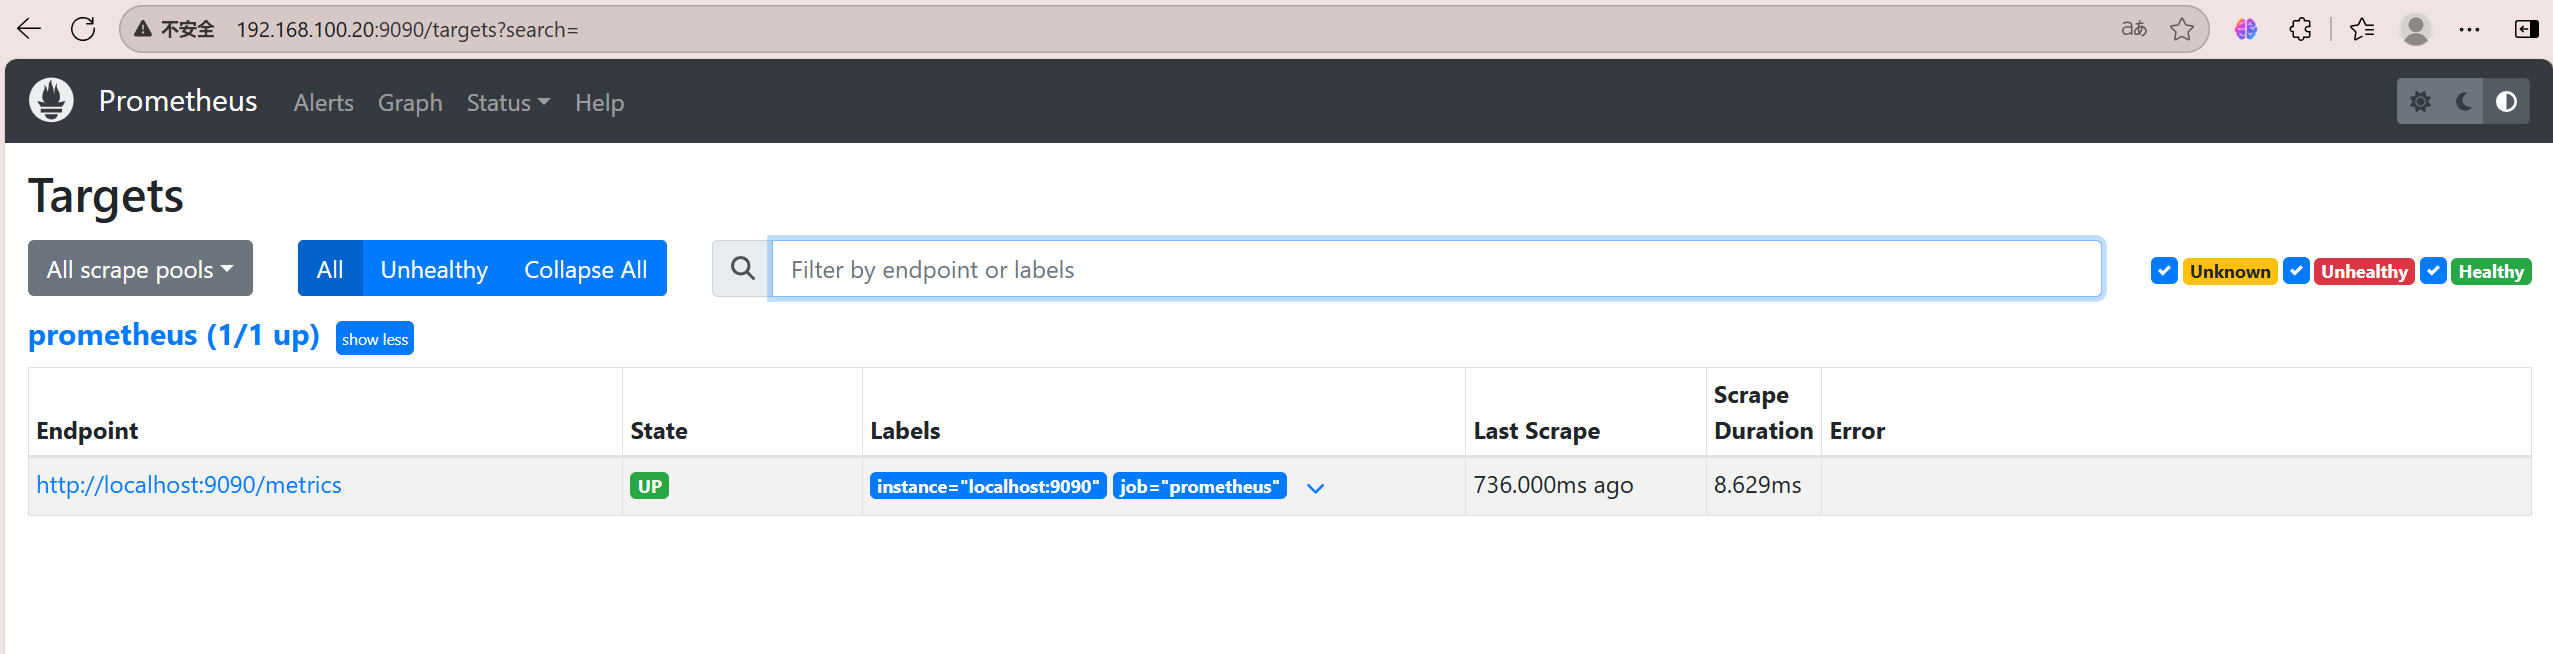
3、通过浏览器访问http://服务器IP:9090就可以访问到prometheus的主界面
(1) 点Status—>点Targets—>可以看到只监控了本机 (默认只监控了本机一台)
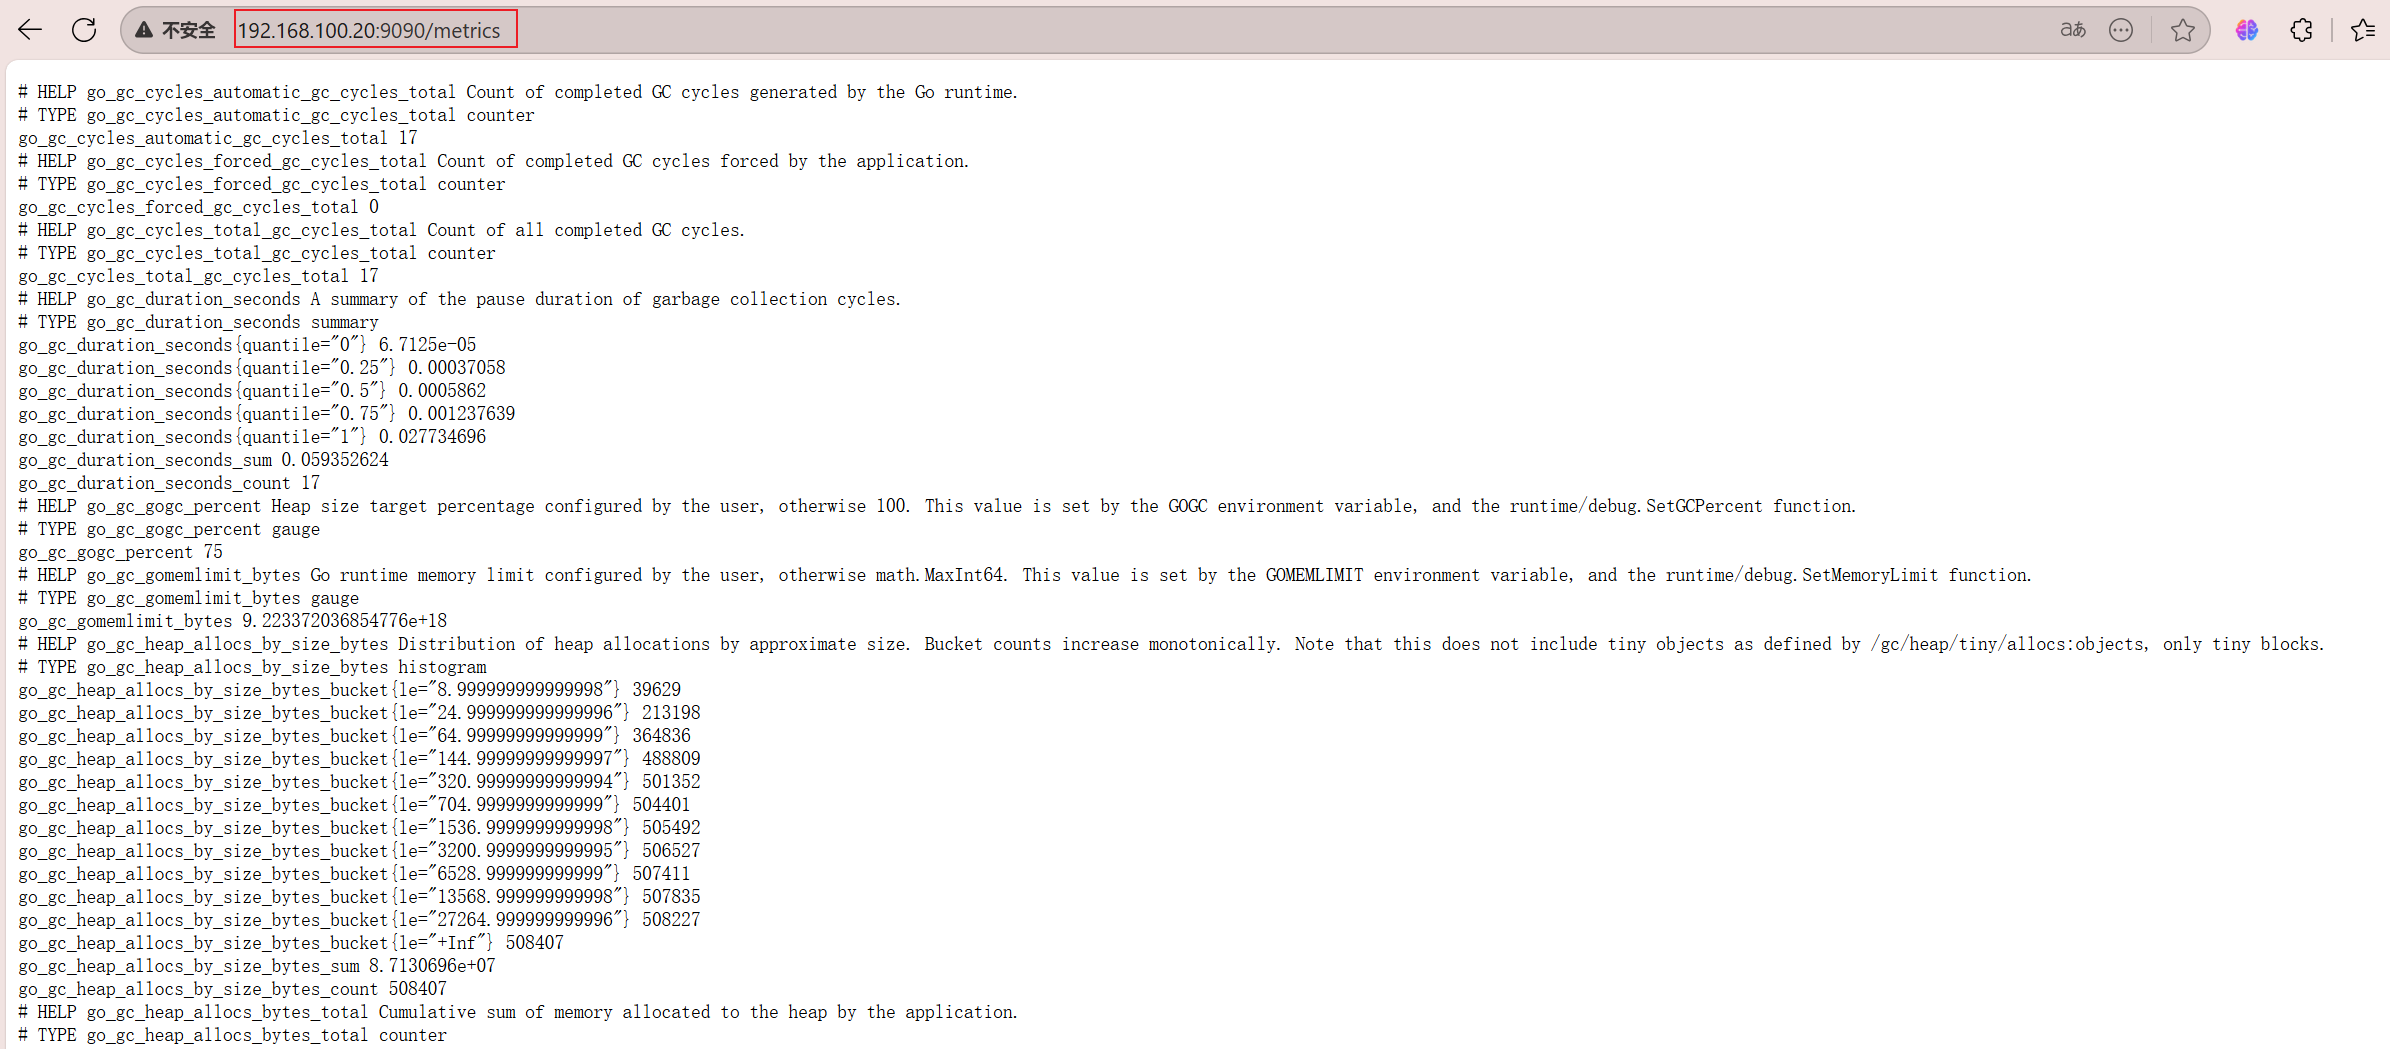
4、 通过http://服务器IP:9090/metrics可以查看到监控的数据
说明: 这里的metrics你可以类比成zabbix里的监控项
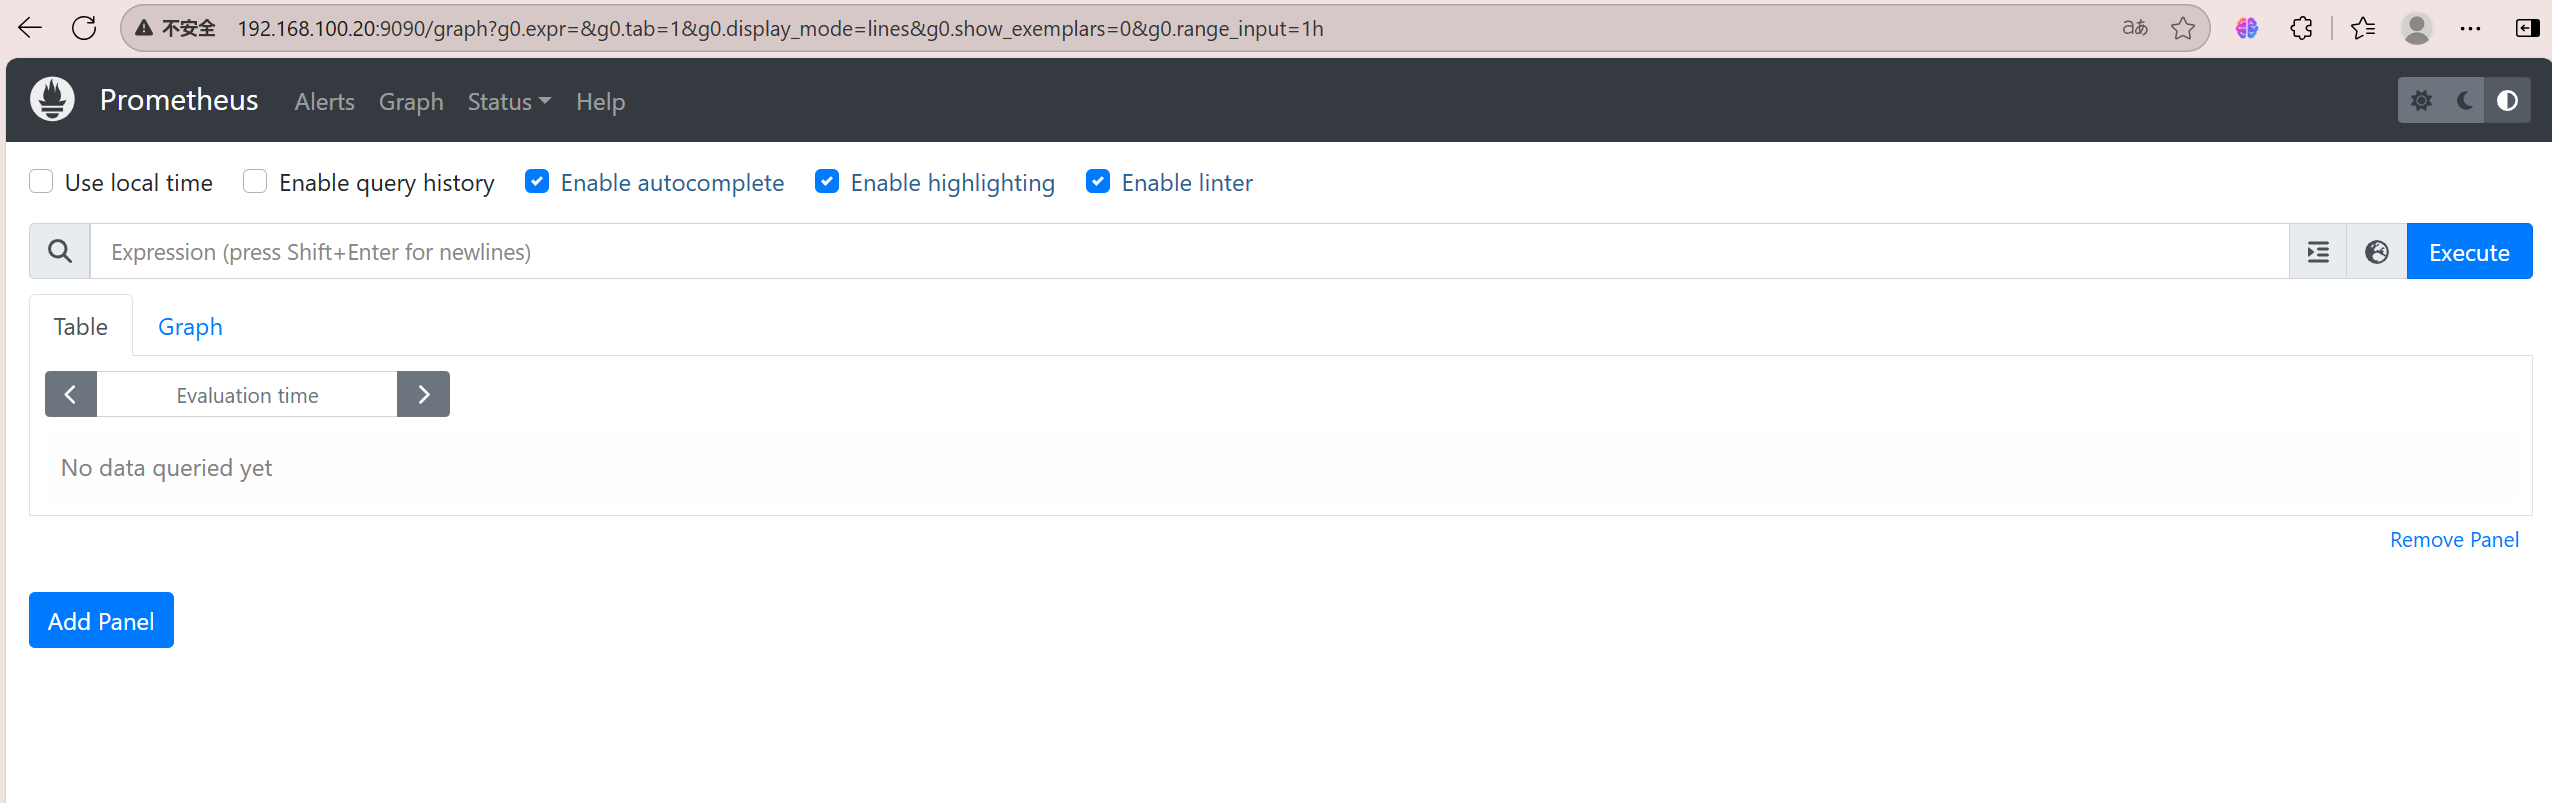
5、在web主界面可以通过关键字查询metrics, 并显示图形
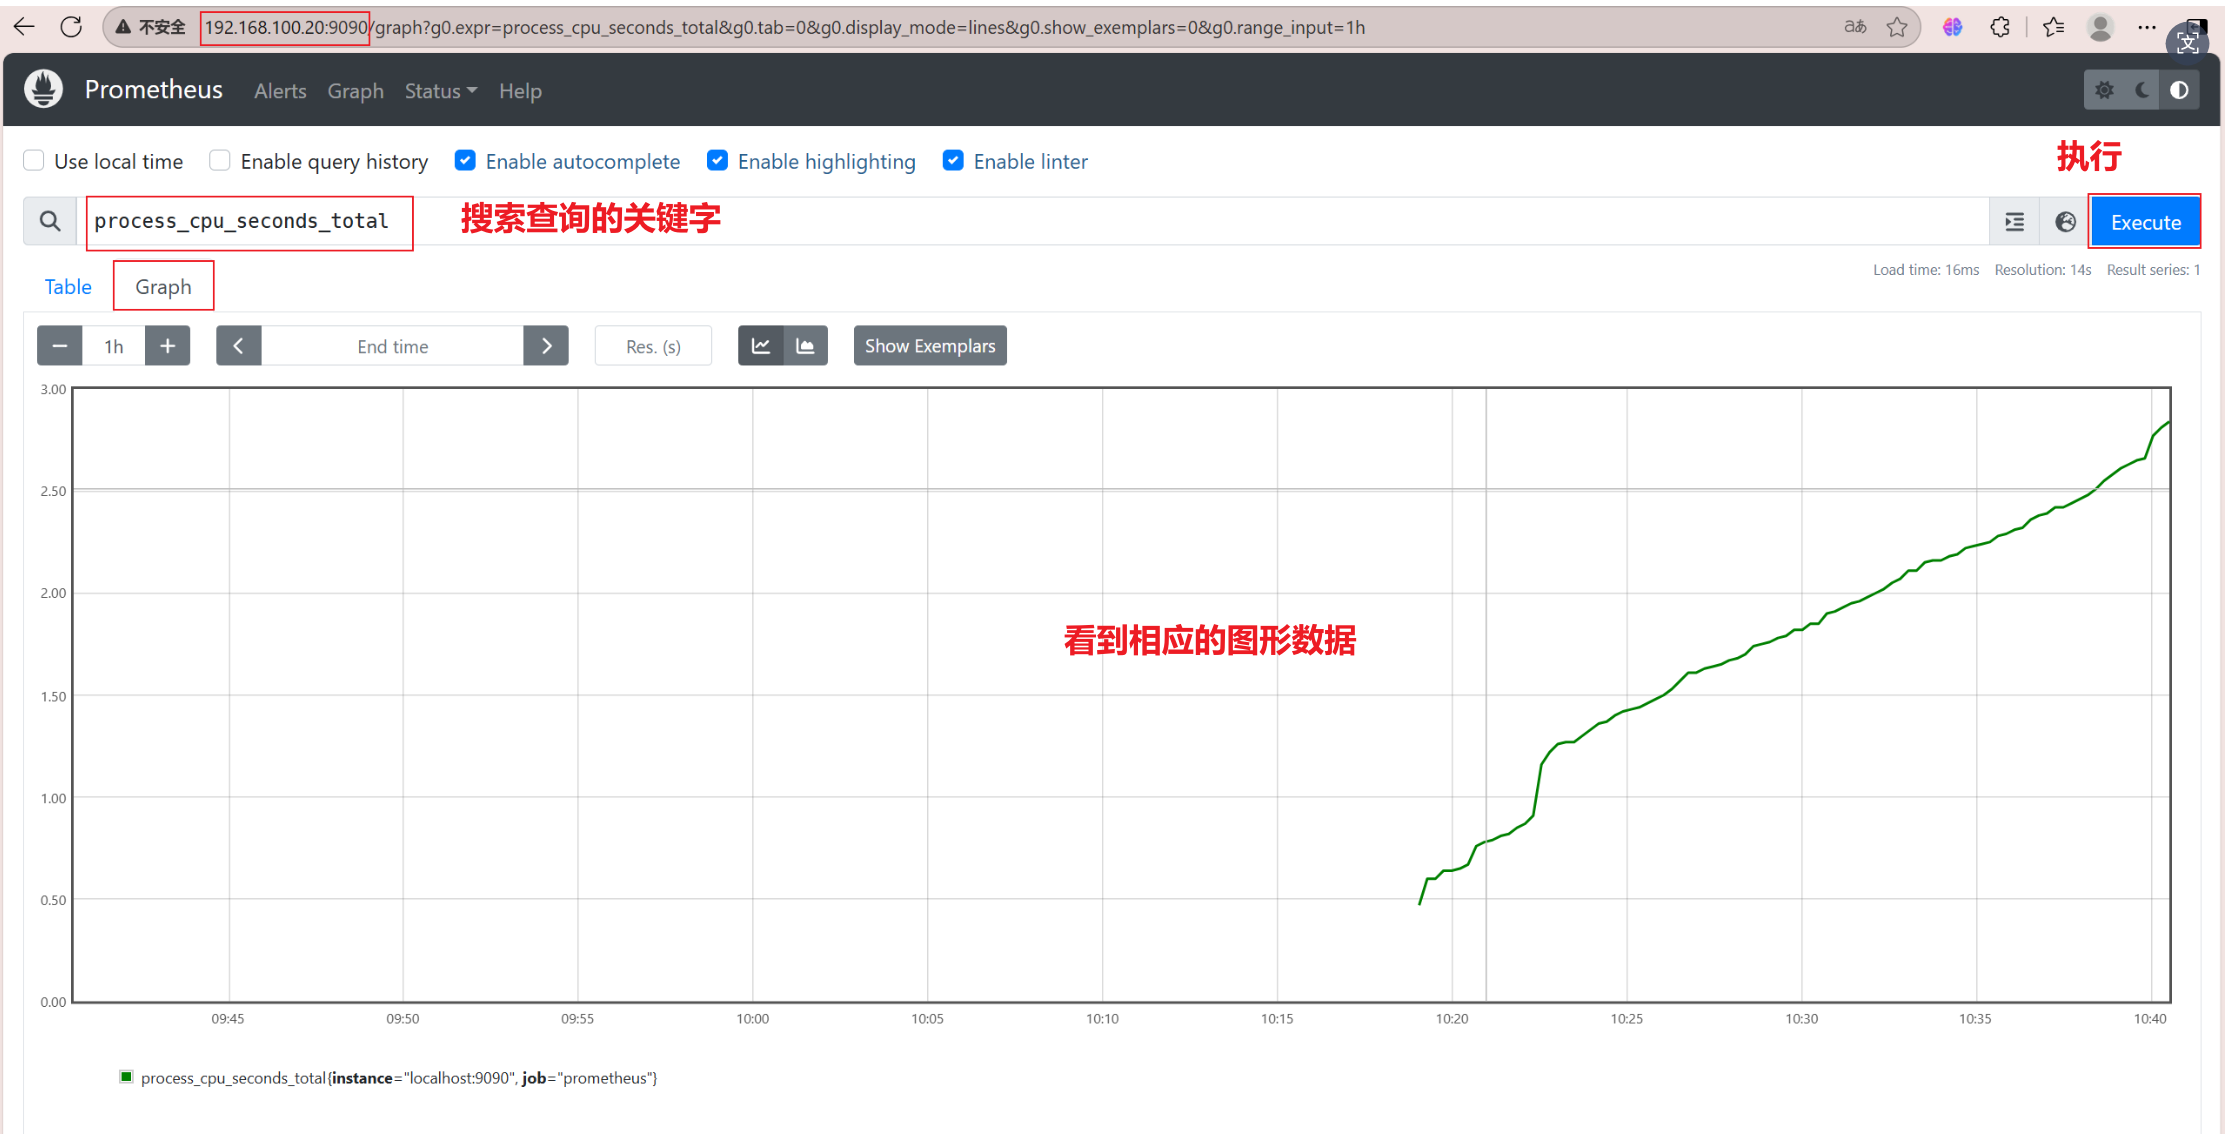
虽然prometheus服务器通过9090端口能监控一些metrics,但像cpu负载等这些linux常见的监控项却没有,需要node_exporter组件。
node_exporter组件可以安装在本机或远程linux主机上
监控远程linux主机
1、在远程linux主机(被监控端agent1)上安装node_exporter组件
下载地址: https://prometheus.io/download/ (请使用共享的软件版本,以免出现不兼容问题)
[root@client ~]# rz -E
rz waiting to receive.
[root@client ~]# ls
anaconda-ks.cfg  Downloads             node_exporter-1.8.2.linux-amd64.tar.gz  Templates
Desktop          initial-setup-ks.cfg  Pictures                                Videos
Documents        Music                 Public
[root@client ~]# tar -xzvf node_exporter-1.8.2.linux-amd64.tar.gz -C /usr/local/
node_exporter-1.8.2.linux-amd64/
node_exporter-1.8.2.linux-amd64/NOTICE
node_exporter-1.8.2.linux-amd64/node_exporter
node_exporter-1.8.2.linux-amd64/LICENSE
[root@client ~]# mv /usr/local/node_exporter-1.8.2.linux-amd64/ /usr/local/node_exporter
[root@client ~]# ls /usr/local/node_exporter/
LICENSE  node_exporter  NOTICE
2、启动node_exporter, 并验证端口
[root@client ~]# nohup /usr/local/node_exporter/node_exporter &
[1] 10441
[root@client ~]# nohup: ignoring input and appending output to ‘nohup.out’[root@client ~]# netstat -ntlup | grep 9100
tcp6       0      0 :::9100                 :::*                    LISTEN      10441/node_exporter
说明: 如果把启动node_exporter的终端给关闭,那么进程也可能会随之关闭。nohup命令可以挂起在后台,除非杀掉相关进程,否则不会随终端关闭而关闭进程。
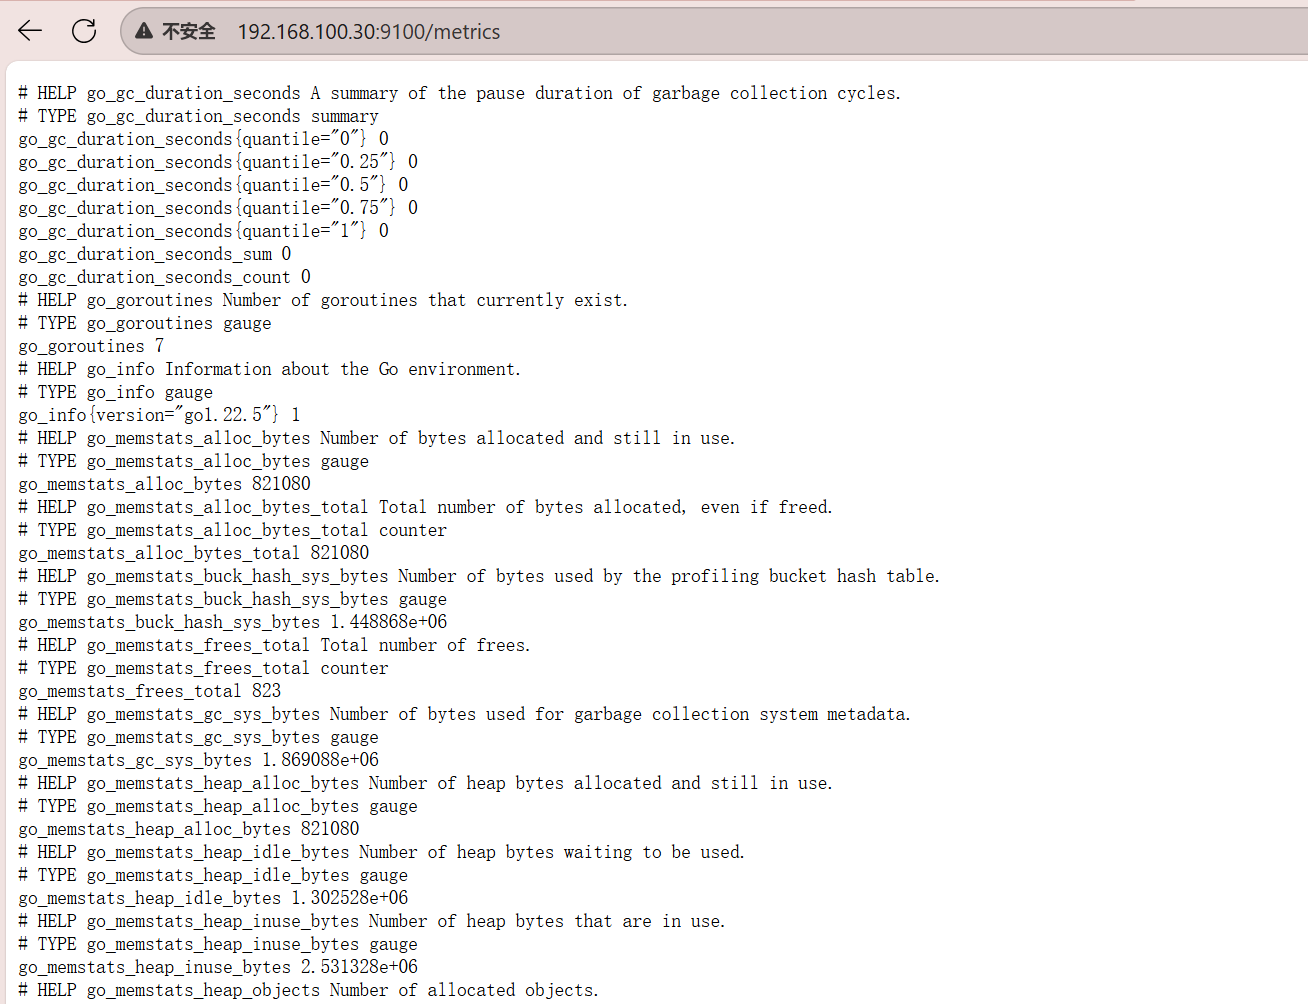
3、浏览器访问http://被监控端IP:9100/metrics就可以查看到node_exporter在被监控端收集的metrics
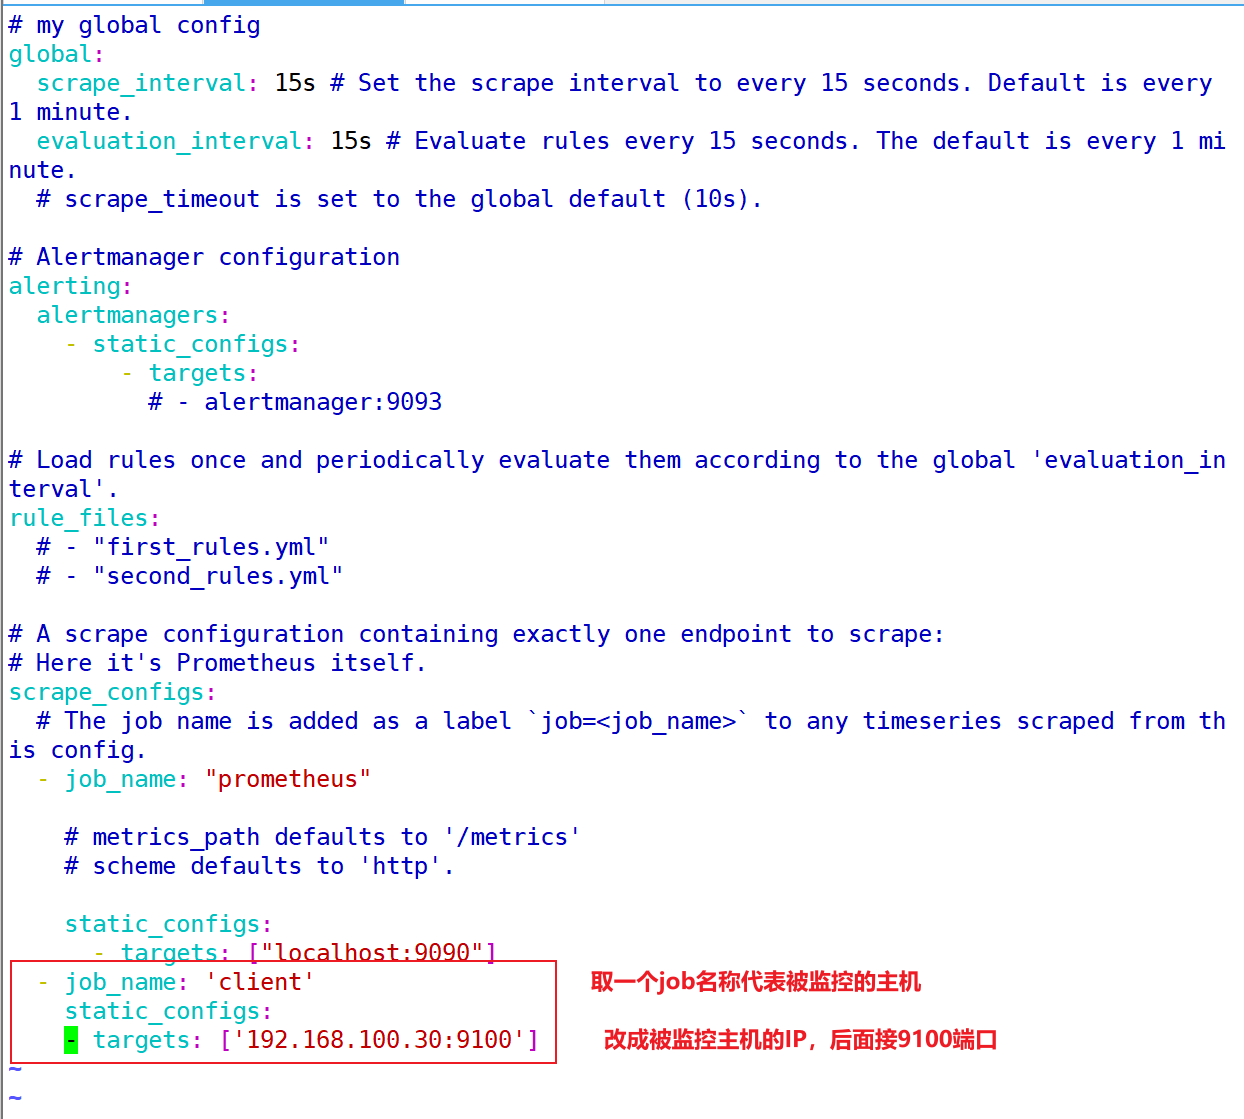
4、回到prometheus服务器的配置文件里添加被监控机器的配置段
说明: 其它都不变,只添加了最后3行配置.注意YAML格式要求
[root@prometheus ~]# cd /usr/local/prometheus/
[root@prometheus prometheus]# ls
console_libraries  consoles  LICENSE  NOTICE  prometheus  prometheus.yml  promtool
[root@prometheus prometheus]# vim prometheus.yml
5、改完配置文件后,重启服务
说明: 没有服务脚本,直接kill杀掉进程,再重启即可。(或者kill -HUP PID)
[root@prometheus ~]# pkill prometheus
[root@prometheus ~]# netstat -ntlup | grep 9090        //确认端口没有进程占用
[root@prometheus ~]# /usr/local/prometheus/prometheus --config.file="/usr/local/prometheus/prometheus.yml" &
[1] 10648
[root@prometheus ~]# ts=2025-10-13T10:59:25.563Z caller=main.go:601 level=info msg="No time or size retention was set so using the default time retention" duration=15d
ts=2025-10-13T10:59:25.563Z caller=main.go:645 level=info msg="Starting Prometheus Server" mode=server version="(version=2.54.0, branch=HEAD, revision=5354e87a70d3eb26b81b601b286d66ff983990f6)"
......
......
ts=2025-10-13T10:59:26.424Z caller=main.go:1145 level=info msg="Server is ready to receive web requests."
ts=2025-10-13T10:59:26.424Z caller=manager.go:164 level=info component="rule manager" msg="Starting rule manager..."[root@prometheus ~]# netstat -ntlup | grep 9090       //确认端口被占用,说明重启成功
tcp6       0      0 :::9090                 :::*                    LISTEN      10648/prometheus
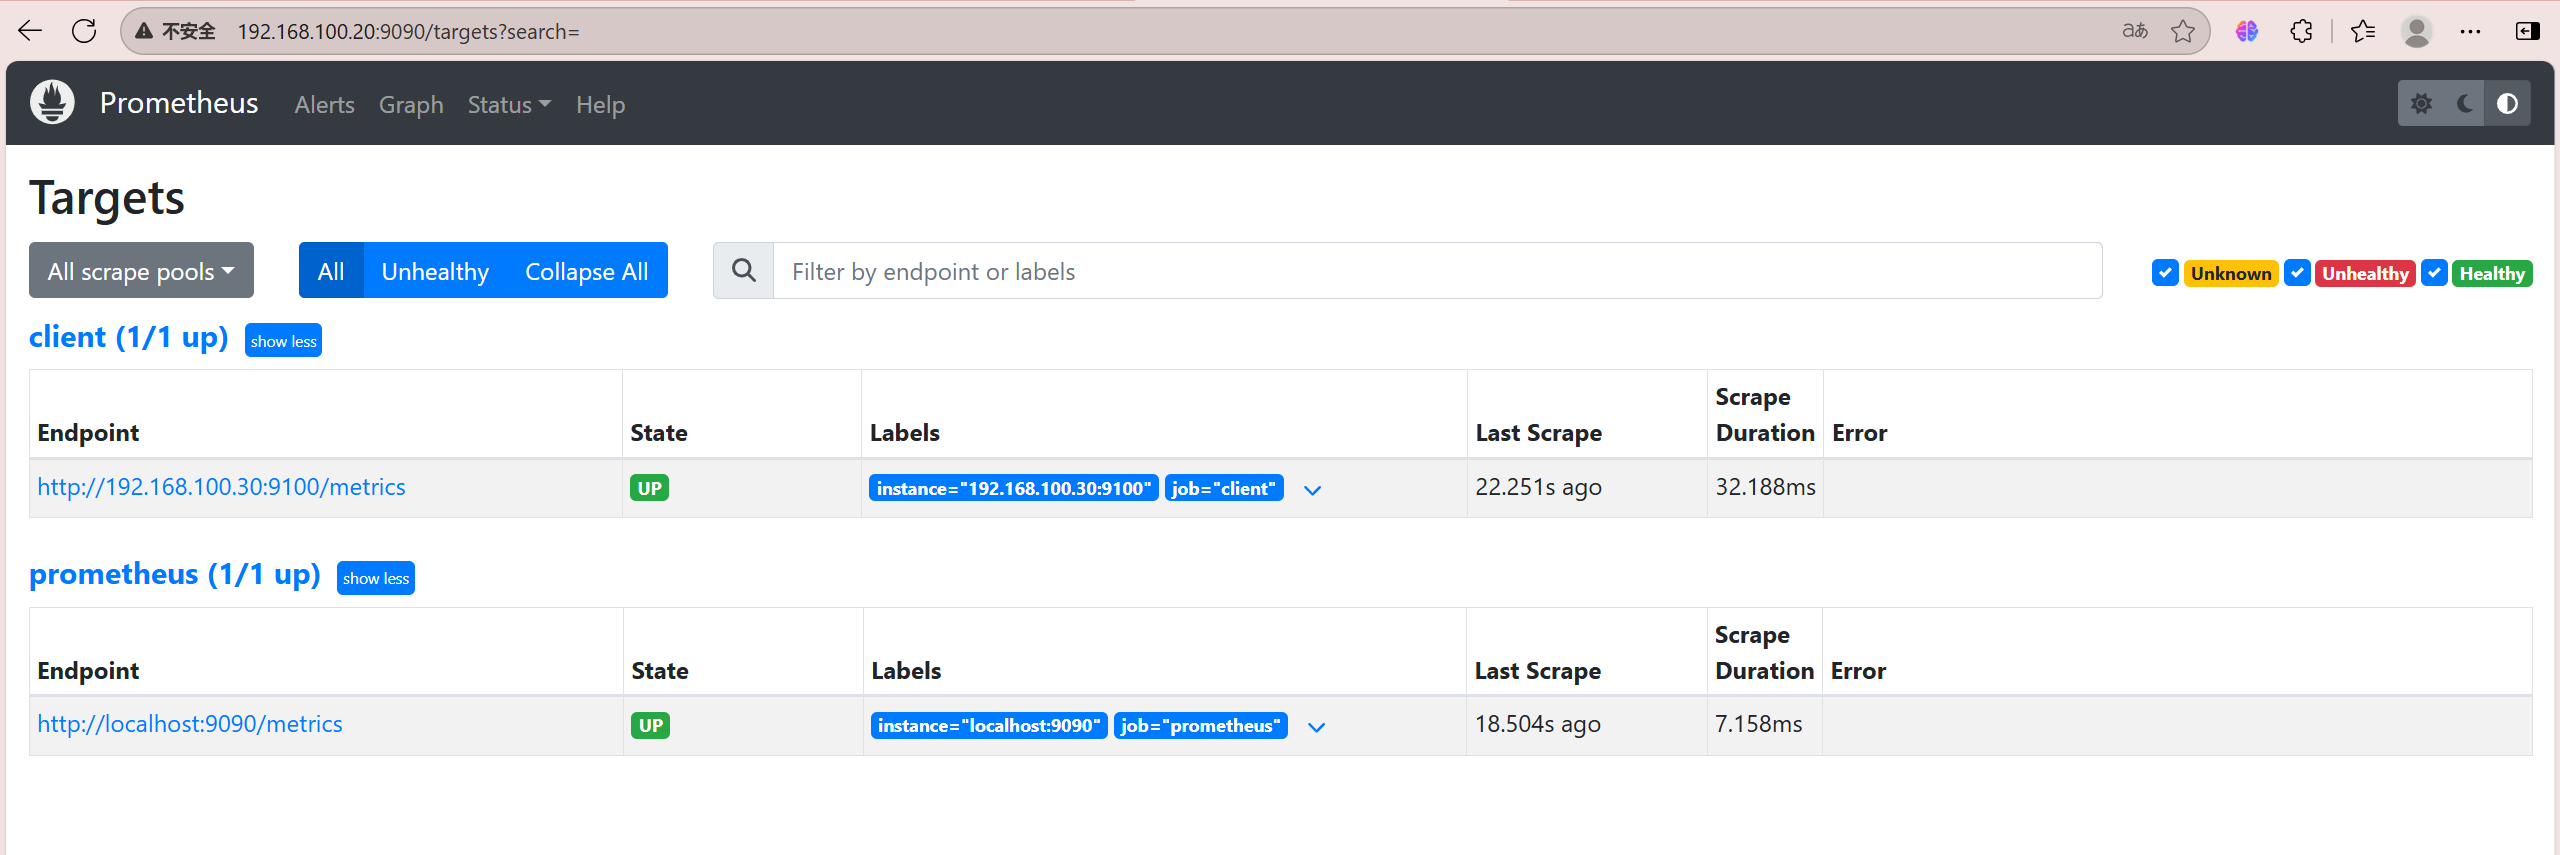
6、回到web管理界面 —>点Status —>点Targets —>可以看到多了一台监控目标
(远程监控client成功)
练习:
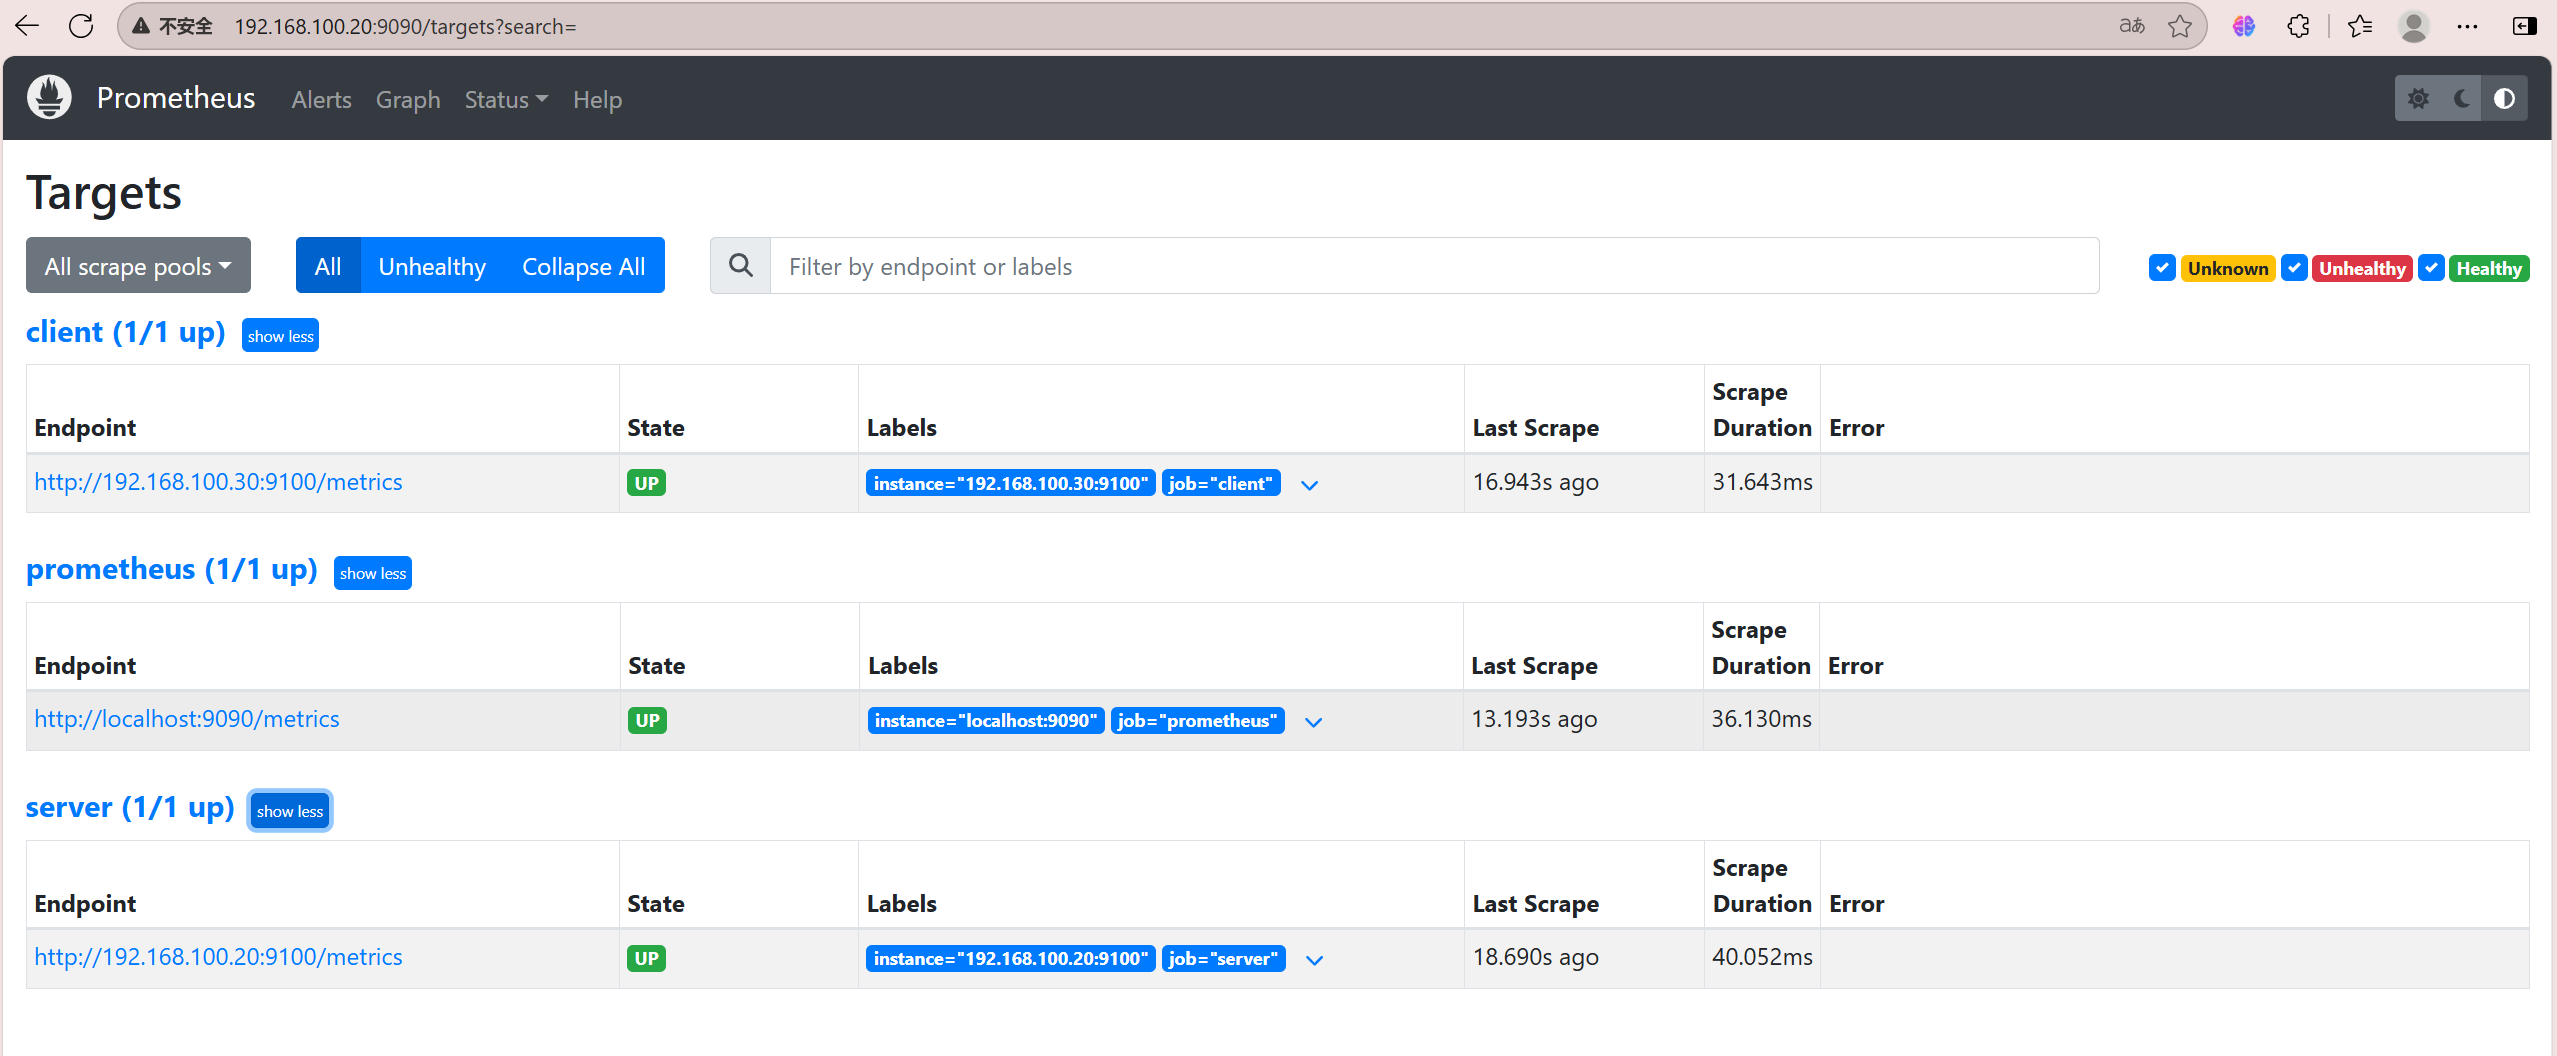
前面实现了prometheus监控本机9090, 但是还有很多metrics无法监控,比如cpu负载信息等。这个时候我们在prometheus服务器上也安装node_exporter,并监控
[root@prometheus ~]# rz -E
rz waiting to receive.
[root@prometheus ~]# ls
anaconda-ks.cfg  initial-setup-ks.cfg                    Public
data             Music                                   Templates
Desktop          node_exporter-1.8.2.linux-amd64.tar.gz  Videos
Documents        Pictures
Downloads        prometheus-2.54.0.linux-amd64.tar.gz
[root@prometheus ~]# tar -xzvf node_exporter-1.8.2.linux-amd64.tar.gz -C /usr/local/
node_exporter-1.8.2.linux-amd64/
node_exporter-1.8.2.linux-amd64/NOTICE
node_exporter-1.8.2.linux-amd64/node_exporter
node_exporter-1.8.2.linux-amd64/LICENSE
[root@prometheus ~]# mv /usr/local/node_exporter-1.8.2.linux-amd64/ /usr/local/node_exporter
[root@prometheus ~]# ls /usr/local/node_exporter/
LICENSE  node_exporter  NOTICE
[root@prometheus ~]# netstat -ntlup | grep 9100
[root@prometheus ~]# nohup /usr/local/node_exporter/node_exporter &
[2] 10818
[root@prometheus ~]# nohup: ignoring input and appending output to ‘nohup.out’[root@prometheus ~]# netstat -ntlup | grep 9100
tcp6       0      0 :::9100                 :::*                    LISTEN      10818/node_exporter
[root@prometheus ~]# vim /usr/local/prometheus/
[root@prometheus ~]# vim /usr/local/prometheus/prometheus.yml
[root@prometheus ~]# pkill prometheus
[root@prometheus ~]# netstat -ntlup | grep 9090
[root@prometheus ~]# /usr/local/prometheus/prometheus --config.file="/usr/local/prometheus/prometheus.yml" &
[3] 10924
[root@prometheus ~]# netstat -ntlup | grep 9090
tcp6 0 0 :::9090 :::* LISTEN 10924/prometheus 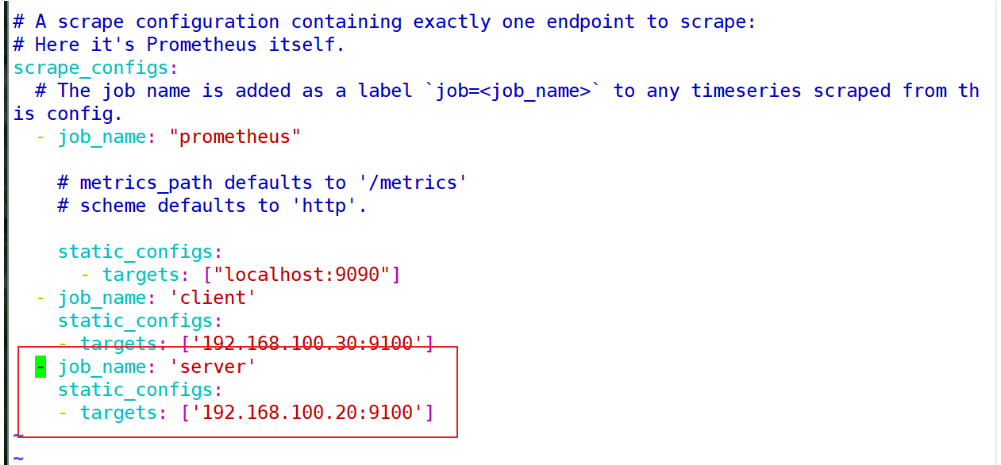
监控远程mysql
1、在被管理机agent1上安装mysqld_exporter组件
下载地址: https://prometheus.io/download/ (请使用共享的软件版本,以免出现不兼容问题)
[root@client ~]# rz -E
rz waiting to receive.
[root@client ~]# ls
anaconda-ks.cfg  initial-setup-ks.cfg                       nohup.out  Videos
Desktop          Music                                      Pictures
Documents        mysqld_exporter-0.15.1.linux-amd64.tar.gz  Public
Downloads        node_exporter-1.8.2.linux-amd64.tar.gz     Templates
[root@client ~]# tar -zxvf mysqld_exporter-0.15.1.linux-amd64.tar.gz -C /usr/local/
mysqld_exporter-0.15.1.linux-amd64/
mysqld_exporter-0.15.1.linux-amd64/LICENSE
mysqld_exporter-0.15.1.linux-amd64/mysqld_exporter
mysqld_exporter-0.15.1.linux-amd64/NOTICE
[root@client ~]# mv /usr/local/mysqld_exporter-0.15.1.linux-amd64/ /usr/local/mysql_exporter
[root@client ~]# ls /usr/local/mysql_exporter/
LICENSE  mysqld_exporter  NOTICE
2、在client上安装mariadb并启动,用于被监控
[root@client ~]# cd /etc/yum.repos.d/
[root@client yum.repos.d]# ls
CentOS-Base.repo  CentOS-Debuginfo.repo  CentOS-Media.repo    CentOS-Vault.repo
CentOS-CR.repo    CentOS-fasttrack.repo  CentOS-Sources.repo
[root@client yum.repos.d]# rm -rf *
[root@client yum.repos.d]# vim server.repo
[root@client yum.repos.d]# mount /dev/cdrom /mnt
mount: /dev/sr0 is write-protected, mounting read-only
[root@client yum.repos.d]# cd
[root@client ~]# yum -y install mariadb-server
[root@client ~]# systemctl restart mariadb
[root@client ~]# systemctl enable mariadb
3、授权
说明: 授权ip为localhost,因为不是prometheus服务器来直接找mariadb获取数据,而是prometheus服务器找mysqld_exporter,mysqld_exporter再找mariadb。所以这个localhost是指的mysql_exporter的IP
[root@client ~]# mysql
Welcome to the MariaDB monitor.  Commands end with ; or \g.
Your MariaDB connection id is 2
Server version: 5.5.60-MariaDB MariaDB ServerCopyright (c) 2000, 2018, Oracle, MariaDB Corporation Ab and others.Type 'help;' or '\h' for help. Type '\c' to clear the current input statement.MariaDB [(none)]> grant all ON *.* to 'mysql_monitor'@'localhost' identified by '123';
Query OK, 0 rows affected (0.00 sec)MariaDB [(none)]> flush privileges;
Query OK, 0 rows affected (0.00 sec)MariaDB [(none)]> quit
Bye
4、创建连接mariadb配置文件
说明: 配置文件里写上连接mariadb的用户名与密码(和上面的授权的用户名和密码要对应)
[root@client ~]# vim /usr/local/mysql_exporter/.my.cnf
[root@client local]# cat /usr/local/mysql_exporter/.my.cnf
[client]
user=mysql_monitor
password=123
5、启动mysqld_exporter并验证9104端口
[root@client local]# nohup /usr/local/mysql_exporter/mysqld_exporter --config.my-cnf=/usr/local/mysql_exporter/.my.cnf &
[2] 59091
[root@client local]# nohup: ignoring input and appending output to ‘nohup.out’[root@client local]# netstat -ntlup | grep 9104
tcp6       0      0 :::9104                 :::*                    LISTEN      59091/mysqld_export
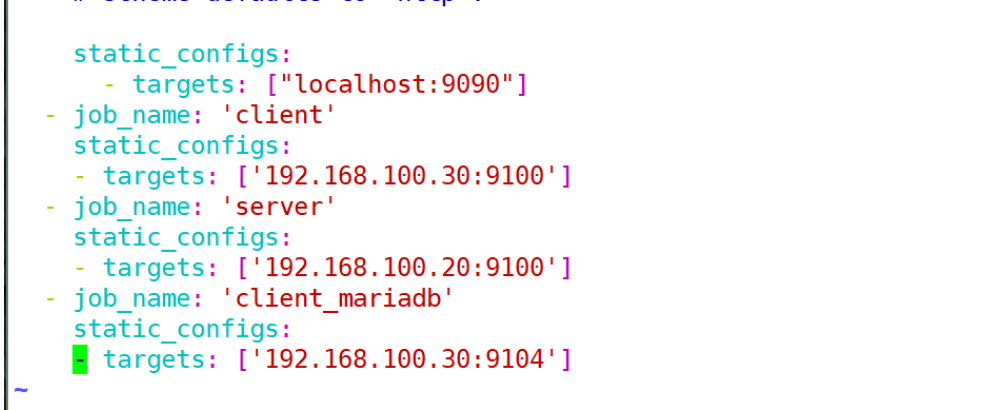
6、回到prometheus服务器的配置文件里添加被监控的mariadb的配置段
[root@prometheus ~]# vim /usr/local/prometheus/prometheus.yml
7、重启服务
[root@prometheus ~]# pkill prometheus
[root@prometheus ~]# netstat -ntlup | grep 9090
[root@prometheus ~]# /usr/local/prometheus/prometheus --config.file="/usr/local/prometheus/prometheus.yml" &
[root@prometheus ~]# netstat -ntlup | grep 9090
tcp6       0      0 :::9090                 :::*                    LISTEN      58673/prometheus
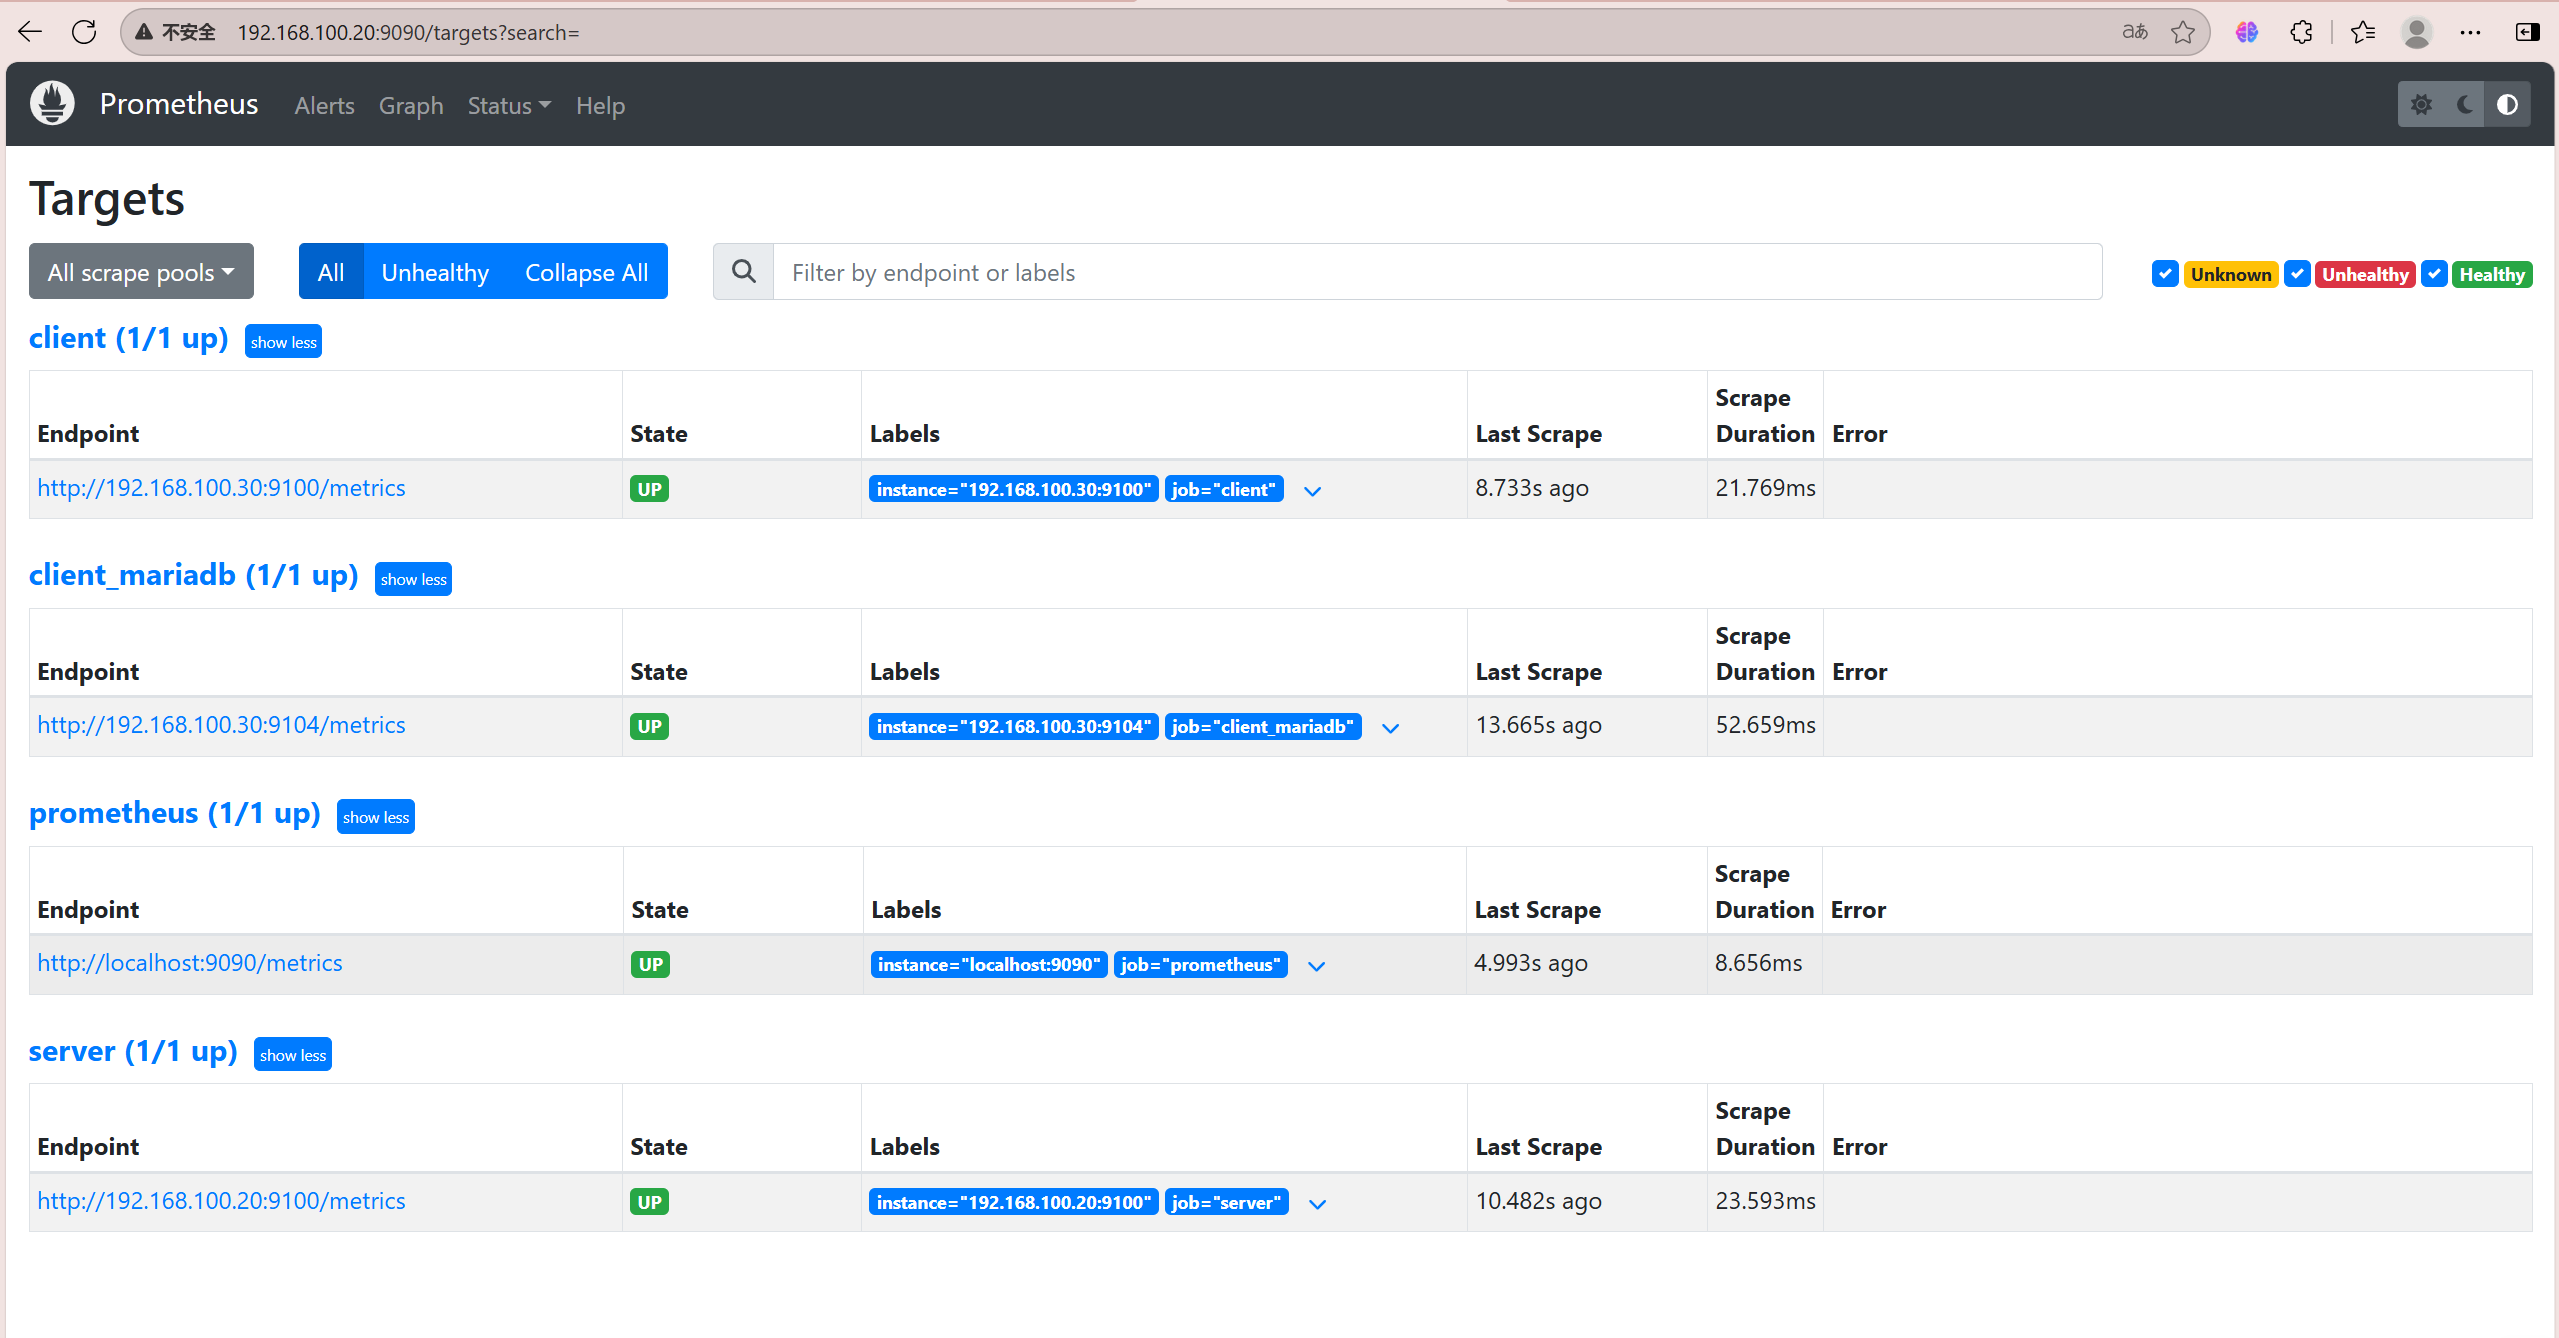
8、回到web管理界面 —>点Status —>点Targets —>可以看到监控mariadb了