普罗米修斯监控实战:从原理到小型项目
普罗米修斯监控技术详解:从原理到小型项目实践
在云原生与微服务架构普及的今天,“看不见的系统” 等于 “不可控的风险”。普罗米修斯(Prometheus)作为云原生领域的核心监控工具,凭借其灵活的指标采集、强大的查询能力与完善的告警机制,成为保障系统稳定运行的 “眼睛”。本文将从普罗米修斯的核心原理入手,结合一个小型 Web 项目的监控实践,带你掌握从 “搭建监控” 到 “用监控解决问题” 的全流程。
一、认识普罗米修斯:为什么它是云原生监控首选?
1. 普罗米修斯的核心定位
普罗米修斯是由 SoundCloud 开源的时序数据库监控系统,专注于 “指标采集、存储、查询与告警”,尤其适合监控容器化应用、微服务及云原生基础设施(如 Kubernetes)。它的设计理念是 “基于指标的主动拉取式监控”,区别于传统的 “被动推送式监控”(如 Zabbix),更契合云原生环境下 “服务动态扩缩容” 的特点。
2. 核心架构与组件
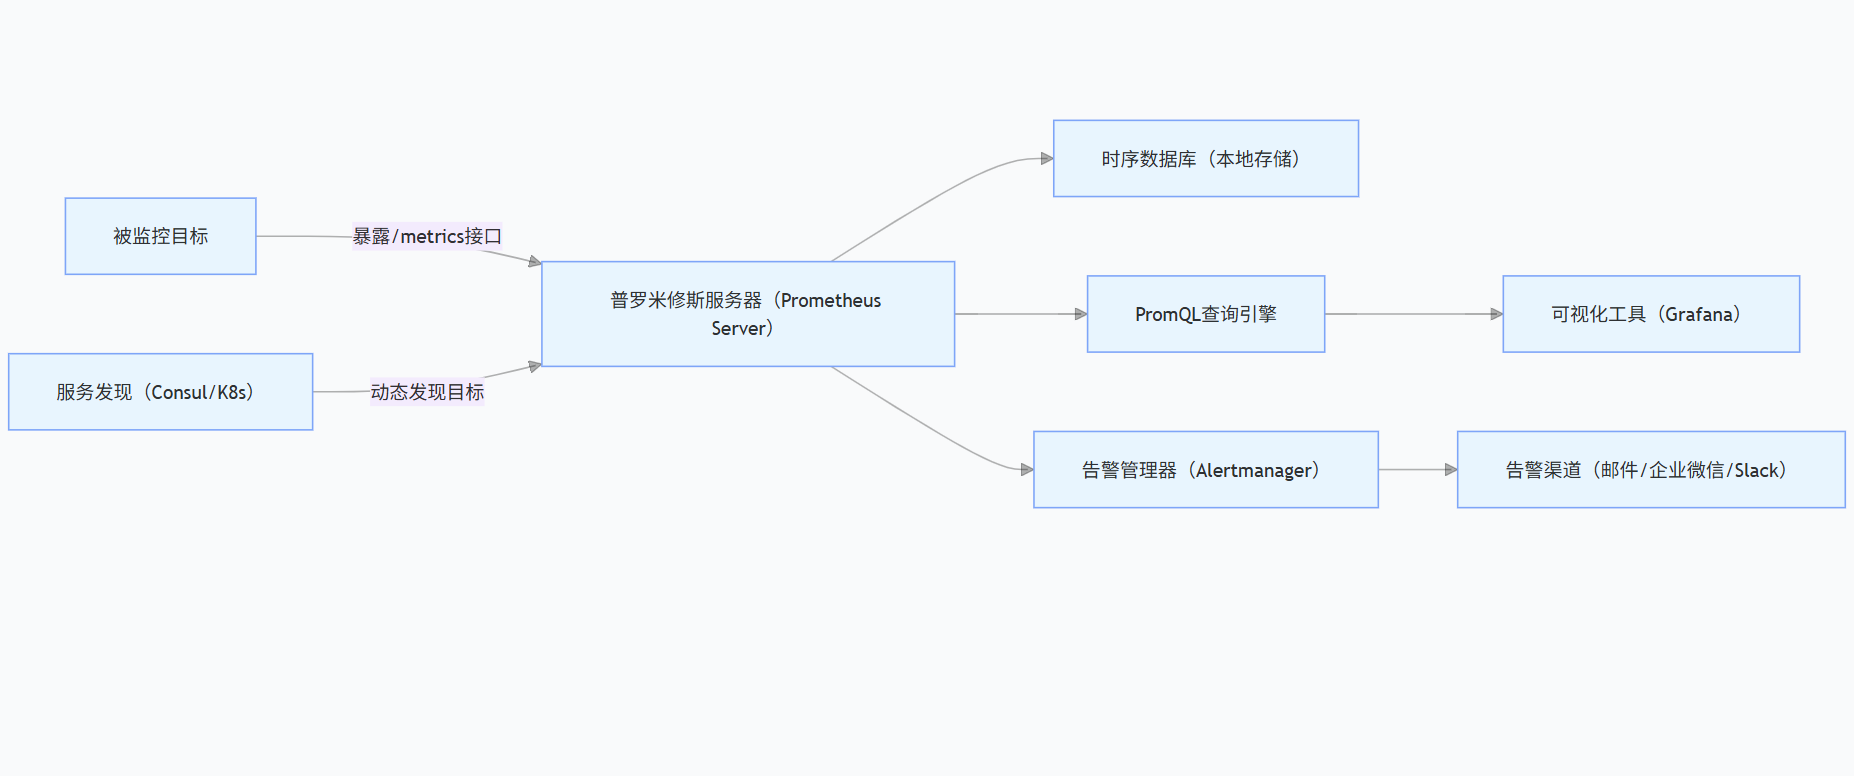
普罗米修斯的监控体系并非单一工具,而是由多个组件协同工作,以下是核心架构图:
各组件的核心作用:
- Prometheus Server:核心组件,负责从被监控目标拉取指标、存储指标,并提供 PromQL 查询接口;
- 被监控目标:需暴露/metrics接口(如 Spring Boot 应用集成 micrometer、Nginx 配置 ngx_http_stub_status_module),供 Prometheus 拉取数据;
- Grafana:第三方可视化工具,支持通过 PromQL 查询普罗米修斯数据,生成仪表盘(如接口响应时间、CPU 使用率图表);
- Alertmanager:处理告警规则,支持告警分组、抑制与路由,将告警发送到指定渠道;
- 服务发现:当被监控目标动态变化(如 K8s Pod 扩缩容)时,自动发现新目标并添加监控。
3. 普罗米修斯的核心优势
- 轻量级易部署:单二进制文件部署,无需依赖复杂的外部组件(如数据库),适合中小团队快速上手;
- 灵活的 PromQL:支持强大的查询语法,可实现 “按接口维度统计错误率”“计算 95 分位响应时间” 等复杂分析;
- 原生支持容器:与 Docker、Kubernetes 深度集成,可直接监控容器 CPU、内存、网络等资源指标;
- 开源生态完善:拥有丰富的 Exporter(如 node_exporter 监控服务器、mysql_exporter 监控 MySQL),覆盖绝大多数常见场景。
二、小型项目监控实践:监控 Spring Boot Web 应用
接下来,我们以一个 “用户管理 Web 应用”(基于 Spring Boot 开发)为例,完整实现从 “配置监控” 到 “可视化与告警” 的全流程。项目需求如下:
- 监控应用本身指标:接口响应时间、请求量、错误率;
- 监控服务器资源:CPU 使用率、内存占用、磁盘空间;
- 配置告警:当接口错误率 > 5% 或 CPU 使用率 > 80% 时,发送企业微信告警。
1. 环境准备
工具 / 组件 | 版本 | 作用 |
Spring Boot | 2.7.x | 开发 Web 应用 |
Prometheus | 2.45.x | 采集与存储指标 |
Grafana | 10.2.x | 可视化监控数据 |
node_exporter | 1.6.x | 监控服务器资源(CPU / 内存等) |
企业微信 | - | 接收告警通知 |
服务器 | CentOS 7 | 部署应用、Prometheus 与 Grafana |
2. 步骤 1:开发并配置 Spring Boot 应用(被监控目标)
首先,开发一个简单的用户管理应用,集成micrometer-registry-prometheus依赖,暴露/metrics接口。
(1)添加依赖(pom.xml)
<dependencies><!-- Spring Boot Web --><dependency><groupId>org.springframework.boot</groupId><artifactId>spring-boot-starter-web</artifactId></dependency><!-- 集成Prometheus指标 --><dependency><groupId>io.micrometer</groupId><artifactId>micrometer-registry-prometheus</artifactId></dependency><!-- Spring Boot Actuator(暴露/actuator端点) --><dependency><groupId>org.springframework.boot</groupId><artifactId>spring-boot-starter-actuator</artifactId></dependency></dependencies>(2)配置 application.yml
开启/actuator/prometheus端点,供 Prometheus 拉取指标:
spring:application:name: user-management-app # 应用名称,用于监控中区分目标management:endpoints:web:exposure:include: prometheus,health # 暴露prometheus和health端点metrics:tags:application: ${spring.application.name} # 为指标添加application标签,便于多应用区分endpoint:health:show-details: always # 显示健康检查详情(3)开发接口(模拟业务场景)
编写用户查询、新增接口,模拟正常请求与异常场景(如参数错误):
import org.springframework.web.bind.annotation.*;@RestController@RequestMapping("/api/users")public class UserController {// 正常接口:查询用户@GetMapping("/{id}")public String getUser(@PathVariable Integer id) {if (id <= 0) {throw new IllegalArgumentException("用户ID不能为负数"); // 模拟异常}return "用户ID:" + id + ",姓名:张三";}// 正常接口:新增用户@PostMappingpublic String addUser(@RequestParam String name) {if (name == null || name.isEmpty()) {throw new IllegalArgumentException("用户名不能为空"); // 模拟异常}return "新增用户成功:" + name;}}(4)启动应用并验证
启动 Spring Boot 应用后,访问 http://{应用IP}:8080/actuator/prometheus,可看到 Prometheus 格式的指标数据,例如:
- http_server_requests_seconds_count:接口请求次数(按接口、状态码分组);
- http_server_requests_seconds_sum:接口请求总耗时;
- jvm_memory_used_bytes:JVM 内存使用量。
3. 步骤 2:部署 node_exporter(监控服务器资源)
node_exporter 是普罗米修斯官方提供的 “服务器资源监控 Exporter”,可采集 CPU、内存、磁盘、网络等指标。
(1)下载并解压 node_exporter
# 下载(根据系统选择版本,这里以Linux-amd64为例)wget https://github.com/prometheus/node_exporter/releases/download/v1.6.1/node_exporter-1.6.1.linux-amd64.tar.gz# 解压tar -zxvf node_exporter-1.6.1.linux-amd64.tar.gzcd node_exporter-1.6.1.linux-amd64(2)启动 node_exporter
# 后台启动,默认暴露9100端口(/metrics接口)nohup ./node_exporter &(3)验证
访问 http://{服务器IP}:9100/metrics,可看到服务器资源指标,例如:
- node_cpu_seconds_total:CPU 使用时间(按核心、状态分组,如 idle、user);
- node_memory_used_bytes:内存使用量;
- node_filesystem_used_bytes:磁盘使用量。
4. 步骤 3:部署并配置 Prometheus Server
(1)下载并解压 Prometheus
# 下载(Linux-amd64版本)wget https://github.com/prometheus/prometheus/releases/download/v2.45.0/prometheus-2.45.0.linux-amd64.tar.gz# 解压tar -zxvf prometheus-2.45.0.linux-amd64.tar.gzcd prometheus-2.45.0.linux-amd64(2)修改配置文件(prometheus.yml)
配置 “监控目标”(Spring Boot 应用与 node_exporter),并设置拉取间隔(默认 15s):
global:scrape_interval: 15s # 全局拉取间隔evaluation_interval: 15s # 告警规则评估间隔rule_files:# - "first_rules.yml"# - "second_rules.yml"scrape_configs:# 监控Spring Boot应用(自定义任务名)- job_name: "spring-boot-app"static_configs:- targets: ["{应用IP}:8080"] # 应用的/actuator/prometheus端点(默认8080端口)labels:app: "user-management" # 自定义标签,便于筛选# 监控服务器资源(node_exporter)- job_name: "linux-server"static_configs:- targets: ["{服务器IP}:9100"] # node_exporter的/metrics端点(默认9100端口)labels:server: "centos-7" # 自定义标签(3)启动 Prometheus
# 后台启动,默认暴露9090端口nohup ./prometheus --config.file=prometheus.yml &(4)验证 Prometheus
- 访问 http://{服务器IP}:9090,进入 Prometheus Web 界面;
- 点击顶部 “Status”→“Targets”,可看到两个监控目标的状态为 “UP”(表示正常拉取指标);
- 在顶部查询框输入 PromQL 查询指标,例如:
- 查询 Spring Boot 应用的/api/users/{id}接口请求次数:http_server_requests_seconds_count{endpoint="/api/users/{id}"};
- 查询服务器 CPU 使用率(user 态):sum(rate(node_cpu_seconds_total{mode="user"}[5m])) / sum(rate(node_cpu_seconds_total[5m])) * 100。
5. 步骤 4:部署 Grafana(可视化监控数据)
Grafana 支持通过 PromQL 查询普罗米修斯数据,并生成直观的仪表盘,社区提供大量现成的 “仪表盘模板”(如 Spring Boot 应用模板、服务器监控模板),无需从零开始配置。
(1)安装 Grafana
# 安装依赖sudo yum install -y fontconfig# 下载Grafana RPM包wget https://dl.grafana.com/oss/release/grafana-10.2.2-1.x86_64.rpm# 安装sudo rpm -ivh grafana-10.2.2-1.x86_64.rpm# 启动Grafana并设置开机自启sudo systemctl start grafana-serversudo systemctl enable grafana-server(2)配置 Grafana 数据源(关联 Prometheus)
- 访问 http://{服务器IP}:3000(Grafana 默认端口),初始账号 / 密码为admin/admin,首次登录需修改密码;
- 点击左侧 “Configuration”→“Data Sources”→“Add data source”,选择 “Prometheus”;
- 在 “HTTP”→“URL” 中输入 Prometheus 地址(http://{服务器IP}:9090),点击 “Save & test”,显示 “Data source is working” 表示配置成功。
(3)导入现成仪表盘模板
Grafana 社区提供大量模板,我们直接导入适合的模板:
- Spring Boot 应用监控:
- 点击左侧 “Dashboards”→“Import”,输入模板 ID “12856”(社区热门 Spring Boot 模板,支持 JVM、接口指标);
- 选择已配置的 Prometheus 数据源,点击 “Import”,即可看到应用的 JVM 内存、接口响应时间、请求量等图表。
- 服务器资源监控:
- 再次导入模板,输入模板 ID “1860”(社区热门 Node Exporter 模板,支持 CPU、内存、磁盘);
- 选择数据源后导入,可看到服务器的 CPU 使用率趋势、内存占用、磁盘剩余空间等图表。
6. 步骤 5:配置告警(Alertmanager + 企业微信)
当指标超过阈值时(如接口错误率 > 5%),需通过 Alertmanager 发送告警到企业微信。
(1)配置 Prometheus 告警规则
在 Prometheus 目录下新建alert_rules.yml文件,定义告警规则:
groups:- name: 应用告警规则rules:# 规则1:接口错误率>5%(5分钟内)- alert: 接口错误率过高expr: sum(rate(http_server_requests_seconds_count{status=~"5..|4.."}[5m])) / sum(rate(http_server_requests_seconds_count[5m])) * 100 > 5for: 1m # 持续1分钟超过阈值才触发告警labels:severity: critical # 告警级别(critical/warning/info)annotations:summary: "应用接口错误率过高"description: "应用{{ $labels.application }}的接口错误率在5分钟内达到{{ $value | humanizePercentage }},超过5%阈值"- name: 服务器告警规则rules:# 规则2:CPU使用率>80%(5分钟内)- alert: 服务器CPU使用率过高expr: sum(rate(node_cpu_seconds_total{mode="user"}[5m])) / sum(rate(node_cpu_seconds_total[5m])) * 100 > 80for: 2m # 持续2分钟超过阈值labels:severity: warningannotations:summary: "服务器CPU使用率过高"description: "服务器{{ $labels.server }}的CPU使用率在5分钟内达到{{ $value | humanizePercentage }},超过80%阈值"在prometheus.yml中引用告警规则文件:
rule_files:- "alert_rules.yml" # 添加这行(2)部署并配置 Alertmanager
- 下载并解压 Alertmanager:
wget https://github.com/prometheus/alertmanager/releases/download/v0.26.0/alertmanager-0.26.0.linux-amd64.tar.gztar -zxvf alertmanager-0.26.0.linux-amd64.tar.gzcd alertmanager-0.26.0.linux-amd64- 修改 Alertmanager 配置文件(alertmanager.yml):
需先在企业微信 “应用管理” 中创建 “监控告警应用”,获取corpid(企业 ID)、agentid(应用 ID)、secret(应用密钥):
global:resolve_timeout: 5m # 告警解决后,5分钟内不再发送恢复通知route:group_by: ['alertname'] # 按告警名称分组group_wait: 10s # 同组告警等待10秒,一起发送group_interval: 10s # 同组告警间隔10秒发送repeat_interval: 1h # 同一告警重复发送间隔1小时receiver: 'wechat' # 默认接收者receivers:- name: 'wechat'wechat_configs:- corp_id: '你的企业微信corpid'to_user: '@all' # 发送给所有成员(也可指定用户ID)agent_id: '你的应用agentid'api_secret: '你的应用secret'send_resolved: true # 发送告警恢复通知inhibit_rules:- source_match:severity: 'critical'target_match:severity: 'warning'equal: ['alertname', 'dev', 'instance']- 启动 Alertmanager:
nohup ./alertmanager --config.file=alertmanager.yml &- 关联 Prometheus 与 Alertmanager:
在prometheus.yml中添加 Alertmanager 地址:
alerting:alertman</doubaocanvas>