机器学习-第三章 线性模型
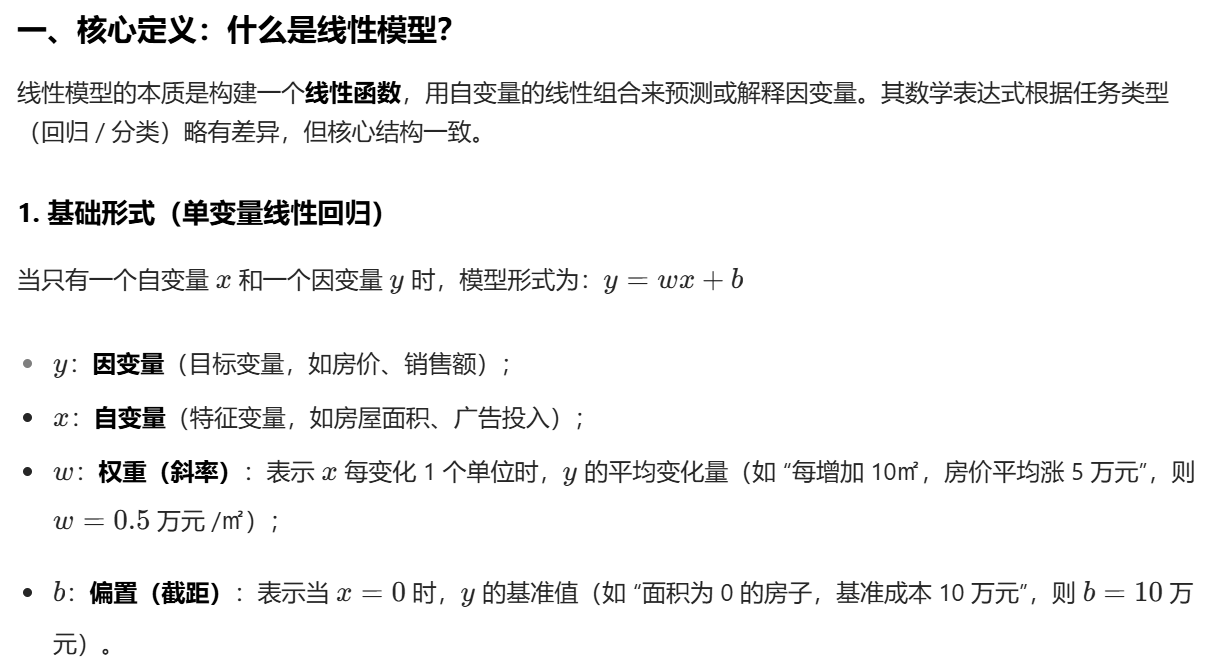
3.1 线性模型
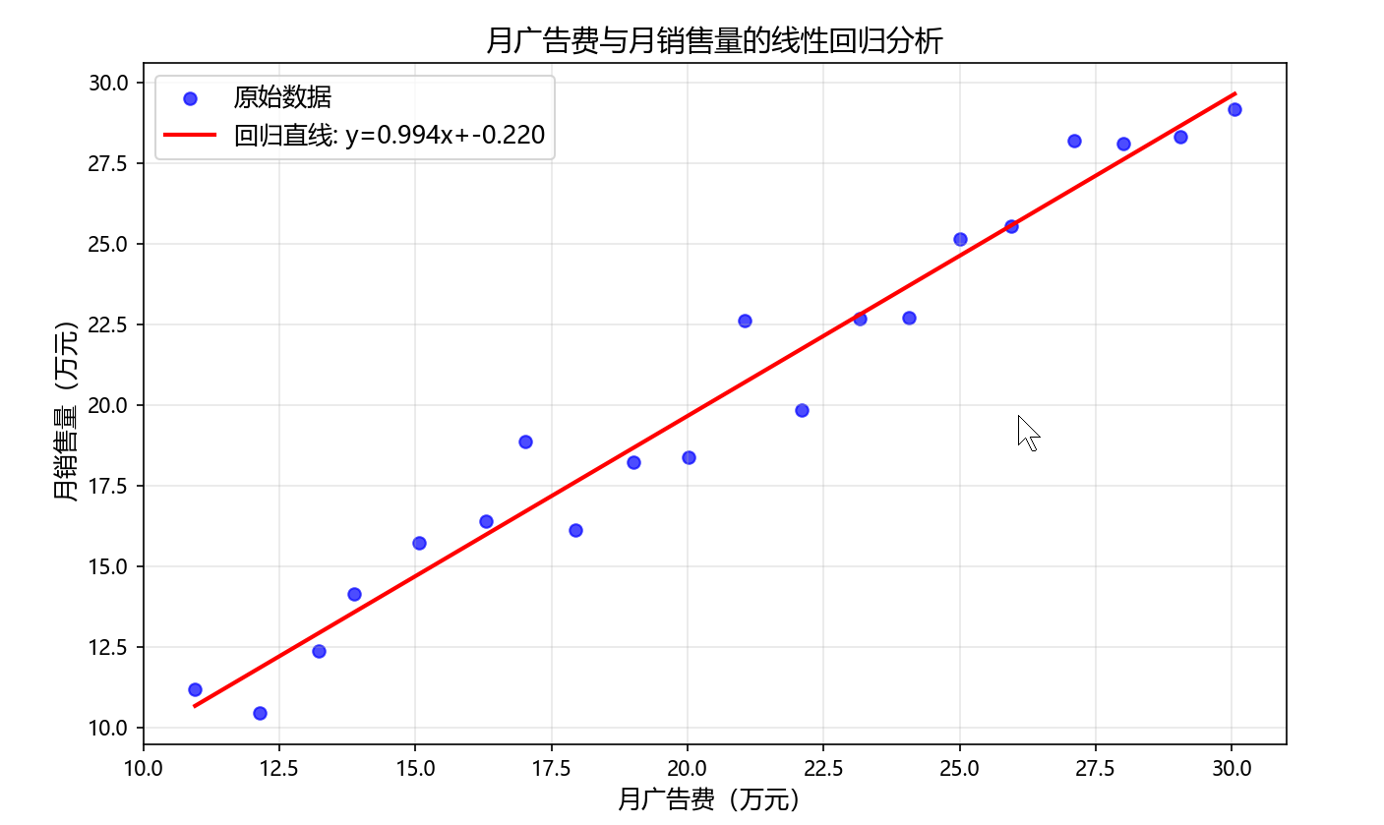
例题3.1
import numpy as np
import pandas as pd
import matplotlib.pyplot as plt
from sklearn.linear_model import LinearRegression
from sklearn.metrics import r2_score
# -------------------------- 新增:解决中文字体问题 --------------------------
plt.rcParams["font.sans-serif"] = ["Microsoft YaHei"]  # 使用系统自带的微软雅黑字体
plt.rcParams["axes.unicode_minus"] = False  # 避免负号显示为方块
# 1. 准备数据(月广告费和月销售量,单位:万元)
# 月广告费数据
advertising = np.array([10.95, 12.14, 13.22, 13.87, 15.06, 16.30, 17.01, 17.93, 19.01, 20.01,21.04, 22.10, 23.17, 24.07, 25.00, 25.95, 27.10, 28.01, 29.06, 30.05])
# 月销售量数据
sales = np.array([11.18, 10.43, 12.36, 14.15, 15.73, 16.40, 18.86, 16.13, 18.21, 18.37,22.61, 19.83, 22.67, 22.70, 25.16, 25.55, 28.21, 28.12, 28.32, 29.18])# 转换为二维数组(sklearn要求输入为[样本数, 特征数]格式)
X = advertising.reshape(-1, 1)  # 自变量:月广告费
y = sales.reshape(-1, 1)        # 因变量:月销售量# 2. 训练线性回归模型
model = LinearRegression()
model.fit(X, y)  # 拟合模型# 3. 获取模型参数
a = model.coef_[0][0]  # 斜率(权重)
b = model.intercept_[0]  # 截距
y_pred = model.predict(X)  # 预测值
r2 = r2_score(y, y_pred)  # 决定系数R²# 4. 输出结果分析
print(f"线性回归方程:y = {a:.3f}x + {b:.3f}")
print(f"决定系数R²:{r2:.4f}(越接近1,拟合效果越好)")
print("\n模型解读:")
print(f"- 斜率{a:.3f}表示:月广告费每增加1万元,月销售量平均增加{a:.3f}万元")
print(f"- 截距{b:.3f}表示:当广告费为0时,销售量的基准值约为{b:.3f}万元")# 5. 可视化拟合结果
plt.figure(figsize=(10, 6))
# 绘制原始数据点
plt.scatter(X, y, color='blue', label='原始数据', alpha=0.7)
# 绘制回归直线
plt.plot(X, y_pred, color='red', linewidth=2, label=f'回归直线: y={a:.3f}x+{b:.3f}')
# 添加标签和标题
plt.xlabel('月广告费(万元)', fontsize=12)
plt.ylabel('月销售量(万元)', fontsize=12)
plt.title('月广告费与月销售量的线性回归分析', fontsize=14)
plt.grid(alpha=0.3)
plt.legend(fontsize=12)
plt.show()
线性回归方程:y = 0.994x + -0.220
决定系数R²:0.9642(越接近1,拟合效果越好)
模型解读:
- 斜率0.994表示:月广告费每增加1万元,月销售量平均增加0.994万元
- 截距-0.220表示:当广告费为0时,销售量的基准值约为-0.220万元