Rubber Band Optimation算法python实现
在我的另一篇博客中给出了Rubber Band Optimation算法的MATLAB版本:
Rubber Band 算法作用过程(视频帧)-CSDN博客
%zhouzhichao
%25年6月3日
%编写Rubber band程序并测试clear
clc
close all%%
%生成信号
list = [  2,   6;0.3,   4;0.17 , 2;0.125, 0;0.07, -2;0.05, -4;];%信号生成:[s1,h1] = mysigduo(0.25,'BPSK');S_raw = 3.1*s1;snr_i=1;%信号加噪:
snr = list(snr_i, 2);S = list(snr_i, 1)*S_raw + ones(size(S_raw));%生成时频图:
[tfr,t,f] = tfrctfd2(S);%生成3D时频图:
% 获取幅度
tfr_asb = abs(tfr);% 计算最大值,用于caxis
level = max(max(tfr_asb(:, 200:800)));
new_t = t / 1000;  % 将t轴的值缩小1000倍
tfr_asb = tfr_asb/max(tfr_asb(:));
% 创建三维图形
figure;for k=0:0.001:0.02hold offsurf(new_t, f, tfr_asb, 'EdgeColor', 'none'); % 使用surf来创建3D图xlim([0,1])ylim([0.2,0.3])% 设置x轴的刻度% 调整视角view(-42.6, 84);% 可选:暂停使图形实时更新pause(0.01);set(gca, 'FontName', 'Times New Roman');ax = gca;  % 获取当前坐标轴ax.XColor = 'none';  % 隐藏 x 轴ax.ZColor = 'none';  % 隐藏 z 轴% grid off;ax = gca;  % 获取当前坐标轴ax.YAxis.FontSize = 24;  % 设置 y 轴刻度标签的字体大小为 14% 设置 y 轴的刻度位置yticks(linspace(0.20, 0.30, 6));  % 调整刻度间隔为 10 个标签ytickformat('%.2f');%%%Rubber band算法L0 = 0.01;origin_y1 = 0.225;origin_y2 = 0.275;%     k = 0.015;y2 = origin_y2 - k;y1 = origin_y1 + k;delta_y = y2 - y1;delta_L = 2*(delta_y-L0);F = delta_L/L0;%F同样是相对拉伸长度,因为没加系数a = round(y1/0.5*1024);height = max(tfr_asb(a,:));resistance = max(tfr_asb(a,:));hold on;  % 保持当前图形z_height = height;  % 可以更改这个值来调整框在z轴的高度% 绘制三维矩形框,使用patch函数x = [0 1 1 0];  % x坐标y = [y1 y1 y2 y2];  % y坐标(根据需要设置)z = [z_height z_height z_height z_height];  % z轴的高度,所有顶点高度相同% 使用patch来创建矩形RGB = [1, 1-F/8.1, 1-F/8.1];patch(x, y, z, 'white', 'FaceAlpha', 0.5, 'EdgeColor', RGB, 'LineWidth', 2);  % 'r'为颜色,'FaceAlpha'设置透明度print(gcf, ['D:\实验室\论文\论文-多信号参数估计\JCR3\Experiment\Rubber band performance\img of diff delta y color big font\relative delta L ', num2str(round(F,3)), '.jpg'], '-djpeg', '-r300');end
核心程序是for循环:
for k=0:0.001:0.02XXX
end
在篇文章我将给出RBO算法的python实现效果。
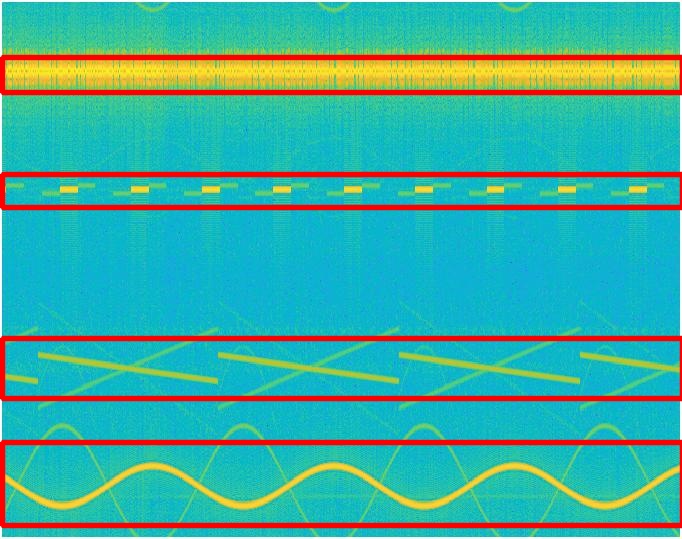
首先定位预测框输出位置:
if len(det):# Rescale boxes from img_size to im0 sizedet[:, :4] = scale_coords(img.shape[2:], det[:, :4], im0.shape).round()# Print resultsfor c in det[:, -1].unique():n = (det[:, -1] == c).sum() # detections per classs += f"{n} {names[int(c)]}{'s' * (n > 1)}, " # add to string# Write resultsfor *xyxy, conf, cls in reversed(det):if save_txt: # Write to filexywh = (xyxy2xywh(torch.tensor(xyxy).view(1, 4)) / gn).view(-1).tolist() # normalized xywhline = (cls, *xywh, conf) if opt.save_conf else (cls, *xywh) # label formatwith open(txt_path + '.txt', 'a') as f:f.write(('%g ' * len(line)).rstrip() % line + '\n')if save_img or view_img: # Add bbox to imagelabel = f'{names[int(cls)]} {conf:.2f}'plot_one_box(xyxy, im0, label=label, color=colors[int(cls)], line_thickness=1)其实在画框之前施加RBO算法就行,不用在YOLOv7神经网络预测框参数后马上优化BOX参数。YOLOv7输出原始预测框参数后还有NMS等优化步骤,贸然插入代码可能打乱原有逻辑。
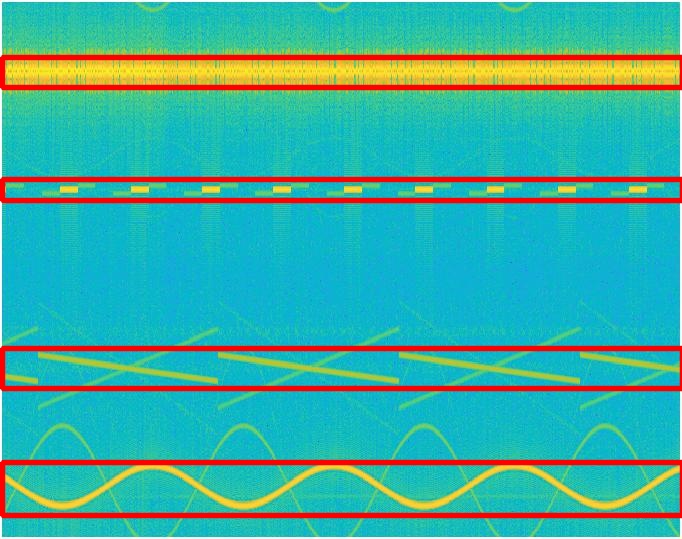
经过统计,框在y方向上调整大小大致如下:
# RBO之后
det[0, 1] = det[0, 1] + 5
det[0, 3] = det[0, 3] - 7
det[2, 3] = det[2, 3] - 5