Dashboard.vue 组件分析
Dashboard.vue 组件详细分析
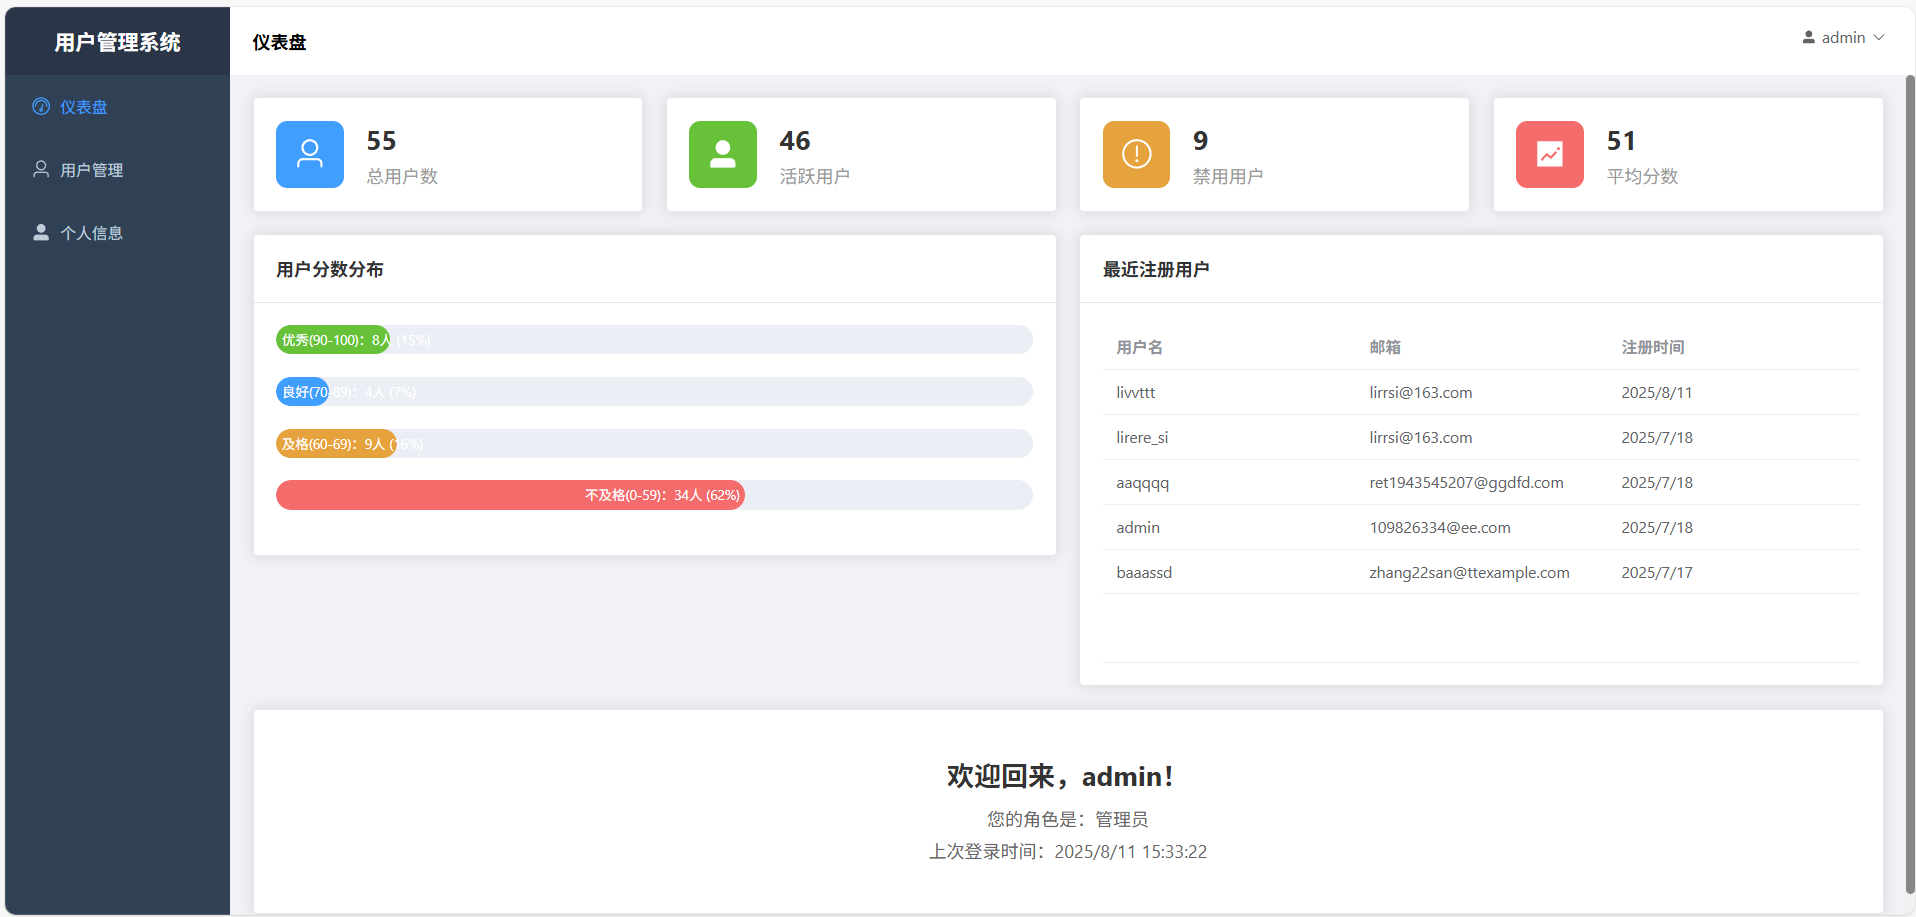
一、组件概览
这是一个用户管理系统的仪表盘组件,使用Vue 3 Composition API + Element Plus UI库构建,主要功能是展示系统的统计数据和用户信息。
二、模板结构分析
2.1 整体布局
<div class="dashboard"><!-- 使用Element Plus的栅格系统 --><el-row :gutter="20"><!-- 统计卡片区域 --></el-row><el-row :gutter="20"><!-- 图表和表格区域 --></el-row><!-- 欢迎信息区域 --><el-card>
</div>
2.2 四个核心区域
A. 统计卡片区域
<el-col :span="6" v-for="item in statsCards" :key="item.title"><el-card class="stats-card"><div class="stats-content"><div class="stats-icon"><el-icon><component :is="item.icon" /></el-icon></div><div class="stats-info"><div class="stats-value">{{ item.value }}</div><div class="stats-title">{{ item.title }}</div></div></div></el-card>
</el-col>
- 使用24栅格系统,每个卡片占6格(共4个卡片)
- 动态组件渲染图标:
<component :is="item.icon" /> - 展示:总用户数、活跃用户、禁用用户、平均分数
B. 用户分数分布图
<el-progressv-for="item in scoreDistribution":percentage="item.percentage":color="item.color":text-inside="true":stroke-width="26"
><template #default="{ percentage }"><span>{{ item.label }}:{{ item.count }}人 ({{ percentage }}%)</span></template>
</el-progress>
- 使用进度条组件模拟柱状图
- 自定义插槽显示详细信息
- 四个分数段:优秀(90-100)、良好(70-89)、及格(60-69)、不及格(0-59)
C. 最近用户表格
<el-table :data="recentUsers" height="300"><el-table-column prop="username" label="用户名" /><el-table-column prop="email" label="邮箱" /><el-table-column prop="createTime" label="注册时间"><template #default="{ row }">{{ formatDate(row.createTime) }}</template></el-table-column>
</el-table>
- 固定高度300px的表格
- 自定义时间格式化
D. 欢迎信息区域
<div class="welcome-section"><h2>欢迎回来,{{ user.username }}!</h2><p>您的角色是:{{ role === "admin" ? "管理员" : "普通用户" }}</p><p>上次登录时间:{{ new Date().toLocaleString() }}</p>
</div>
三、脚本逻辑分析
3.1 依赖导入和状态管理
import { ref, computed, onMounted } from "vue";
import { useStore } from "vuex";
import { getAllUsers } from "@/api/user";const store = useStore();
const user = computed(() => store.getters.user);
const role = computed(() => store.getters.role);
- 使用Composition API
- 通过Vuex获取用户信息和角色
- 导入用户API
3.2 数据结构定义
统计卡片配置
const statsCards = ref([{title: "总用户数",value: 0,icon: "User",           // Element Plus图标名color: "#409eff",       // 主题色},// ... 其他三个卡片
]);
分数分布配置
const scoreDistribution = ref([{ label: "优秀(90-100)", count: 0, percentage: 0, color: "#67c23a" },// ... 其他分数段
]);
3.3 核心业务逻辑
数据加载函数
const loadDashboardData = async () => {try {const res = await getAllUsers();const users = res.data;// 1. 计算基础统计statsCards.value[0].value = users.length;statsCards.value[1].value = users.filter(u => u.status === 1).length;statsCards.value[2].value = users.filter(u => u.status === 0).length;// 2. 计算平均分数const avgScore = users.reduce((sum, u) => sum + (u.score || 0), 0) / users.length;statsCards.value[3].value = Math.round(avgScore);// 3. 分数分布统计// 4. 获取最近用户} catch (error) {console.error("加载仪表盘数据失败", error);}
};
分数分布算法
const distribution = [{ range: [90, 100], index: 0 },{ range: [70, 89], index: 1 },{ range: [60, 69], index: 2 },{ range: [0, 59], index: 3 },
];users.forEach((user) => {const score = user.score || 0;const item = distribution.find((d) => score >= d.range[0] && score <= d.range[1]);if (item) {scoreDistribution.value[item.index].count++;}
});
最近用户排序
recentUsers.value = users.sort((a, b) => new Date(b.createTime) - new Date(a.createTime)).slice(0, 5);
四、样式设计分析
4.1 统计卡片样式
.stats-card {.stats-content {display: flex;align-items: center;.stats-icon {width: 60px;height: 60px;border-radius: 10px;display: flex;align-items: center;justify-content: center;color: white;margin-right: 20px;}.stats-info {flex: 1;.stats-value {font-size: 24px;font-weight: bold;color: #333;}}}
}
- 使用Flexbox布局
- 图标容器固定尺寸,圆角设计
- 数值突出显示(24px,粗体)
4.2 欢迎区域样式
.welcome-section {text-align: center;padding: 20px;h2 {color: #333;margin-bottom: 10px;}p {color: #666;margin: 5px 0;}
}
- Vue 3 Composition API:更好的逻辑复用和类型推导
- Element Plus:成熟的企业级UI组件库
- SCSS:CSS预处理器,支持嵌套和变量
5.2 设计模式
- 响应式数据:使用ref和computed进行状态管理
- 组件化:模块化的卡片设计
- 数据驱动:通过配置数组驱动UI渲染
5.3 用户体验
- 可视化展示:使用进度条展示分数分布
- 实时数据:页面加载时获取最新数据
- 友好界面:清晰的布局和适当的间距
// 可以添加loading状态
const loading = ref(false);// 可以添加错误处理UI
const error = ref(null);
// 添加数据刷新功能
const refreshData = () => {loadDashboardData();
};// 添加时间范围筛选
const dateRange = ref([]);
<!-- 添加aria标签 -->
<div class="stats-icon" :aria-label="item.title">
这是一个设计良好的仪表盘组件,具有以下特点:
- 结构清晰:模块化的布局设计
- 数据丰富:多维度的统计信息展示
- 交互友好:直观的可视化组件
- 技术现代:使用最新的Vue 3特性
- 可维护性高:良好的代码组织和命名规范
<!-- src/views/Dashboard.vue -->
<template><div class="dashboard"><el-row :gutter="20"><!-- 统计卡片 --><el-col :span="6" v-for="item in statsCards" :key="item.title"><el-card class="stats-card"><div class="stats-content"><div class="stats-icon" :style="{ backgroundColor: item.color }"><el-icon :size="30"><component :is="item.icon" /></el-icon></div><div class="stats-info"><div class="stats-value">{{ item.value }}</div><div class="stats-title">{{ item.title }}</div></div></div></el-card></el-col></el-row><el-row :gutter="20" style="margin-top: 20px"><!-- 用户分数分布 --><el-col :span="12"><el-card><template #header><div class="card-header"><span>用户分数分布</span></div></template><div class="chart-container"><el-progressv-for="item in scoreDistribution":key="item.label":text-inside="true":stroke-width="26":percentage="item.percentage":color="item.color"style="margin-bottom: 20px"><template #default="{ percentage }"><span>{{ item.label }}:{{ item.count }}人 ({{percentage}}%)</span></template></el-progress></div></el-card></el-col><!-- 最近用户 --><el-col :span="12"><el-card><template #header><div class="card-header"><span>最近注册用户</span></div></template><el-table :data="recentUsers" height="300"><el-table-column prop="username" label="用户名" /><el-table-column prop="email" label="邮箱" /><el-table-column prop="createTime" label="注册时间"><template #default="{ row }">{{ formatDate(row.createTime) }}</template></el-table-column></el-table></el-card></el-col></el-row><!-- 欢迎信息 --><el-card style="margin-top: 20px"><div class="welcome-section"><h2>欢迎回来,{{ user.username }}!</h2><p>您的角色是:{{ role === "admin" ? "管理员" : "普通用户" }}</p><p>上次登录时间:{{ new Date().toLocaleString() }}</p></div></el-card></div>
</template><script setup>
import { ref, computed, onMounted } from "vue";
import { useStore } from "vuex";
import { getAllUsers } from "@/api/user";const store = useStore();
const user = computed(() => store.getters.user);
const role = computed(() => store.getters.role);// 统计卡片数据
const statsCards = ref([{title: "总用户数",value: 0,icon: "User",color: "#409eff",},{title: "活跃用户",value: 0,icon: "UserFilled",color: "#67c23a",},{title: "禁用用户",value: 0,icon: "Warning",color: "#e6a23c",},{title: "平均分数",value: 0,icon: "TrendCharts",color: "#f56c6c",},
]);// 分数分布
const scoreDistribution = ref([{ label: "优秀(90-100)", count: 0, percentage: 0, color: "#67c23a" },{ label: "良好(70-89)", count: 0, percentage: 0, color: "#409eff" },{ label: "及格(60-69)", count: 0, percentage: 0, color: "#e6a23c" },{ label: "不及格(0-59)", count: 0, percentage: 0, color: "#f56c6c" },
]);// 最近用户
const recentUsers = ref([]);const formatDate = (dateStr) => {if (!dateStr) return "";return new Date(dateStr).toLocaleDateString();
};// 加载数据
const loadDashboardData = async () => {try {const res = await getAllUsers();const users = res.data;// 计算统计数据statsCards.value[0].value = users.length;statsCards.value[1].value = users.filter((u) => u.status === 1).length;statsCards.value[2].value = users.filter((u) => u.status === 0).length;const avgScore =users.reduce((sum, u) => sum + (u.score || 0), 0) / users.length;statsCards.value[3].value = Math.round(avgScore);// 计算分数分布const distribution = [{ range: [90, 100], index: 0 },{ range: [70, 89], index: 1 },{ range: [60, 69], index: 2 },{ range: [0, 59], index: 3 },];users.forEach((user) => {const score = user.score || 0;const item = distribution.find((d) => score >= d.range[0] && score <= d.range[1]);if (item) {scoreDistribution.value[item.index].count++;}});// 计算百分比scoreDistribution.value.forEach((item) => {item.percentage = Math.round((item.count / users.length) * 100);});// 获取最近5个用户recentUsers.value = users.sort((a, b) => new Date(b.createTime) - new Date(a.createTime)).slice(0, 5);} catch (error) {console.error("加载仪表盘数据失败", error);}
};onMounted(() => {loadDashboardData();
});
</script><style scoped lang="scss">
.dashboard {.stats-card {.stats-content {display: flex;align-items: center;.stats-icon {width: 60px;height: 60px;border-radius: 10px;display: flex;align-items: center;justify-content: center;color: white;margin-right: 20px;}.stats-info {flex: 1;.stats-value {font-size: 24px;font-weight: bold;color: #333;}.stats-title {color: #999;margin-top: 5px;}}}}.card-header {font-weight: bold;}.welcome-section {text-align: center;padding: 20px;h2 {color: #333;margin-bottom: 10px;}p {color: #666;margin: 5px 0;}}
}
</style>