一种高维数据可视化的方法:Visualization and Mapping on Arcs (VMA)
前言
提醒:
文章内容为方便作者自己后日复习与查阅而进行的书写与发布,其中引用内容都会使用链接表明出处(如有侵权问题,请及时联系)。
其中内容多为一次书写,缺少检查与订正,如有问题或其他拓展及意见建议,欢迎评论区讨论交流。
内容由AI辅助生成,仅经笔者审核整理,请甄别食用。
文章目录
- 前言
- 可视化原理与功能简述
- 核心功能与设计目标
- 二、目标关系可视化(第一部分)
- 三、高维解映射(第二部分)
- 四、关键特性与实验验证
- 总结
论文引用:
《Qualitative analysis in many-objective optimization with visualization methods》
本博客只是列举了一些论文中的可视化图像示例,内容不够严谨与精细,如感兴趣,请阅读原论文。
相关网址
作者:Roozbeh Haghnazar Koochaksaraci
摘要:
Abstract: Many-objective Optimization Problems present various challenges to the currentoptimization methods. Among these, the visualization gap is an important obstacle tothe interpretation of results. Having the ability of visualizing partial or final results ofa high-dimensional multi-objective problem provides key advantages to the optimizerand also to the decision-maker in terms of understanding the problem and interpretingresults. In this study, a multi-purposed visualization tool is proposed to be appliedin an evolutionary design process. The proposed visualization tool, named Visualiza-tion and Mapping on Arcs (VMA), contains two different parts and usabilities. VMAprovides two important categories of qualitative information from high-dimensionalspaces. The first part of tool maps the solutions from high-dimensional space into the2D forms based to extract the relationship between objectives. Then, the second part,maps the solutions from high-dimensional objective space into a 2D form of scatteringthat is based on norm and angle information. Meanwhile, it preserves some desirablecharacteristics of objective space, such as the shape of the Pareto front, its location,relations between objectives etc. With the support of this tool the decision-maker canobtain information about the shape of the Pareto front, the range of explored area bythe algorithms, qualitative estimation of algorithm performance, relation between ob-jectives, location of solutions and their dispersion. Furthermore, this application hasscalability and flexibility about the number of objectives and population size. Additionally, VMA allows the decision-maker to visually identify poorly explored regionsof the objective space and determine weight vectors to guide the search to a specificor preferred region. Finally, experimental results show that this tool can play a role ofperformance metric and help the evolutionary solving process.
可视化原理与功能简述
论文中提出了名为VMA(Visualization and Mapping on Arcs)可视化的方法
VMA是一种针对超多目标优化问题(MaOPs)的多用途可视化工具,旨在通过定性分析辅助决策者理解目标关系、高维解分布及算法性能,核心包含目标关系可视化与高维解映射两部分,具体内容如下:
核心功能与设计目标
VMA的设计基于“先全局概述、再细节分析”的可视化原则(Shneiderman Mantra),旨在解决高维目标空间的可视化障碍,提供两类关键信息:
- 目标间的和谐(协同)与冲突关系,支持目标约简;
- 高维解在2D空间的分布特征,如帕累托前沿形状、未探索区域等。
二、目标关系可视化(第一部分)
通过环形弧与链接展示目标间的关联,以辅助识别可合并的和谐目标,步骤如下:
- 全局链接概述(Overview)
将每个目标的取值范围映射为环形弧,解在各目标上的取值通过链接连接,形成“弧-链接”网络。- 链接密度反映目标关系:密集链接表示强关联(和谐或冲突)。
如图(为三目标优化结果的可视化):

- 细节分析与区间过滤(Detail Step)
- 支持高亮特定解的链接,或筛选某目标的特定区间(如最小值区间),展示该区间与其他目标的关联。
如图(“高亮特定解”示例):


如图(“区间其他目标的关联”示例):


- 基于偏好的关系过滤
- 嵌入多准则决策(MCDM)方法(如VIKOR),用户输入目标权重后,工具高亮符合偏好的解链接。
如图(“嵌入多准则决策”示例):


三、高维解映射(第二部分)
将N维目标空间的解映射到2D弧上,保留关键特征(如帕累托前沿形状、解分布),步骤如下:
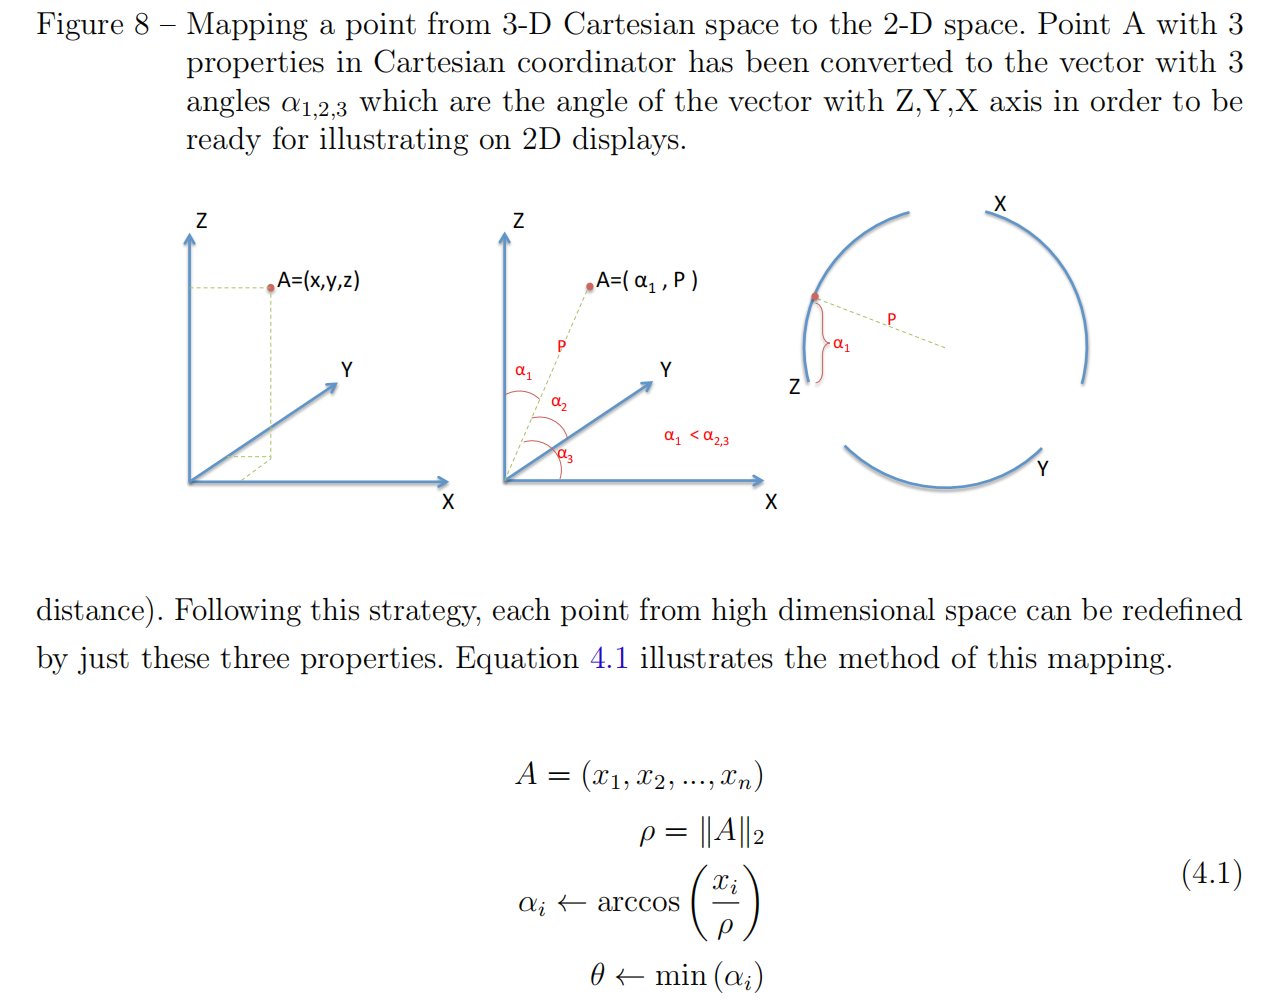
- 坐标转换(N维→2D弧)
- 对N维解x=(x1,x2,...,xN)\mathbf{x} = (x_1, x_2, ..., x_N)x=(x1,x2,...,xN),计算:
- 模长(向量长度):ρ=∥x∥2\rho = \|\mathbf{x}\|_2ρ=∥x∥2(欧氏范数);
- 最小角度:θ=mini(arccos(xiρ))\theta = \min_i \left( \arccos\left( \frac{x_i}{\rho} \right) \right)θ=mini(arccos(ρxi))(解向量与各目标轴的最小夹角);
- 最近轴:i=argminiθii = \arg\min_i \theta_ii=argminiθi(对应目标轴)(公式4.1,)。
- 映射规则:解被投影到“最近轴”对应的弧上,ρ\rhoρ决定半径,θ\thetaθ决定弧上位置。
- 对N维解x=(x1,x2,...,xN)\mathbf{x} = (x_1, x_2, ..., x_N)x=(x1,x2,...,xN),计算:
如图:
-
未探索区域识别与反向映射
- 用户在弧上指定未探索区域后,工具通过三角函数反推N维参考向量p\mathbf{p}p:
- 设指定点对应轴iii,其余轴角度为φ=arccos(sinθN−1)\varphi = \arccos\left( \frac{\sin\theta}{\sqrt{N-1}} \right)φ=arccos(N−1sinθ);
- 参考向量p=(cosφ,...,cosθ,...,cosφ)\mathbf{p} = (\cos\varphi, ..., \cos\theta, ..., \cos\varphi)p=(cosφ,...,cosθ,...,cosφ)。
- 用户在弧上指定未探索区域后,工具通过三角函数反推N维参考向量p\mathbf{p}p:
-
进化过程与算法对比可视化
- 按迭代标记种群(如不同颜色表示不同世代),展示解的收敛轨迹。
- 支持多算法对比(如NSGA-III、MOEA/D),通过弧上点的密度与分布,定性评估多样性与收敛性。
四、关键特性与实验验证
-
特性:
- 可扩展性:适配任意数量目标(通过动态调整弧长,θmax=arccos(1/N)\theta_{\text{max}} = \arccos(1/\sqrt{N})θmax=arccos(1/N));
- 交互性:支持高亮、区间筛选、偏好输入,适配决策者需求。
-
实验验证:
- 在二次函数问题中,VMA辅助的目标约简使超体积从2.791×1072.791×10^72.791×10⁷提升至6.775×1076.775×10^76.775×10⁷;
- 在DTLZ系列问题中,成功引导算法探索未探索区域,改善解的分布性。
总结
VMA通过“目标关系可视化”与“高维解映射”,填补了超多目标优化中定性分析的空白,为目标约简、算法引导及性能评估提供直观支持,其核心创新在于将高维信息转化为可解释的2D视觉符号,平衡了准确性与易用性。