OpenLayers 综合案例-底图换肤(变色)
看过的知识不等于学会。唯有用心总结、系统记录,并通过温故知新反复实践,才能真正掌握一二
作为一名摸爬滚打三年的前端开发,开源社区给了我饭碗,我也将所学的知识体系回馈给大家,助你少走弯路!
OpenLayers、Leaflet 快速入门 ,每周保持更新 2 个案例
Cesium 快速入门,每周保持更新 4 个案例
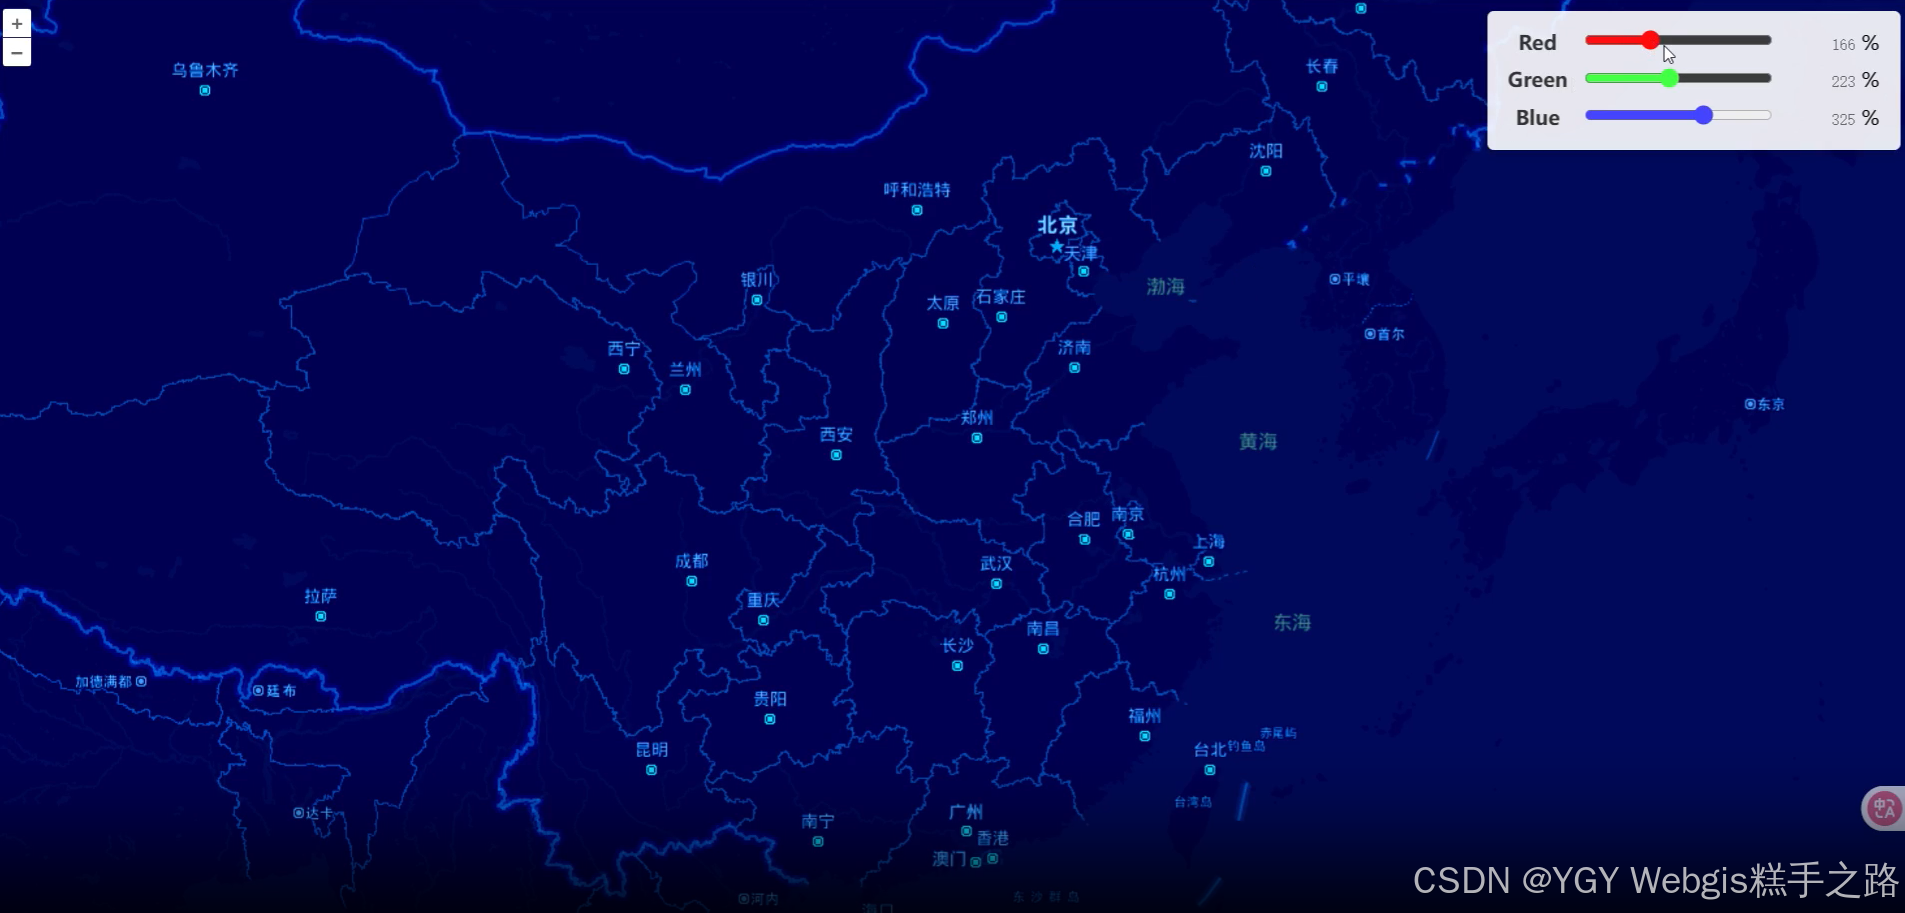
OpenLayers 综合案例-底图换肤(变色)
Vue 3 + OpenLayers 实现的 WebGIS 应用提供了完整的底图变色功能
使用RasterSource栅格数据源,图层必须使用ImageLayer来渲染
主要功能
- 通过属性
operationType: "image", 设置为 image 模式,保持无卡顿高效渲染 - 通过调节
RGB取色来修改底图颜色,同时保证底图字体随着颜色变化而变化
MP4效果动画链接地址&官网hcl调色案例教程
技术栈
该环境下代码即拿即用
Vue 3.5.13+
Openlayers 10.5.0+
Vite 6.3.5+
<template><div><div id="map" class="map"></div><table class="controls"><tr><td><label for="red">Red</label></td><td><input id="red" type="range" min="0" max="500" v-model="redValue" /></td><td><span>{{ redValue }}</span> %</td></tr><tr><td><label for="green">Green</label></td><td><inputid="green"type="range"min="0"max="500"v-model="greenValue"/></td><td><span>{{ greenValue }}</span> %</td></tr><tr><td><label for="blue">Blue</label></td><td><input id="blue" type="range" min="0" max="500" v-model="blueValue" /></td><td><span>{{ blueValue }}</span> %</td></tr></table></div>
</template><script setup>
import { ref, onMounted, onUnmounted, watch } from "vue";
import Map from "ol/Map.js";
import View from "ol/View.js";
import XYZ from "ol/source/XYZ.js";
import ImageLayer from "ol/layer/Image.js";
import RasterSource from "ol/source/Raster.js";
import "ol/ol.css";let map = null;
let raster = null;// 定义响应式变量,用于双向绑定
const redValue = ref(89);
const greenValue = ref(223);
const blueValue = ref(325);onMounted(() => {// 定义RGB调节函数const adjustRGB = function (imageData, data) {const pixels = imageData.data;const redMultiplier = data.red || 89;const greenMultiplier = data.green || 223;const blueMultiplier = data.blue || 325;// 遍历所有像素 (每4个值代表一个像素: R, G, B, A)for (let i = 0; i < pixels.length; i += 4) {pixels[i] = redMultiplier - pixels[i]; // Redpixels[i + 1] = greenMultiplier - pixels[i + 1]; // Greenpixels[i + 2] = blueMultiplier - pixels[i + 2]; // Blue}};// 创建栅格源 - 使用XYZ瓦片源raster = new RasterSource({sources: [new XYZ({url: "https://webrd04.is.autonavi.com/appmaptile?lang=zh_cn&size=1&scale=1&style=7&x={x}&y={y}&z={z}",crossOrigin: "anonymous", // 添加跨域支持}),],operationType: "image", // 设置为image模式,无卡顿高效渲染operation: function (pixels, data) {// 在image模式下,pixels[0]是ImageData对象const imageData = pixels[0];// 调用RGB调节函数adjustRGB(imageData, data);// 返回修改后的ImageDatareturn imageData;},// 将函数添加到lib中lib: {adjustRGB: adjustRGB,},});// 监听栅格操作前事件,将响应式变量的值传递给操作数据raster.on("beforeoperations", function (event) {const data = event.data;data.red = redValue.value;data.green = greenValue.value;data.blue = blueValue.value;});// 创建地图map = new Map({layers: [// 使用ImageLayer显示处理后的栅格new ImageLayer({source: raster,}),],target: "map",view: new View({center: [12958752, 4825923], // 中国中心坐标 (Web Mercator)zoom: 4,maxZoom: 18,}),});// 监听响应式变量的变化,并触发栅格图层更新watch([redValue, greenValue, blueValue], () => {if (raster) {raster.changed();}});
});onUnmounted(() => {if (map) {map.setTarget(null);map = null;}
});
</script><style scoped>
.map {width: 100vw;height: 100vh;
}
table.controls {position: absolute;top: 10px;right: 10px;background: rgba(255, 255, 255, 0.9);border-radius: 5px;padding: 10px;box-shadow: 0 2px 10px rgba(0, 0, 0, 0.1);z-index: 1000;
}
table.controls td {padding: 2px 5px;
}
table.controls td:nth-child(3) {text-align: right;min-width: 4.5em;
}
table.controls label {font-weight: bold;color: #333;
}
table.controls input[type="range"] {width: 150px;
}
table.controls span {color: #666;font-family: monospace;
}
/* 为不同的滑块添加颜色提示 */
table.controls tr:nth-child(1) input[type="range"] {accent-color: #ff4444;
}
table.controls tr:nth-child(2) input[type="range"] {accent-color: #44ff44;
}
table.controls tr:nth-child(3) input[type="range"] {accent-color: #4444ff;
}
</style>