根据 LiDAR 株高数据计算植被生物量
本文基于 LiDAR 株高数据计算植被生物量,步骤如下:
- 基于局部最大值提取树冠
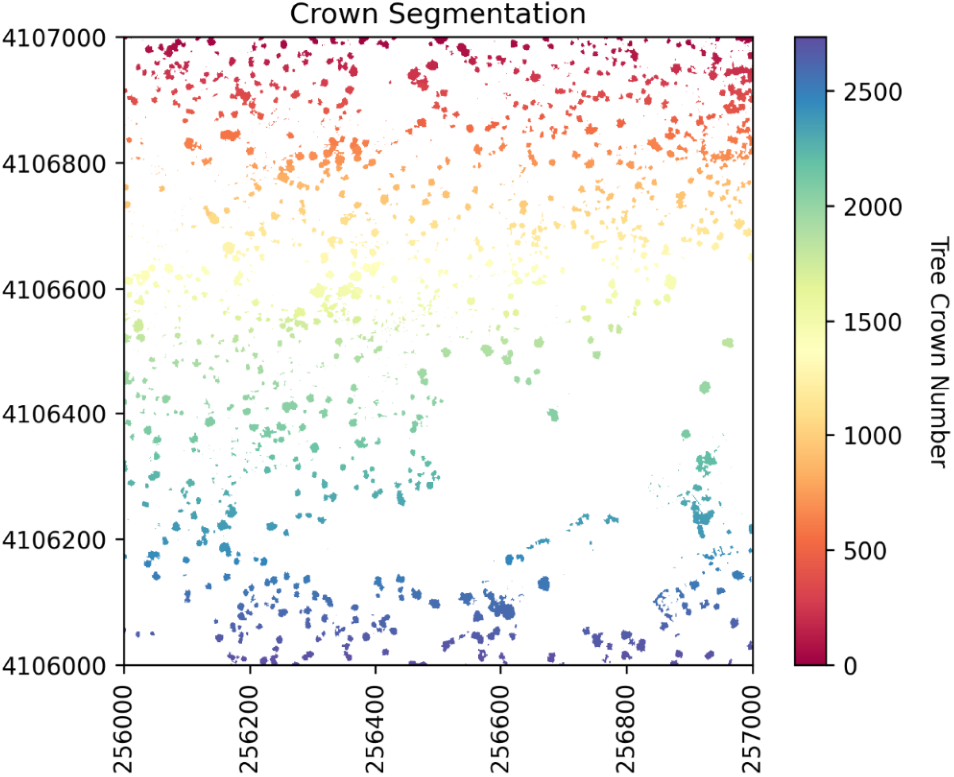
- 使用分水岭分割算法实现单木分割
- 提取单棵树的特征
- 基于已有数据构建生物量模型
- 基于提取的树特征预测生物量
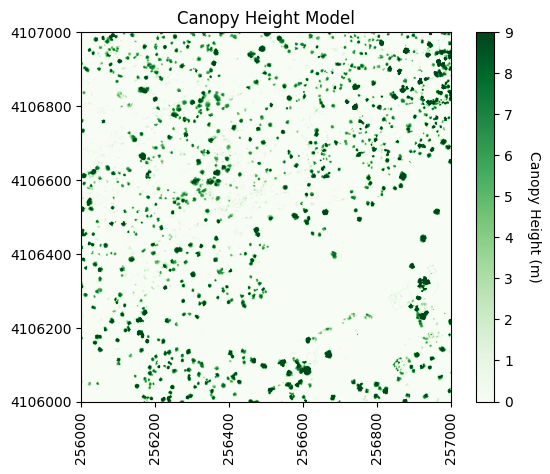
1 读取数据
chm_file = os.path.join(data_path,'NEON_D17_SJER_DP3_256000_4106000_CHM.tif')
chm_array, chm_array_metadata = raster2array(chm_file)
查看数据:
使用高斯平滑核(卷积)来去除虚假的高植被点:
#Smooth the CHM using a gaussian filter to remove spurious points
chm_array_smooth = ndi.gaussian_filter(chm_array,2,mode='constant',cval=0,truncate=2.0)
chm_array_smooth[chm_array==0] = 0
最重要的是第二个和第五个输入。第二个输入定义了高斯平滑核的标准差。值过大会导致过度平滑,值过小则可能会留下一些虚假的高点(过度分割)。第五个输入,即截断值,控制高斯核在经过多少个标准差后会被截断(因为理论上它会趋于无穷大)。
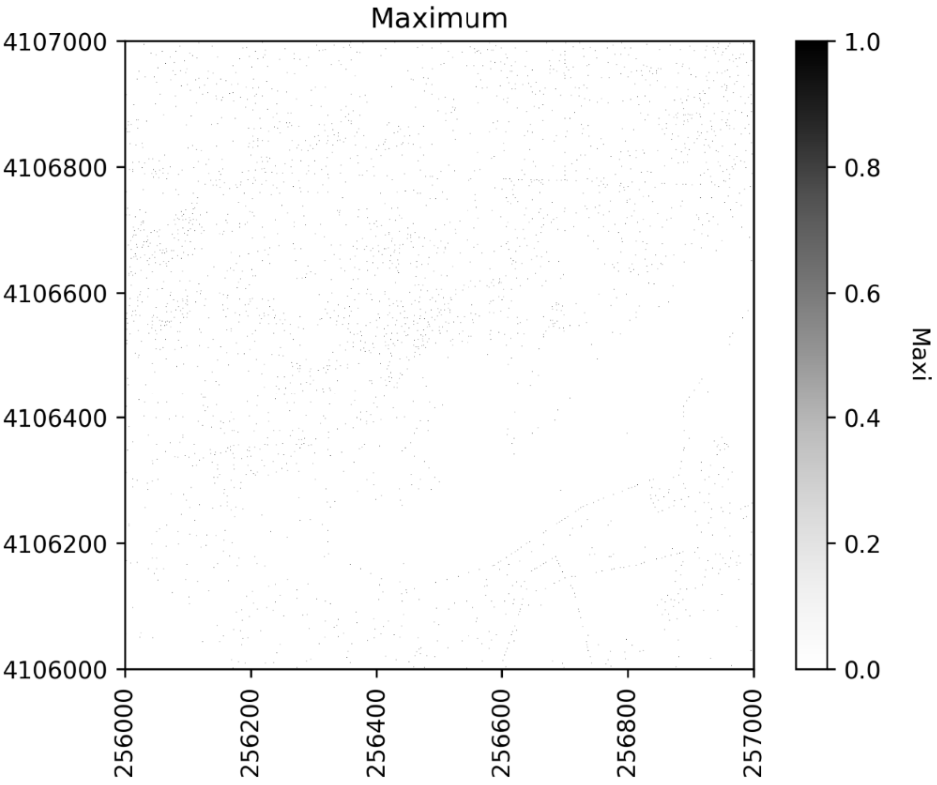
2 确定局部最大值
#Calculate local maximum points in the smoothed CHM
local_maxi = peak_local_max(chm_array_smooth,indices=False, footprint=np.ones((5, 5)))
将索引设置为False返回最大点的栅格,而不是坐标列表。足迹参数是只能找到一个峰的区域。
下图展示了过滤和未过滤 CHM 在查找局部最大值时的区别:
观察每种方法的树冠和局部最大值之间的重叠,它看起来有点像这个栅格。
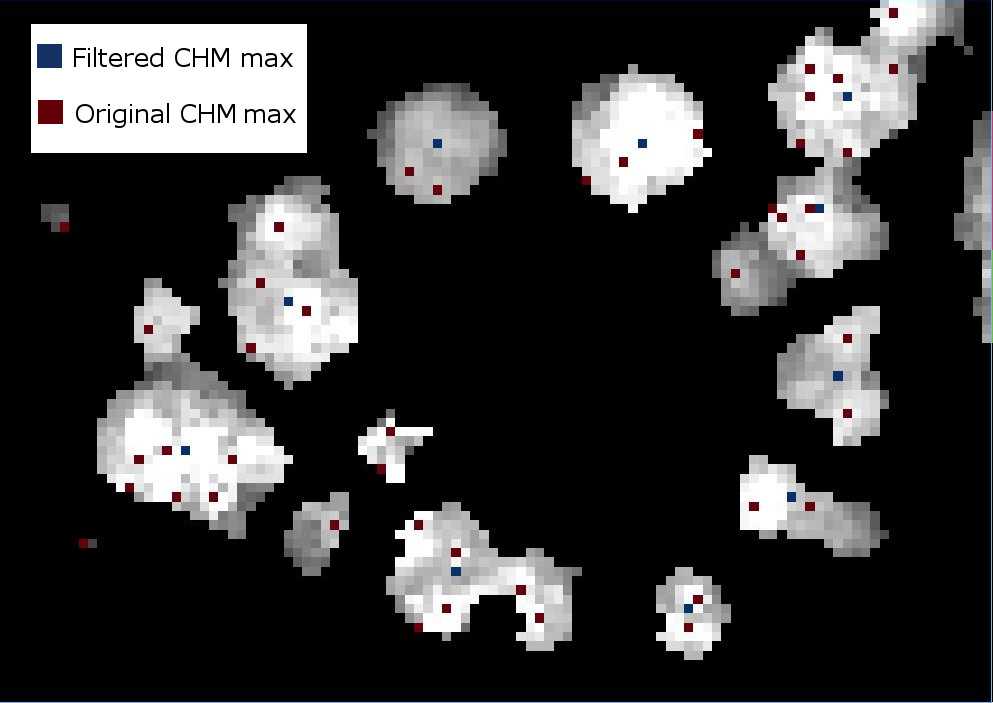
可以看出上图存在欠分割即相邻树冠高度相近时可能合并。
将标签应用于所有局部最大值点:
#Identify all the maximum points
markers = ndi.label(local_maxi)[0]
3 分水岭分割
创建一个包含所有植被点的 mask 层,以便流域分割仅发生在树木上,而不会延伸到周围的地面点。由于 0 表示 CHM 中的地面点,因此在 CHM 不为零的情况下将 mask 设置为 1 :
#Create a CHM mask so the segmentation will only occur on the trees
chm_mask = chm_array_smooth
chm_mask[chm_array_smooth != 0] = 1
就像河流系统一样,流域由一条山脊划分区域。在这里,流域是单独的树冠,而山脊则是每个树冠之间的分界线。类似下面的图:

#Perform watershed segmentation
labels = watershed(chm_array_smooth, markers, mask=chm_mask)
labels_for_plot = labels.copy()
labels_for_plot = np.array(labels_for_plot,dtype = np.float32)
labels_for_plot[labels_for_plot==0] = np.nan
max_labels = np.max(labels)
执行分水岭分割,生成标签栅格:
4 构造预测变量
获取单个树的几个属性,这些属性将用作预测变量:
# 获得树高和冠量百分位数
def crown_geometric_volume_pct(tree_data,min_tree_height,pct):p = np.percentile(tree_data, pct)tree_data_pct = [v if v < p else p for v in tree_data]crown_geometric_volume_pct = np.sum(tree_data_pct - min_tree_height)return crown_geometric_volume_pct, p# 获取预测变量
def get_predictors(tree, chm_array, labels):indexes_of_tree = np.asarray(np.where(labels==tree.label)).Ttree_crown_heights = chm_array[indexes_of_tree[:,0],indexes_of_tree[:,1]]full_crown = np.sum(tree_crown_heights - np.min(tree_crown_heights))crown50, p50 = crown_geometric_volume_pct(tree_crown_heights,tree.min_intensity,50)crown60, p60 = crown_geometric_volume_pct(tree_crown_heights,tree.min_intensity,60)crown70, p70 = crown_geometric_volume_pct(tree_crown_heights,tree.min_intensity,70)return [tree.label,np.float(tree.area),tree.major_axis_length,tree.max_intensity,tree.min_intensity, p50, p60, p70,full_crown, crown50, crown60, crown70]#Get the properties of each segment
tree_properties = regionprops(labels,chm_array)predictors_chm = np.array([get_predictors(tree, chm_array, labels) for tree in tree_properties])
X = predictors_chm[:,1:]
tree_ids = predictors_chm[:,0]
第一列为段 ID,其余列为预测变量,即树木标签、面积、主轴长度、最大高度、最小高度、高度百分位数(p50、p60、p70)以及树冠几何体积百分位数(全百分位数以及 50、60 和 70 百分位数)
5 构建训练模型
导入训练数据:
#Get the full path + training data file
training_data_file = os.path.join(data_path,'SJER_Biomass_Training.txt')#Read in the training data csv file into a numpy array
training_data = np.genfromtxt(training_data_file,delimiter=',') #Grab the biomass (Y) from the first column
biomass = training_data[:,0]#Grab the biomass predictors from the remaining columns
biomass_predictors = training_data[:,1:12]
构建模型:
#Define parameters for the Random Forest Regressor
max_depth = 30#Define regressor settings
regr_rf = RandomForestRegressor(max_depth=max_depth, random_state=2)#Fit the biomass to regressor variables
regr_rf.fit(biomass_predictors,biomass)
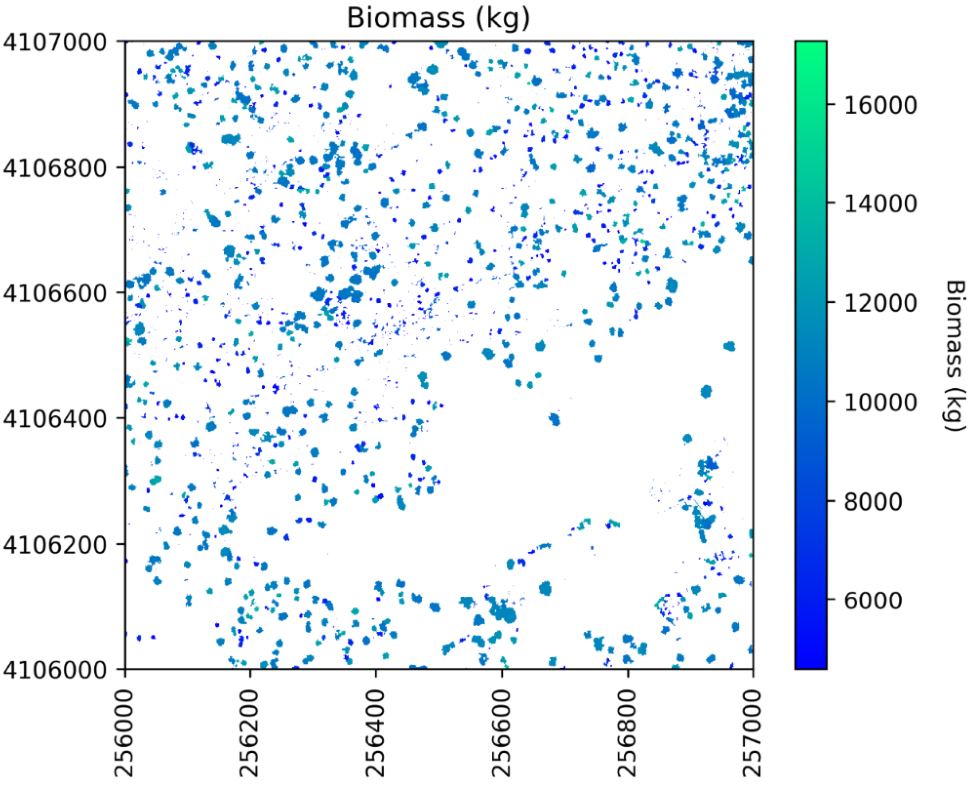
6 预测生物量
将随机森林模型应用于预测变量来估计生物量:
#Apply the model to the predictors
estimated_biomass = regr_rf.predict(X)
要输出栅格,先从标签栅格中预先分配(复制)一个数组,然后循环遍历各个单木分割并将生物量估计值分配给每个单独的分割:
#Set an out raster with the same size as the labels
biomass_map =  np.array((labels),dtype=float)
#Assign the appropriate biomass to the labels
biomass_map[biomass_map==0] = np.nan
for tree_id, biomass_of_tree_id in zip(tree_ids, estimated_biomass):biomass_map[biomass_map == tree_id] = biomass_of_tree_id