如何用docker部署ELK?
环境:
ELK 8.8.0
Ubuntu20.04
问题描述:
如何用docker部署ELK?

解决方案:
一、环境准备
(一)主机设置
-
安装 Docker Engine :版本需为 18.06.0 或更新。可通过命令
docker --version检查版本。安装方式根据操作系统不同而有所差异,在 Linux 系统上可通过包管理工具安装,如在 Ubuntu 上使用sudo apt-get install docker.io;在 CentOS 上使用sudo yum install docker。安装完成后,建议添加当前用户到 docker 用户组,以便无需 sudo 即可操作 Docker,执行命令sudo usermod -aG docker ${USER},然后重新登录使更改生效。 -
安装 Docker Compose :版本要求 2.0.0 或更新。可使用 Python 的 pip 包管理工具安装,命令为
pip install -U docker-compose。此外,也可以从 Docker 的官方 GitHub 仓库下载二进制文件进行安装。在 Linux 上,可以通过以下命令安装指定版本的 Docker Compose:sudo curl -L "https://github.com/docker/compose/releases/download/$(DOCKER_COMPOSE_VERSION)/docker-compose-$(uname -s)-$(uname -m)" -o /usr/local/bin/docker-compose sudo chmod +x /usr/local/bin/docker-compose将
$(DOCKER_COMPOSE_VERSION)替换为所需的版本号,如v2.21.0。
二、项目克隆与初始化
1.执行以下命令将 ELK 项目的仓库克隆到本地 Docker 主机:
git clone https://github.com/deviantony/docker-elk.git
2.进入项目目录:
cd docker-elk
新建.evn文件
touch .evn
设置下面相关密码
ELASTIC_VERSION=8.8.0
ELASTIC_PASSWORD=dff$#123e12
KIBANA_SYSTEM_PASSWORD=dff$#123e12
LOGSTASH_INTERNAL_PASSWORD=dff$#123e12
METRICBEAT_INTERNAL_PASSWORD=dff$#123e12Yor
FILEBEAT_INTERNAL_PASSWORD=dff$#123e12Your
HEARTBEAT_INTERNAL_PASSWORD=dff$#123e12urSt
MONITORING_INTERNAL_PASSWORD=dff$#123ePa
BEATS_SYSTEM_PASSWORD=dff$#123e12YoPas
按需更改配置文件
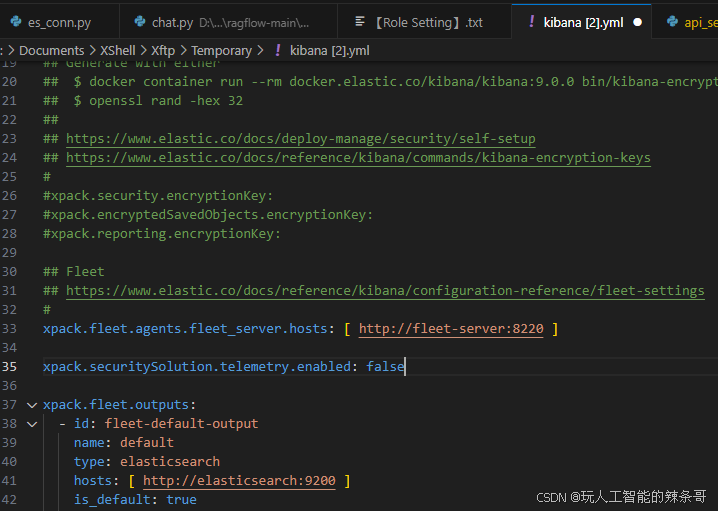
3.kibaba.yml新增下面内容
xpack.securitySolution.telemetry.enabled: false
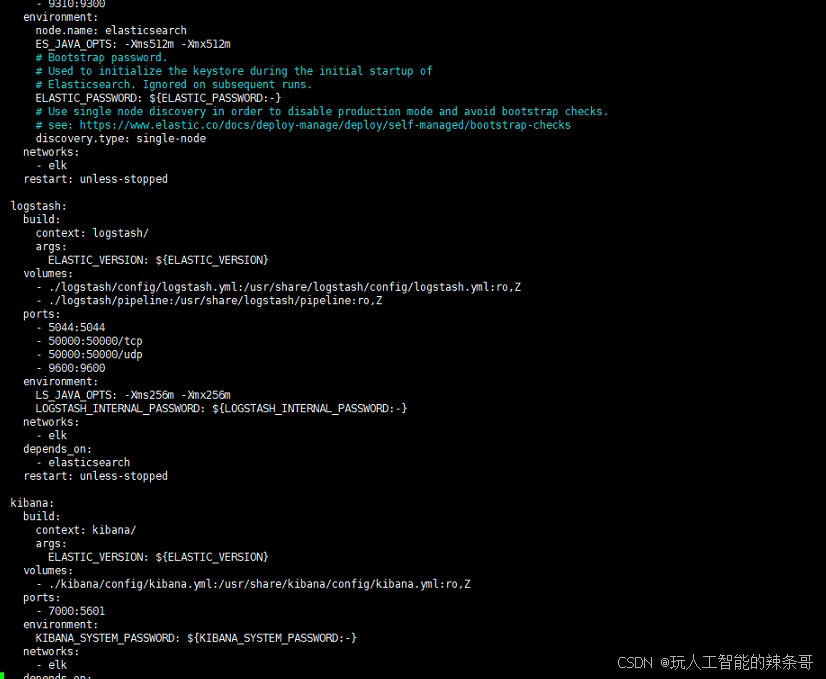
4.编写docker-compose.yml信息
nano docker-compose.yml
services:# The 'setup' service runs a one-off script which initializes users inside# Elasticsearch — such as 'logstash_internal' and 'kibana_system' — with the# values of the passwords defined in the '.env' file. It also creates the# roles required by some of these users.## This task only needs to be performed once, during the *initial* startup of# the stack. Any subsequent run will reset the passwords of existing users to# the values defined inside the '.env' file, and the built-in roles to their# default permissions.## By default, it is excluded from the services started by 'docker compose up'# due to the non-default profile it belongs to. To run it, either provide the# '--profile=setup' CLI flag to Compose commands, or "up" the service by name# such as 'docker compose up setup'.setup:profiles:- setupbuild:context: setup/args:ELASTIC_VERSION: ${ELASTIC_VERSION}init: truevolumes:- ./setup/entrypoint.sh:/entrypoint.sh:ro,Z- ./setup/lib.sh:/lib.sh:ro,Z- ./setup/roles:/roles:ro,Zenvironment:ELASTIC_PASSWORD: ${ELASTIC_PASSWORD:-}LOGSTASH_INTERNAL_PASSWORD: ${LOGSTASH_INTERNAL_PASSWORD:-}KIBANA_SYSTEM_PASSWORD: ${KIBANA_SYSTEM_PASSWORD:-}METRICBEAT_INTERNAL_PASSWORD: ${METRICBEAT_INTERNAL_PASSWORD:-}FILEBEAT_INTERNAL_PASSWORD: ${FILEBEAT_INTERNAL_PASSWORD:-}HEARTBEAT_INTERNAL_PASSWORD: ${HEARTBEAT_INTERNAL_PASSWORD:-}MONITORING_INTERNAL_PASSWORD: ${MONITORING_INTERNAL_PASSWORD:-}BEATS_SYSTEM_PASSWORD: ${BEATS_SYSTEM_PASSWORD:-}networks:- elkdepends_on:- elasticsearchelasticsearch:build:context: elasticsearch/args:ELASTIC_VERSION: ${ELASTIC_VERSION}volumes:- ./elasticsearch/config/elasticsearch.yml:/usr/share/elasticsearch/config/elasticsearch.yml:ro,Z- elasticsearch:/usr/share/elasticsearch/data:Zports:- 9210:9200- 9310:9300environment:node.name: elasticsearchES_JAVA_OPTS: -Xms512m -Xmx512m# Bootstrap password.# Used to initialize the keystore during the initial startup of# Elasticsearch. Ignored on subsequent runs.ELASTIC_PASSWORD: ${ELASTIC_PASSWORD:-}# Use single node discovery in order to disable production mode and avoid bootstrap checks.# see: https://www.elastic.co/docs/deploy-manage/deploy/self-managed/bootstrap-checksdiscovery.type: single-nodenetworks:- elkrestart: unless-stoppedlogstash:build:context: logstash/args:ELASTIC_VERSION: ${ELASTIC_VERSION}volumes:- ./logstash/config/logstash.yml:/usr/share/logstash/config/logstash.yml:ro,Z- ./logstash/pipeline:/usr/share/logstash/pipeline:ro,Zports:- 5044:5044- 50000:50000/tcp- 50000:50000/udp- 9600:9600environment:LS_JAVA_OPTS: -Xms256m -Xmx256mLOGSTASH_INTERNAL_PASSWORD: ${LOGSTASH_INTERNAL_PASSWORD:-}networks:- elkdepends_on:- elasticsearchrestart: unless-stoppedkibana:build:context: kibana/args:ELASTIC_VERSION: ${ELASTIC_VERSION}volumes:- ./kibana/config/kibana.yml:/usr/share/kibana/config/kibana.yml:ro,Zports:- 7000:5601environment:KIBANA_SYSTEM_PASSWORD: ${KIBANA_SYSTEM_PASSWORD:-}networks:- elkdepends_on:- elasticsearchrestart: unless-stoppedlogging:driver: "json-file"options:max-size: "10m"max-file: "3"networks:elk:driver: bridgevolumes:elasticsearch:按需改默认端口
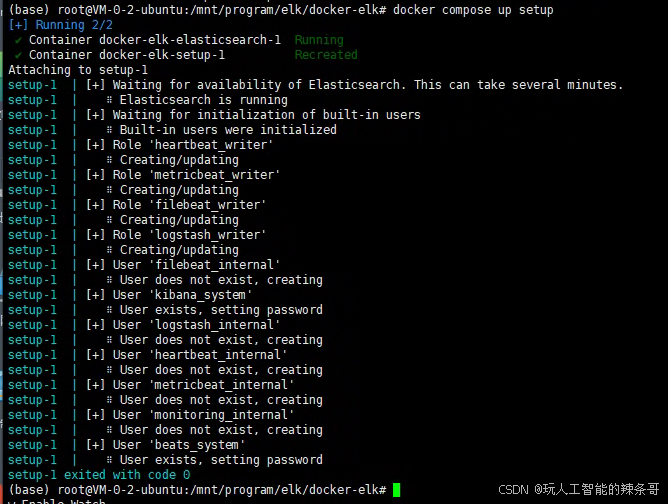
5.然后,初始化 Elasticsearch 用户和组,执行命令:
docker compose up setup
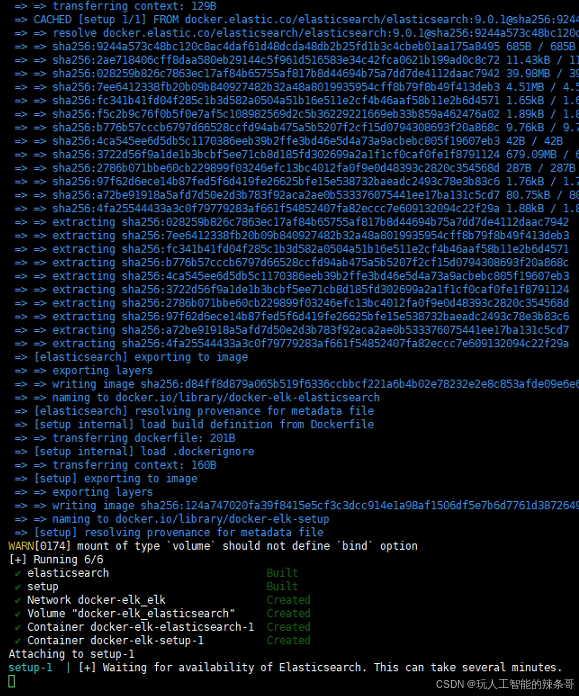
docker compose build setup
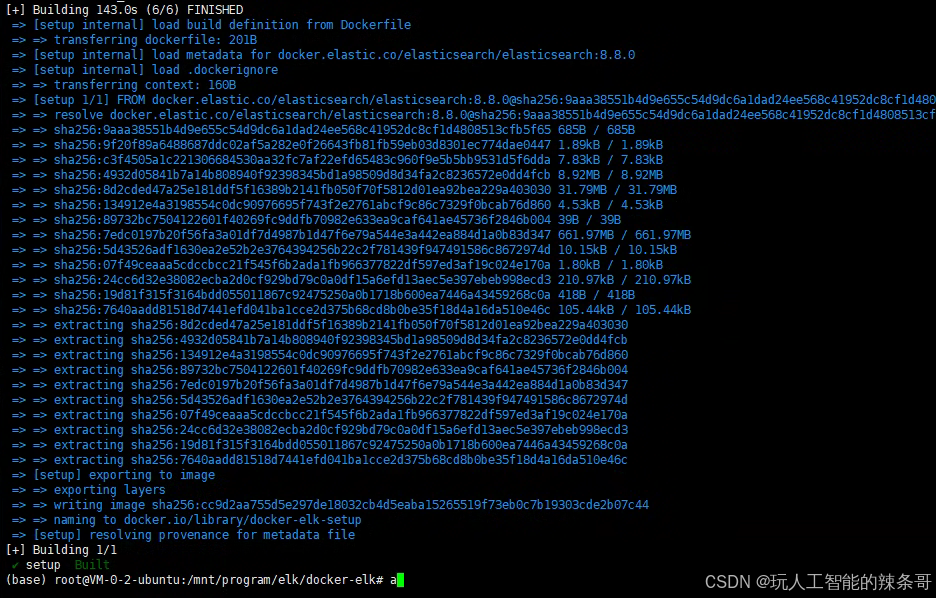
docker compose up setup
6.如果上述初始化过程顺利完成且无错误,接下来启动 ELK 堆栈的其他组件:
docker compose up
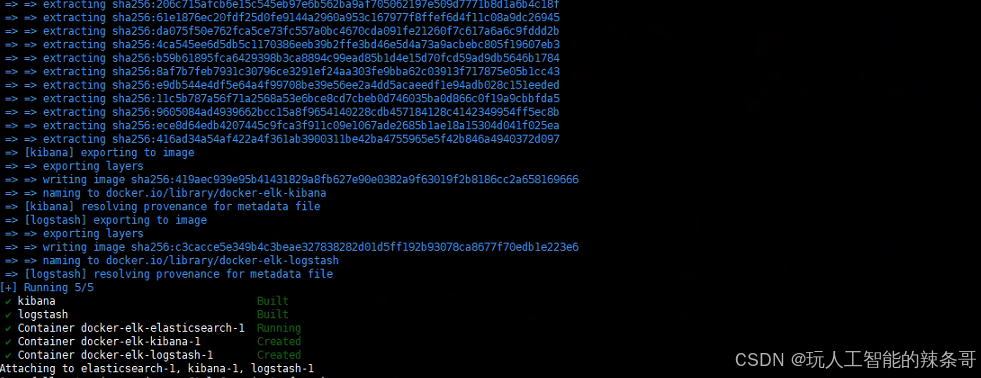
也可以在命令后加上 -d 标志,以背景模式(分离模式)运行所有服务(正式使用):
docker compose up -d
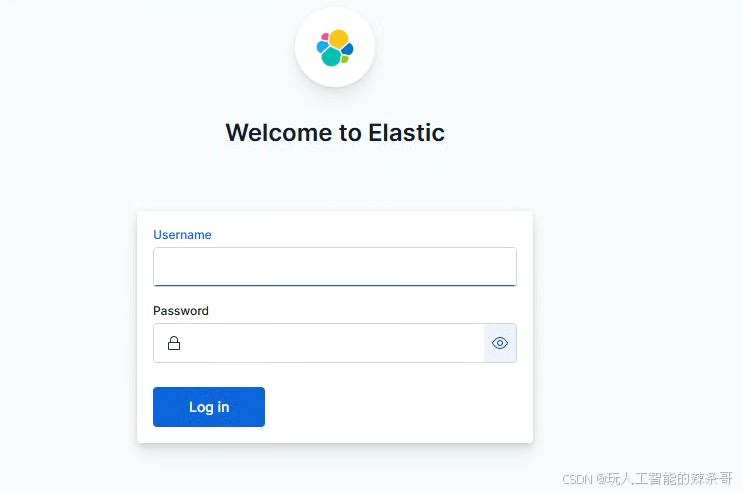
7.等待 Kibana 初始化完成(大约需要一分钟),通过浏览器访问 http://localhost:5601,使用上面你预设的用户名 elastic 和密码 changeme 登录。
禁用付费功能
可以在 Kibana 的许可证管理面板或使用 Elasticsearch 的 start_basic Licensing API 来取消正在进行的试用,从而恢复为基本许可证。需要指出的是,如果没有在试用到期日期之前将许可证切换到 basic 或进行升级,那么第二种方法是恢复对 Kibana 的访问权限的唯一途径。
二、配置使用
1.使用 Filebeat 采集本地 vllm.log
安装 Filebeat
如果尚未安装 Filebeat,可以参考如下命令(以 Ubuntu 为例):
curl -L -O https://artifacts.elastic.co/downloads/beats/filebeat/filebeat-8.6.3-amd64.deb
sudo dpkg -i filebeat-9.0.1-amd64.deb进入目标文件夹安装cd/mnt/program/Qwen3(base) root@VM-0-2-ubuntu:/mnt/program/Qwen3# sudo dpkg -i filebeat-9.0.1-amd64.deb
Selecting previously unselected package filebeat.
(Reading database ... 162166 files and directories currently installed.)
Preparing to unpack filebeat-9.0.1-amd64.deb ...
Unpacking filebeat (9.0.1) ...
Setting up filebeat (9.0.1) ...
2.启动服务
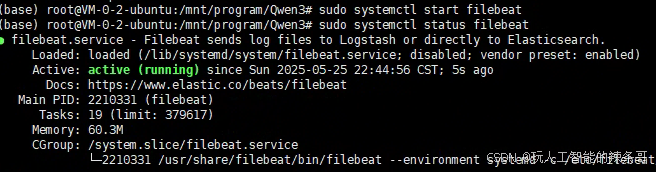
sudo systemctl start filebeat
查看状态
sudo systemctl status filebeat
查看日志
sudo journalctl -u filebeat -f
或者通过 apt 安装:
sudo apt-get install filebeat
3.查看配置文件
(base) root@VM-0-2-ubuntu:/mnt/program/Qwen3# cat  /etc/filebeat/filebeat.yml
###################### Filebeat Configuration Example ########################## This file is an example configuration file highlighting only the most common
# options. The filebeat.reference.yml file from the same directory contains all the
# supported options with more comments. You can use it as a reference.
#
# You can find the full configuration reference here:
# https://www.elastic.co/guide/en/beats/filebeat/index.html# For more available modules and options, please see the filebeat.reference.yml sample
# configuration file.# ============================== Filebeat inputs ===============================filebeat.inputs:# Each - is an input. Most options can be set at the input level, so
# you can use different inputs for various configurations.
# Below are the input-specific configurations.# filestream is an input for collecting log messages from files.
#- type: filestream
- type: journald# seek: cursor# Unique ID among all inputs, an ID is required.# id: qwen-vllm-journal#include_matches:# - _SYSTEMD_UNIT=qwen-vllm.service# 可选,设置最大读取的日志条数#max_entries: 1000# Change to true to enable this input configuration.enabled: trueunits:- qwen-vllm.service# Paths that should be crawled and fetched. Glob based paths.#paths:# - /var/log/*.log#- c:\programdata\elasticsearch\logs\*# Exclude lines. A list of regular expressions to match. It drops the lines that are# matching any regular expression from the list.# Line filtering happens after the parsers pipeline. If you would like to filter lines# before parsers, use include_message parser.#exclude_lines: ['^DBG']# Include lines. A list of regular expressions to match. It exports the lines that are# matching any regular expression from the list.# Line filtering happens after the parsers pipeline. If you would like to filter lines# before parsers, use include_message parser.#include_lines: ['^ERR', '^WARN']# Exclude files. A list of regular expressions to match. Filebeat drops the files that# are matching any regular expression from the list. By default, no files are dropped.#prospector.scanner.exclude_files: ['.gz$']# Optional additional fields. These fields can be freely picked# to add additional information to the crawled log files for filtering#fields:#  level: debug#  review: 1# journald is an input for collecting logs from Journald
#- type: journald# Unique ID among all inputs, if the ID changes, all entries# will be re-ingested#id: my-journald-id# The position to start reading from the journal, valid options are:#  - head: Starts reading at the beginning of the journal.#  - tail: Starts reading at the end of the journal.#    This means that no events will be sent until a new message is written.#  - since: Use also the `since` option to determine when to start reading from.#seek: head# A time offset from the current time to start reading from.# To use since, seek option must be set to since.#since: -24h# Collect events from the service and messages about the service,# including coredumps.#units:#- docker.service# ============================== Filebeat modules ==============================filebeat.config.modules:# Glob pattern for configuration loadingpath: ${path.config}/modules.d/*.yml# Set to true to enable config reloadingreload.enabled: false# Period on which files under path should be checked for changes#reload.period: 10s# ======================= Elasticsearch template setting =======================setup.template.settings:index.number_of_shards: 1#index.codec: best_compression#_source.enabled: false# ================================== General ===================================# The name of the shipper that publishes the network data. It can be used to group
# all the transactions sent by a single shipper in the web interface.
#name:# The tags of the shipper are included in their field with each
# transaction published.
#tags: ["service-X", "web-tier"]# Optional fields that you can specify to add additional information to the
# output.
#fields:
#  env: staging# ================================= Dashboards =================================
# These settings control loading the sample dashboards to the Kibana index. Loading
# the dashboards is disabled by default and can be enabled either by setting the
# options here or by using the `setup` command.
#setup.dashboards.enabled: false# The URL from where to download the dashboard archive. By default, this URL
# has a value that is computed based on the Beat name and version. For released
# versions, this URL points to the dashboard archive on the artifacts.elastic.co
# website.
#setup.dashboards.url:# =================================== Kibana ===================================# Starting with Beats version 6.0.0, the dashboards are loaded via the Kibana API.
# This requires a Kibana endpoint configuration.
setup.kibana:host: "http://localhost:7000"# Kibana Host# Scheme and port can be left out and will be set to the default (http and 5601)# In case you specify and additional path, the scheme is required: http://localhost:5601/path# IPv6 addresses should always be defined as: https://[2001:db8::1]:5601#host: "localhost:5601"# Kibana Space ID# ID of the Kibana Space into which the dashboards should be loaded. By default,# the Default Space will be used.#space.id:# =============================== Elastic Cloud ================================# These settings simplify using Filebeat with the Elastic Cloud (https://cloud.elastic.co/).# The cloud.id setting overwrites the `output.elasticsearch.hosts` and
# `setup.kibana.host` options.
# You can find the `cloud.id` in the Elastic Cloud web UI.
#cloud.id:# The cloud.auth setting overwrites the `output.elasticsearch.username` and
# `output.elasticsearch.password` settings. The format is `<user>:<pass>`.
#cloud.auth:# ================================== Outputs ===================================# Configure what output to use when sending the data collected by the beat.# ---------------------------- Elasticsearch Output ----------------------------
output.elasticsearch:# Array of hosts to connect to.hosts: ["localhost:9210"]username: "elastic"password: "dff$#123e12"# Performance preset - one of "balanced", "throughput", "scale",# "latency", or "custom".preset: balanced# Protocol - either `http` (default) or `https`.#protocol: "https"# Authentication credentials - either API key or username/password.#api_key: "id:api_key"#username: "elastic"#password: "changeme"# ------------------------------ Logstash Output -------------------------------
#output.logstash:# The Logstash hosts#hosts: ["localhost:5044"]# Optional SSL. By default is off.# List of root certificates for HTTPS server verifications#ssl.certificate_authorities: ["/etc/pki/root/ca.pem"]# Certificate for SSL client authentication#ssl.certificate: "/etc/pki/client/cert.pem"# Client Certificate Key#ssl.key: "/etc/pki/client/cert.key"# ================================= Processors =================================
processors:- add_host_metadata:when.not.contains.tags: forwarded- add_cloud_metadata: ~- add_docker_metadata: ~- add_kubernetes_metadata: ~# ================================== Logging ===================================# Sets log level. The default log level is info.
# Available log levels are: error, warning, info, debug
#logging.level: debug# At debug level, you can selectively enable logging only for some components.
# To enable all selectors, use ["*"]. Examples of other selectors are "beat",
# "publisher", "service".
#logging.selectors: ["*"]# ============================= X-Pack Monitoring ==============================
# Filebeat can export internal metrics to a central Elasticsearch monitoring
# cluster.  This requires xpack monitoring to be enabled in Elasticsearch.  The
# reporting is disabled by default.# Set to true to enable the monitoring reporter.
#monitoring.enabled: false# Sets the UUID of the Elasticsearch cluster under which monitoring data for this
# Filebeat instance will appear in the Stack Monitoring UI. If output.elasticsearch
# is enabled, the UUID is derived from the Elasticsearch cluster referenced by output.elasticsearch.
#monitoring.cluster_uuid:# Uncomment to send the metrics to Elasticsearch. Most settings from the
# Elasticsearch outputs are accepted here as well.
# Note that the settings should point to your Elasticsearch *monitoring* cluster.
# Any setting that is not set is automatically inherited from the Elasticsearch
# output configuration, so if you have the Elasticsearch output configured such
# that it is pointing to your Elasticsearch monitoring cluster, you can simply
# uncomment the following line.
#monitoring.elasticsearch:# ============================== Instrumentation ===============================# Instrumentation support for the filebeat.
#instrumentation:# Set to true to enable instrumentation of filebeat.#enabled: false# Environment in which filebeat is running on (eg: staging, production, etc.)#environment: ""# APM Server hosts to report instrumentation results to.#hosts:#  - http://localhost:8200# API Key for the APM Server(s).# If api_key is set then secret_token will be ignored.#api_key:# Secret token for the APM Server(s).#secret_token:# ================================= Migration ==================================# This allows to enable 6.7 migration aliases
#migration.6_to_7.enabled: true
配置 Filebeat 采集 vllm.log
编辑 Filebeat 配置文件 /etc/filebeat/filebeat.yml,添加 vllm.log 的采集路径:
base) root@VM-0-2-ubuntu:/mnt/program/Qwen3# nano /etc/filebeat/filebeat.yml
(base) root@VM-0-2-ubuntu:/mnt/program/Qwen3# sudo filebeat test config
Config OK
sudo filebeat modules enable system
nano /etc/filebeat/modules.d/system.yml
# Module: system
# Docs: https://www.elastic.co/guide/en/beats/filebeat/main/filebeat-module-system.html- module: system# Syslogsyslog:enabled: true var.paths: ["/var/log/syslog*","/var/log/messages*"]journal:enabled: truevar.include_matches:- _SYSTEMD_UNIT=qwen-vllm.service# Set custom paths for the log files. If left empty,# Filebeat will choose the paths depending on your OS.#var.paths:# Use journald to collect system logs#var.use_journald: false# Authorization logsauth:enabled: false# Set custom paths for the log files. If left empty,# Filebeat will choose the paths depending on your OS.#var.paths:# Use journald to collect auth logs#var.use_journald: false
filebeat.inputs:
- type: logenabled: truepaths:- /path/to/vllm.log # 替换为实际 vllm.log 文件路径fields:log_type: vllmfields_under_root: truemultiline.pattern: '^\[' # 如果 vllm.log 是多行日志,例如异常堆栈,可以配置 multilinemultiline.negate: truemultiline.match: afteroutput.elasticsearch:hosts: ["localhost:9200"] # Elasticsearch 地址,调整为您的地址
fields 可以自定义字段,方便 Kibana 过滤查询;
4.如果 ELK 通过 Logstash 处理日志,可以将输出改为 Logstash:
output.logstash:hosts: ["localhost:5044"]
启动并测试 Filebeat
sudo systemctl enable filebeat
sudo systemctl start filebeat
sudo tail -f /var/log/filebeat/filebeat
确认 Filebeat 正常采集并发送日志。
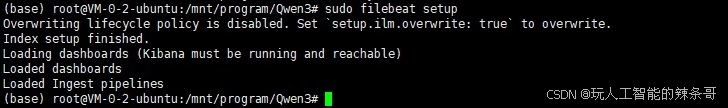
5.设置 Filebeat 并重启
sudo filebeat setup
sudo systemctl restart filebeat
验证是否正常采集日志
sudo journalctl -u qwen-vllm.service -f
sudo tail -f /var/log/filebeat/filebeat
观察 Filebeat 日志是否有采集到相关日志事件。
6.web配置
1. 创建 Data View
- 进入 Kibana:
- 打开 Kibana 并登录。
- 进入 Data Views:
- 在左侧导航栏中,点击 Kibana,然后选择 Data Views。
- 创建新的 Data View:
- 点击 Create data view。
- 在 Name 字段中,输入一个名称(例如:
filebeat-logs)。 - 在 Index pattern 字段中,输入索引名称(例如:
.ds-filebeat-9.0.1-2025.05.25-000001或filebeat-*)。 - 如果需要,选择时间字段(通常是
@timestamp)。 - 点击 Save data view。
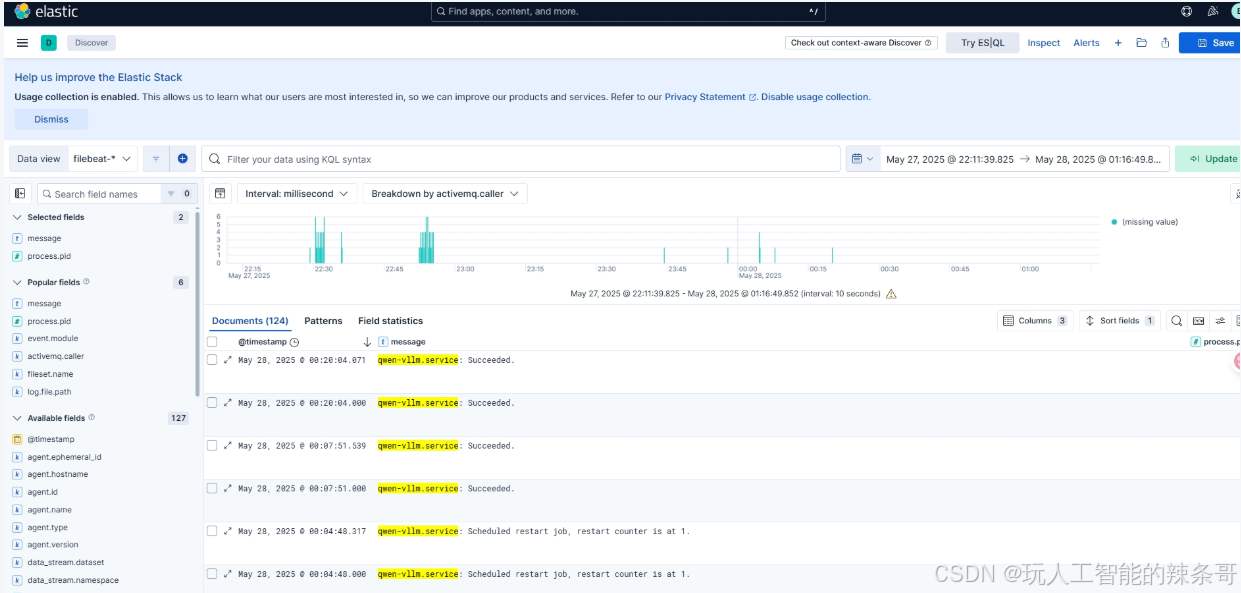
2. 查看日志数据
- 进入 Discover:
- 在左侧导航栏中,点击 Discover。
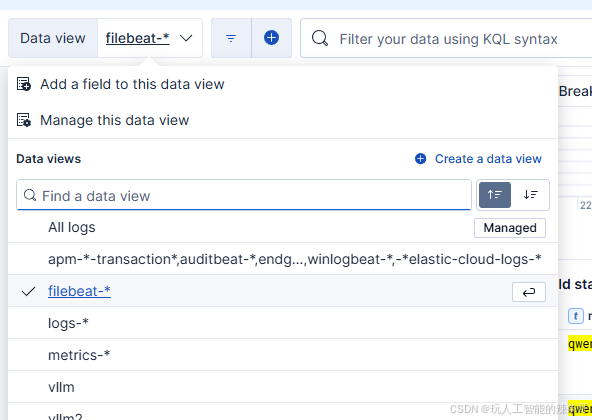
- 选择 Data View:
- 在左上角的下拉菜单中,选择刚刚创建的 Data View(例如:
filebeat-logs)。
- 在左上角的下拉菜单中,选择刚刚创建的 Data View(例如:
- 查看日志:
- Kibana 会显示该索引中的日志数据。
- 使用时间过滤器(右上角)和搜索栏(顶部)来筛选和搜索日志。
- 查看字段:
- 在左侧的字段列表中,点击字段名称可以查看该字段的值分布。
- 您可以通过点击字段名称旁边的 Add 按钮,将字段添加到日志表格中。
3. 使用过滤器
- 时间过滤器:
- 在右上角的时间选择器中,选择要查看的时间范围(例如:最近 15 分钟、最近 1 小时等)。
- 字段过滤器:
- 在日志表格中,点击某个字段的值,然后选择 Filter for value 或 Filter out value。
- 搜索栏:
- 在顶部的搜索栏中,输入关键字或 Lucene 查询语法来过滤日志(例如:
message: "error")。
- 在顶部的搜索栏中,输入关键字或 Lucene 查询语法来过滤日志(例如:
4. 保存和导出
- 保存搜索:
- 在顶部点击 Save,可以将当前的搜索条件保存为一个视图,方便下次快速访问。
- 导出数据:
- 在顶部点击 Share,然后选择 CSV Reports 或 Raw Documents,可以将日志数据导出为 CSV 或 JSON 文件。
5. 可视化日志数据
- 进入 Visualize Library:
- 在左侧导航栏中,点击 Visualize Library。
- 创建可视化:
- 点击 Create visualization,选择图表类型(如柱状图、饼图等)。
- 选择数据源(如
filebeat-logsData View)。 - 配置 X 轴和 Y 轴,例如:按时间统计日志数量,或按字段值分组统计。
- 保存可视化:
- 完成后,点击 Save 保存可视化。
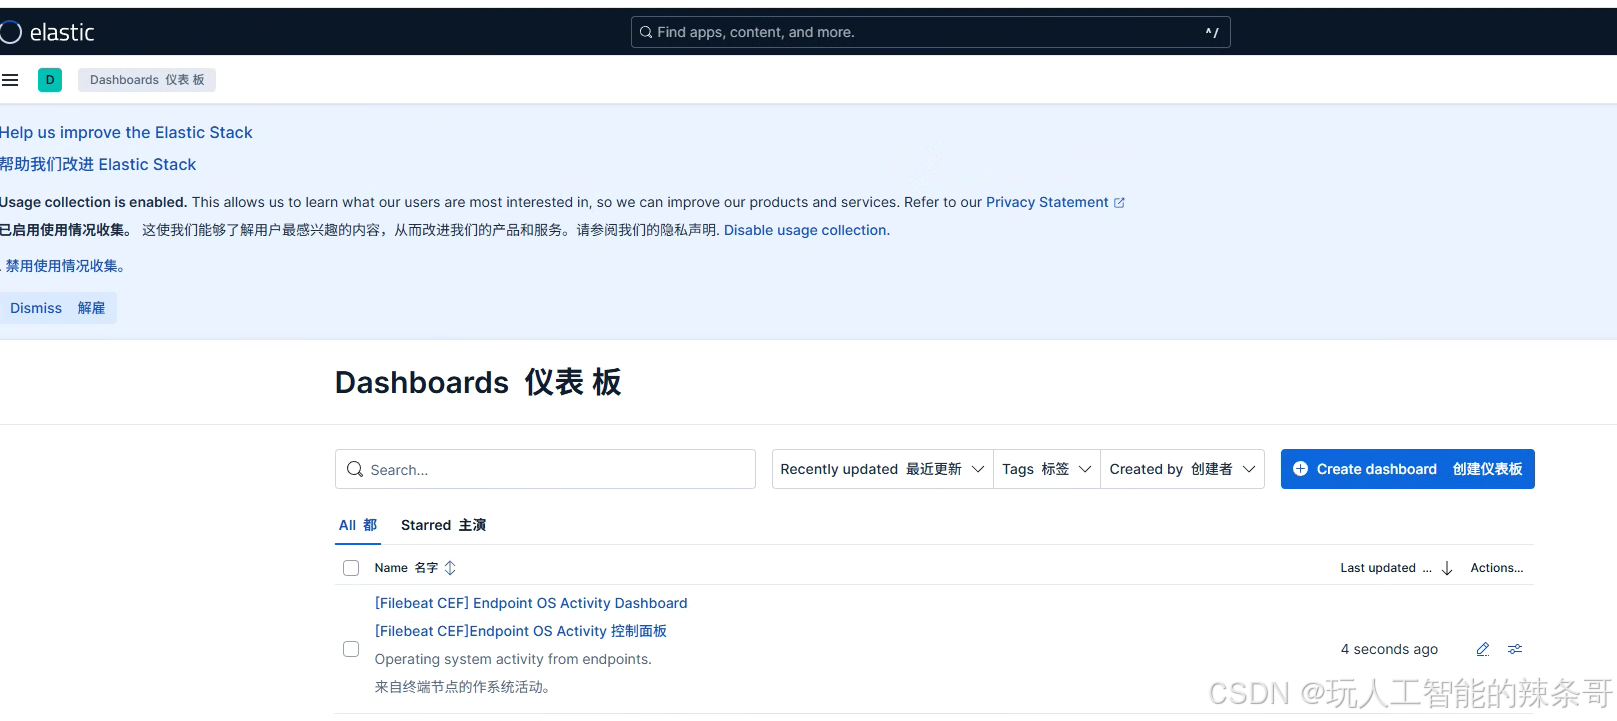
6. 使用 Dashboard
- 进入 Dashboard:
- 在左侧导航栏中,点击 Dashboard。
- 创建仪表板:
- 点击 Create dashboard。
- 添加之前创建的可视化图表或保存的搜索视图。
- 保存仪表板:
- 完成后,点击 Save 保存仪表板。