STM32通过rt_hw_hard_fault_exception中的LR寄存器追溯程序问题
1. 问题现象
程序运行导致rt_hw_hard_fault_exception
如图
显示错误相关代码
struct exception_stack_frame
{uint32_t r0;uint32_t r1;uint32_t r2;uint32_t r3;uint32_t r12; uint32_t lr; // 链接寄存器 (LR)uint32_t pc; // 程序计数器 (PC)uint32_t psr; // 程序状态寄存器 (PSR)
};void rt_hw_hard_fault_exception(struct exception_stack_frame *contex)
{Fm24cl64bInit();
// static struct exception_stack_frame test;static CoreRegister_Type s_error_save;
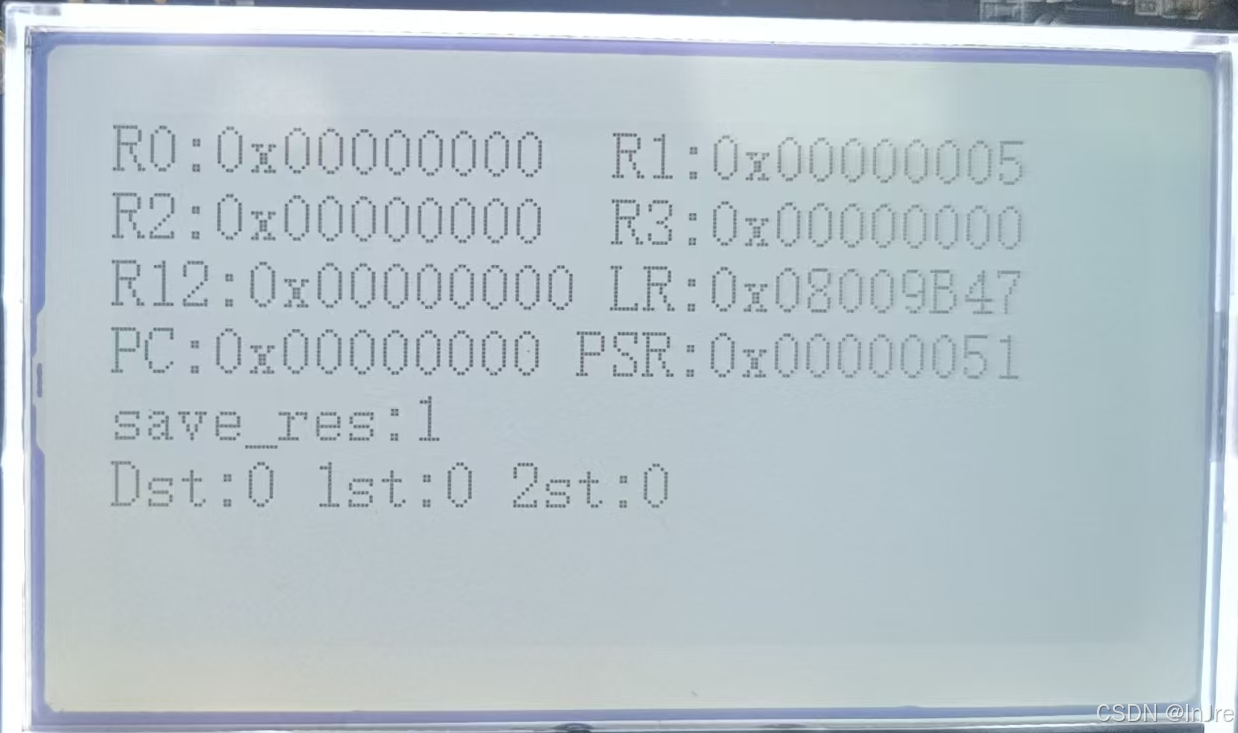
// test = *contex; s_error_save.r0 = contex->r0;s_error_save.r1 = contex->r1;s_error_save.r2 = contex->r2;s_error_save.r3 = contex->r3;s_error_save.r12 = contex->r12;s_error_save.lr = contex->lr;s_error_save.pc = contex->pc;s_error_save.psr = contex->psr;uint8_t save_res = WriteCoreRegisterToEeprom(&s_error_save);lcd_Init();lcd_Init_PowerOn();lcd_Init_BackLight(1);lcd_BufferClear();lcd_BufferPrint(0, 0, 16, "R0:0x%08X R1:0x%08X", s_error_save.r0, s_error_save.r1);lcd_BufferPrint(0, 2, 16, "R2:0x%08X R3:0x%08X", s_error_save.r2, s_error_save.r3);lcd_BufferPrint(0, 4, 16, "R12:0x%08X LR:0x%08X", s_error_save.r12, s_error_save.lr);lcd_BufferPrint(0, 6, 16, "PC:0x%08X PSR:0x%08X", s_error_save.pc, s_error_save.psr);lcd_BufferPrint(0, 8, 16, "save_res:%d", save_res);lcd_BufferPrint(0, 10, 16, "Dst:%d 1st:%d 2st:%d", msg.MsgDstId, msg.FirstSubId, msg.SecondSubId);lcd_ScreenRefresh();while(1);
}
2. 问题分析
在ARM Cortex-M架构中,LR (Link Register, R14) 的值在HardFault或其他异常发生时,对追溯问题根源非常关键。
LR—保存函数返回地址
3. 问题追溯
1. 定位触发HardFault的代码位置
通过 LR:0x08009B47 找到对应的代码位置
使用调试器(如ST-Link + IDE)直接跳转到该地址。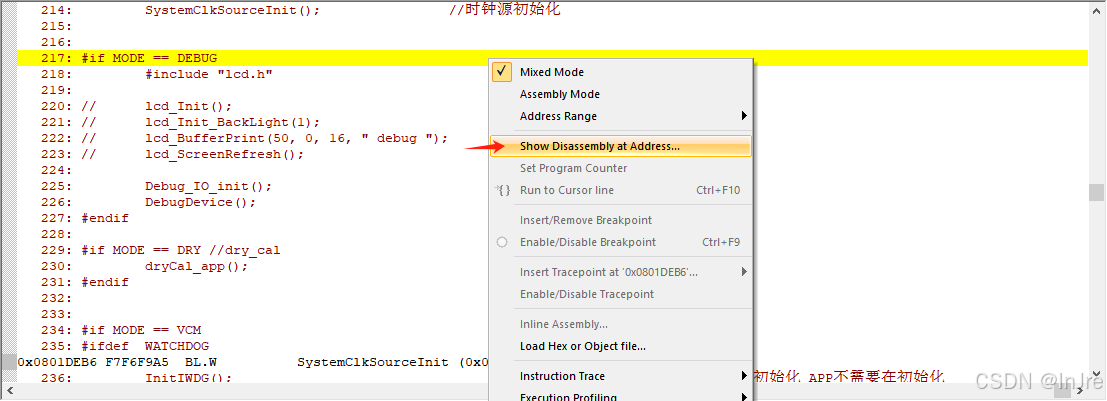
2. 分析LR地址附近的代码
常见触发HardFault的操作:
- 访问非法地址(野指针、数组越界)。
- 未对齐的内存访问(如对非4字节对齐地址执行LDR)。
- 堆栈溢出(检查线程栈大小是否足够)。
- 错误的函数指针调用(如跳转到无效地址)
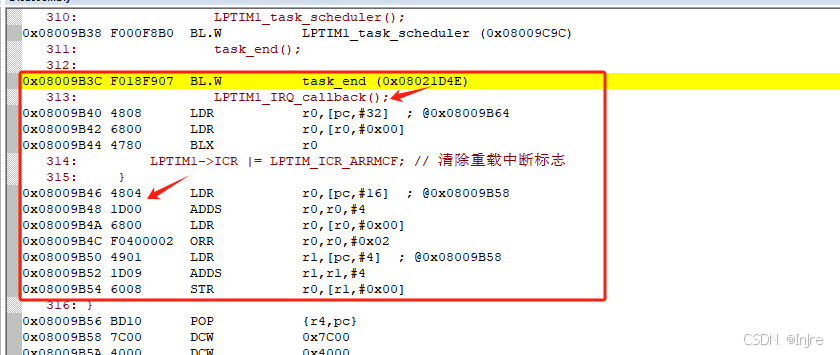
这里的LPTIM1_IRQ_callback是个空指针,最终导致硬件错误。