如何使用DeepSeek制作数学动态可视化课件?
数学的公式,很多时候直接上手都比较难以理解,但是如果通过可视化的方式,就会变得相对容易很多。很多老师都希望自己讲解的时候有相关类似的课件,但是限于技术能力,很多人都望而却步。
现在随着 DeepSeek 的强大,我们可以通过 DeepSeek 来进行相应的代码编程,从而实现数学问题和公式的可视化表达。现在我们来看一下怎么做吧。
我们本次使用的是腾讯元宝,腾讯元宝目前支持最新版的 DeepSeek V3 0324版本,具备非常强大的前端代码申城能力,并且支持输出代码的直接预览,非常的好用。首先我们进入元宝,可以直接输入这样的提示词:
“生成一个[你要问的数学问题或公式]的演示前端 HTML 动画,直观表达这个数学问题(公式),带上相关的交互操作”其中“[你要问的数学问题或公式]”可以是你要问的任何数学问题或公式,物理、化学的也可以。
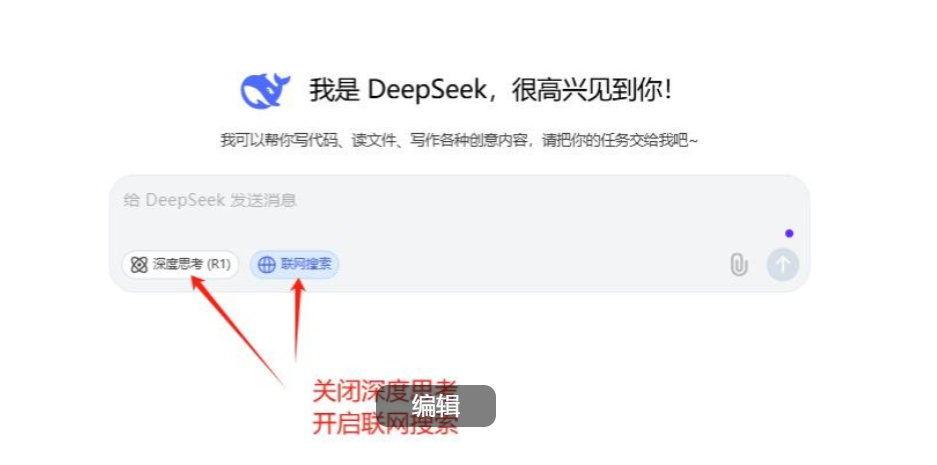
在问之前,我们需要先在输入框中选择 DeepSeek,关掉 R1·深度思考,关掉联网搜索。
提示词:生成一个三角函数波形演示前端HTML动画,直观表达这个数学问题(公式),带上相关的交互操作。
分享HTML代码网址:https://www.32kw.com/
己生成数学公式网址:https://www.32kw.com/view/0e0ae2b
代码:
<!DOCTYPE html>
<html lang="zh-CN">
<head>
<meta charset="UTF-8">
<meta name="viewport" content="width=device-width, initial-scale=1.0">
<title>三角函数波形演示器</title>
<style>
body {
font-family: 'Arial', sans-serif;
max-width: 900px;
margin: 0 auto;
padding: 20px;
background-color: #f5f5f5;
color: #333;
}
h1 {
color: #2c3e50;
text-align: center;
}
.container {
background-color: white;
border-radius: 8px;
padding: 20px;
box-shadow: 0 2px 10px rgba(0,0,0,0.1);
}
.canvas-container {
position: relative;
margin: 20px 0;
}
canvas {
background-color: #fff;
border: 1px solid #ddd;
display: block;
margin: 0 auto;
}
.controls {
display: flex;
flex-wrap: wrap;
gap: 15px;
margin-bottom: 20px;
}
.control-group {
flex: 1;
min-width: 200px;
}
label {
display: block;
margin-bottom: 5px;
font-weight: bold;
}
input[type="range"] {
width: 100%;
}
.value-display {
font-size: 0.9em;
color: #666;
text-align: center;
}
.function-selector {
margin-bottom: 15px;
}
button {
background-color: #3498db;
color: white;
border: none;
padding: 8px 15px;
border-radius: 4px;
cursor: pointer;
margin-right: 10px;
transition: background-color 0.3s;
}
button:hover {
background-color: #2980b9;
}
button.active {
background-color: #2c3e50;
}
.legend {
display: flex;
justify-content: center;
gap: 20px;
margin-top: 10px;
}
.legend-item {
display: flex;
align-items: center;
}
.legend-color {
width: 15px;
height: 15px;
margin-right: 5px;
border-radius: 3px;
}
.description {
margin-top: 20px;
padding: 15px;
background-color: #f8f9fa;
border-radius: 5px;
border-left: 4px solid #3498db;
}
</style>
</head>
<body>
<div class="container">
<h1>三角函数波形演示器</h1>
<div class="function-selector">
<button id="sinBtn" class="active">正弦函数 (sin)</button>
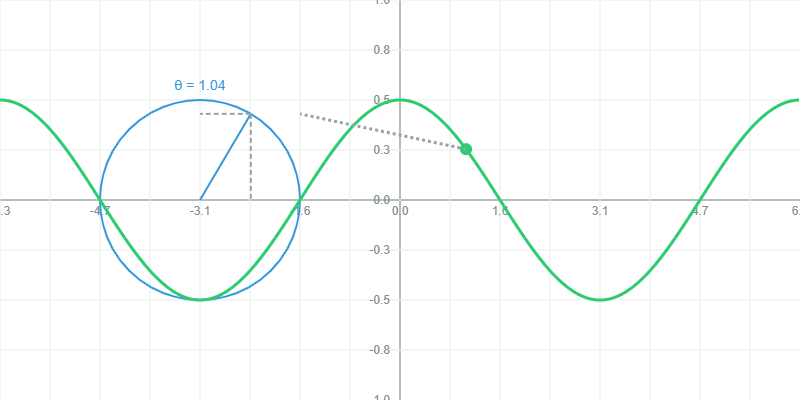
<button id="cosBtn">余弦函数 (cos)</button>
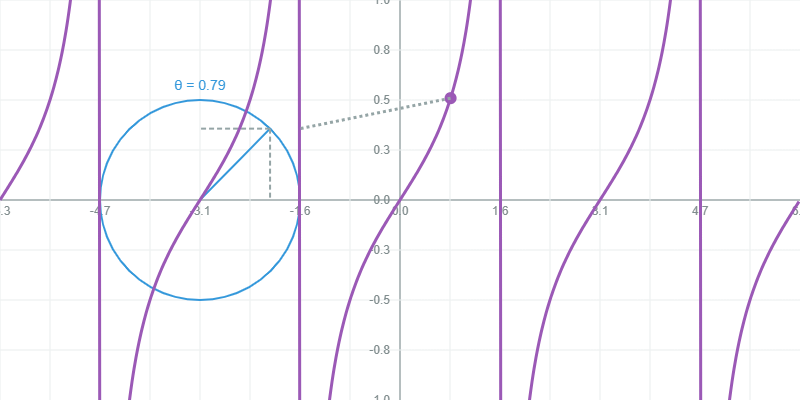
<button id="tanBtn">正切函数 (tan)</button>
</div>
<div class="canvas-container">
<canvas id="waveCanvas" width="800" height="400"></canvas>
<div class="legend">
<div class="legend-item">
<div class="legend-color" style="background-color: #e74c3c;"></div>
<span>函数波形</span>
</div>
<div class="legend-item">
<div class="legend-color" style="background-color: #3498db;"></div>
<span>单位圆</span>
</div>
</div>
</div>
<div class="controls">
<div class="control-group">
<label for="amplitude">振幅 (A)</label>
<input type="range" id="amplitude" min="0.1" max="2" step="0.1" value="1">
<div class="value-display">当前值: <span id="amplitudeValue">1</span></div>
</div>
<div class="control-group">
<label for="frequency">频率 (ω)</label>
<input type="range" id="frequency" min="0.5" max="3" step="0.5" value="1">
<div class="value-display">当前值: <span id="frequencyValue">1</span></div>
</div>
<div class="control-group">
<label for="phase">相位 (φ)</label>
<input type="range" id="phase" min="0" max="6.28" step="0.1" value="0">
<div class="value-display">当前值: <span id="phaseValue">0</span></div>
</div>
</div>
<div class="description">
<h3>三角函数简介</h3>
<p>三角函数是数学中重要的函数,描述了直角三角形中边与角的关系,也可推广到单位圆上。</p>
<ul>
<li><strong>正弦函数 (sin)</strong>: y = A·sin(ωx + φ)</li>
<li><strong>余弦函数 (cos)</strong>: y = A·cos(ωx + φ)</li>
<li><strong>正切函数 (tan)</strong>: y = A·tan(ωx + φ)</li>
</ul>
<p>使用滑块调整参数观察波形变化,点击按钮切换不同函数。</p>
</div>
</div>
<script>
// 获取DOM元素
const canvas = document.getElementById('waveCanvas');
const ctx = canvas.getContext('2d');
const sinBtn = document.getElementById('sinBtn');
const cosBtn = document.getElementById('cosBtn');
const tanBtn = document.getElementById('tanBtn');
// 控制元素
const amplitudeSlider = document.getElementById('amplitude');
const frequencySlider = document.getElementById('frequency');
const phaseSlider = document.getElementById('phase');
// 显示值的元素
const amplitudeValue = document.getElementById('amplitudeValue');
const frequencyValue = document.getElementById('frequencyValue');
const phaseValue = document.getElementById('phaseValue');
// 初始参数
let currentFunction = 'sin';
let amplitude = 1;
let frequency = 1;
let phase = 0;
let animationId = null;
let angle = 0;
// 颜色定义
const colors = {
sin: '#e74c3c',
cos: '#2ecc71',
tan: '#9b59b6',
circle: '#3498db',
axis: '#7f8c8d',
grid: '#ecf0f1'
};
// 更新显示值
function updateDisplayValues() {
amplitudeValue.textContent = amplitude;
frequencyValue.textContent = frequency;
phaseValue.textContent = phase.toFixed(2);
}
// 绘制坐标轴
function drawAxes() {
const width = canvas.width;
const height = canvas.height;
const centerY = height / 2;
ctx.strokeStyle = colors.axis;
ctx.lineWidth = 2;
// X轴
ctx.beginPath();
ctx.moveTo(0, centerY);
ctx.lineTo(width, centerY);
ctx.stroke();
// Y轴
ctx.beginPath();
ctx.moveTo(width / 2, 0);
ctx.lineTo(width / 2, height);
ctx.stroke();
// 网格线
ctx.strokeStyle = colors.grid;
ctx.lineWidth = 1;
// 水平网格线
for (let y = 0; y < height; y += height / 8) {
ctx.beginPath();
ctx.moveTo(0, y);
ctx.lineTo(width, y);
ctx.stroke();
}
// 垂直网格线
for (let x = 0; x < width; x += width / 16) {
ctx.beginPath();
ctx.moveTo(x, 0);
ctx.lineTo(x, height);
ctx.stroke();
}
// 刻度标记
ctx.fillStyle = colors.axis;
ctx.font = '12px Arial';
ctx.textAlign = 'center';
// X轴刻度
for (let x = 0; x <= width; x += width / 8) {
const value = ((x - width/2) / (width/2)) * Math.PI * 2;
ctx.fillText(value.toFixed(1), x, centerY + 15);
}
// Y轴刻度
ctx.textAlign = 'right';
for (let y = 0; y <= height; y += height / 8) {
const value = ((height/2 - y) / (height/2)).toFixed(1);
ctx.fillText(value, width/2 - 10, y + 4);
}
}
// 绘制单位圆
function drawUnitCircle(angle) {
const centerX = canvas.width / 4;
const centerY = canvas.height / 2;
const radius = 100;
// 绘制圆
ctx.strokeStyle = colors.circle;
ctx.lineWidth = 2;
ctx.beginPath();
ctx.arc(centerX, centerY, radius, 0, Math.PI * 2);
ctx.stroke();
// 绘制半径线
ctx.beginPath();
ctx.moveTo(centerX, centerY);
const endX = centerX + radius * Math.cos(angle);
const endY = centerY - radius * Math.sin(angle);
ctx.lineTo(endX, endY);
ctx.stroke();
// 绘制角度标记
ctx.fillStyle = colors.circle;
ctx.font = '14px Arial';
ctx.textAlign = 'center';
ctx.fillText('θ = ' + angle.toFixed(2), centerX, centerY - radius - 10);
// 绘制sin和cos的投影线
ctx.strokeStyle = '#95a5a6';
ctx.setLineDash([5, 3]);
// sin投影 (垂直)
ctx.beginPath();
ctx.moveTo(endX, endY);
ctx.lineTo(endX, centerY);
ctx.stroke();
// cos投影 (水平)
ctx.beginPath();
ctx.moveTo(endX, endY);
ctx.lineTo(centerX, endY);
ctx.stroke();
ctx.setLineDash([]);
return { x: endX, y: endY };
}
// 绘制三角函数波形
function drawWaveform() {
const width = canvas.width;
const height = canvas.height;
const centerY = height / 2;
const scaleY = height / 4;
const scaleX = width / (4 * Math.PI);
ctx.strokeStyle = currentFunction === 'sin' ? colors.sin :
currentFunction === 'cos' ? colors.cos : colors.tan;
ctx.lineWidth = 3;
ctx.beginPath();
// 计算波形点
for (let x = 0; x < width; x++) {
// 转换为数学坐标 (0到2π)
const mathX = ((x - width/2) / scaleX) + phase;
let y;
if (currentFunction === 'sin') {
y = centerY - amplitude * scaleY * Math.sin(frequency * mathX);
} else if (currentFunction === 'cos') {
y = centerY - amplitude * scaleY * Math.cos(frequency * mathX);
} else { // tan
// 限制tan函数的y值范围
const tanValue = amplitude * Math.tan(frequency * mathX);
y = centerY - scaleY * Math.max(-5, Math.min(5, tanValue));
}
if (x === 0) {
ctx.moveTo(x, y);
} else {
ctx.lineTo(x, y);
}
}
ctx.stroke();
// 绘制当前点的标记
const mathX = angle + phase;
let currentY;
if (currentFunction === 'sin') {
currentY = centerY - amplitude * scaleY * Math.sin(frequency * mathX);
} else if (currentFunction === 'cos') {
currentY = centerY - amplitude * scaleY * Math.cos(frequency * mathX);
} else { // tan
const tanValue = amplitude * Math.tan(frequency * mathX);
currentY = centerY - scaleY * Math.max(-5, Math.min(5, tanValue));
}
const currentX = width/2 + scaleX * (angle);
// 绘制当前点
ctx.fillStyle = ctx.strokeStyle;
ctx.beginPath();
ctx.arc(currentX, currentY, 6, 0, Math.PI * 2);
ctx.fill();
// 从单位圆到波形的连线
ctx.strokeStyle = '#95a5a6';
ctx.setLineDash([3, 3]);
ctx.beginPath();
ctx.moveTo(currentX, currentY);
ctx.lineTo(width/4 + 100, height/2 - 100 * Math.sin(angle));
ctx.stroke();
ctx.setLineDash([]);
}
// 动画循环
function animate() {
ctx.clearRect(0, 0, canvas.width, canvas.height);
drawAxes();
const point = drawUnitCircle(angle);
drawWaveform();
// 更新角度
angle += 0.02;
if (angle > Math.PI * 2) {
angle -= Math.PI * 2;
}
animationId = requestAnimationFrame(animate);
}
// 初始化
function init() {
// 设置按钮事件
sinBtn.addEventListener('click', function() {
currentFunction = 'sin';
sinBtn.classList.add('active');
cosBtn.classList.remove('active');
tanBtn.classList.remove('active');
});
cosBtn.addEventListener('click', function() {
currentFunction = 'cos';
sinBtn.classList.remove('active');
cosBtn.classList.add('active');
tanBtn.classList.remove('active');
});
tanBtn.addEventListener('click', function() {
currentFunction = 'tan';
sinBtn.classList.remove('active');
cosBtn.classList.remove('active');
tanBtn.classList.add('active');
});
// 设置滑块事件
amplitudeSlider.addEventListener('input', function() {
amplitude = parseFloat(this.value);
updateDisplayValues();
});
frequencySlider.addEventListener('input', function() {
frequency = parseFloat(this.value);
updateDisplayValues();
});
phaseSlider.addEventListener('input', function() {
phase = parseFloat(this.value);
updateDisplayValues();
});
// 初始显示值
updateDisplayValues();
// 开始动画
animate();
}
// 页面加载完成后初始化
window.addEventListener('load', init);
// 页面卸载时取消动画
window.addEventListener('unload', function() {
if (animationId) {
cancelAnimationFrame(animationId);
}
});
</script>
</body>
</html>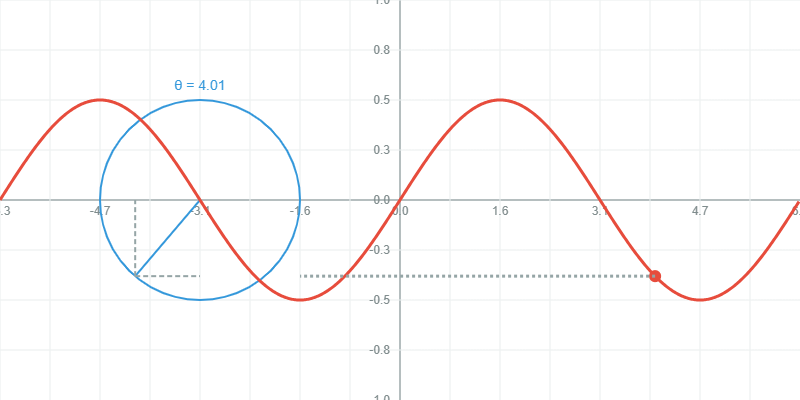
数学老师不懂代码不要紧,我们只需要借助于DeepSeek生成HTML代码放在我上面提到的网站中即可,然后利用工具保存成gif即可。以下是具体的步骤:
3 步让DeepSeek-V3成为你的动画助教
Step 1:关闭深度思考(R1)、开启联网功能
关闭深度思考(R1)模型后,DeepSeek会默认开启V3模式,为什么要开启联网功能呢?其他我试过不开启联网搜索也能生成动画效果,但开启联网功能是为了让DeepSeek去参考更多的动态效果,以便生成的动画更加形象。
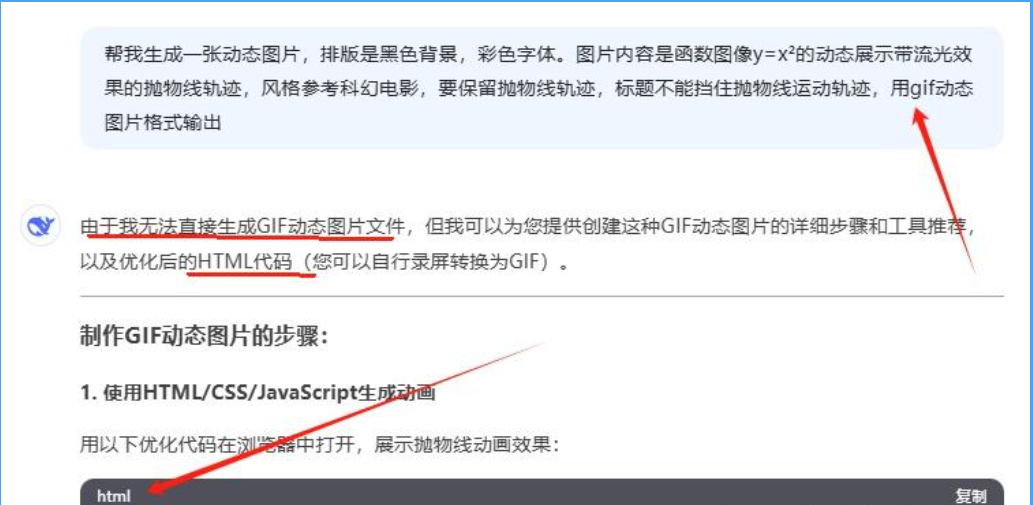
Step 2:精确描述需求
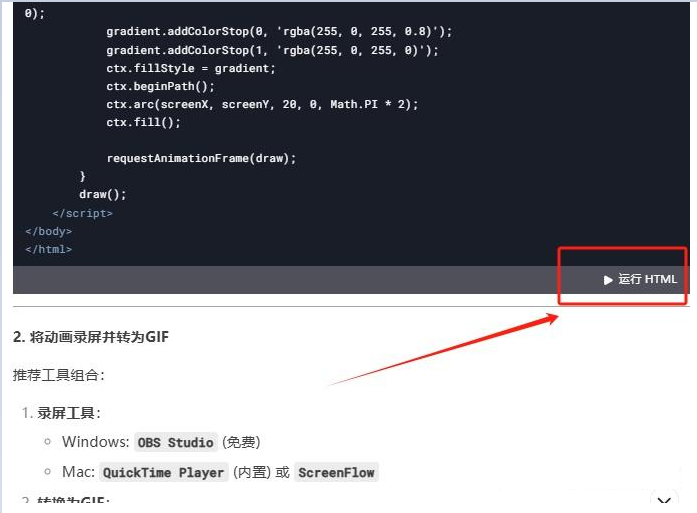
这里的提示词最重要的是描述清楚需求,无论你要生成哪个知识点的图片信息,都要加上动态图片、动画效果等字眼,一般动态图片是gif文件格式,但是DeepSeek会告诉你它无法直接生成GIF动态图片文件,它会给你html文件格式,所以我们一般告诉它以html的格式输出,你也无需想以前把代码复制出来手动修改再运行,DeepSeek直接帮我们内嵌的html文件解析,你只需要直接点击即可运行查看效果。
Step 3:局部调整,精确输出
如果你的提示词并不是描述得太清楚,或者DeepSeek并没有按照我们预想的效果输出,我们可以对它进行多轮多话来进行调整,比如它会生成一个标题,挡住了数学知识点的呈现、我们可以让它不要生成标题,比如我们可以要求他的背景颜色、字体颜色、图形颜色等等,或者它并没有完全理解某个知识点的意义,我们也可以先告诉它推理过程,让它反复纠正来达到我们的预期。