python:六种算法(DBO、RFO、WOA、GWO、PSO、GA)求解23个测试函数(python代码)
一、六种算法简介
1、蜣螂优化算法DBO
2、红狐优化算法RFO
3、鲸鱼优化算法WOA
4、灰狼优化算法GWO
5、粒子群优化算法PSO
6、遗传算法GA
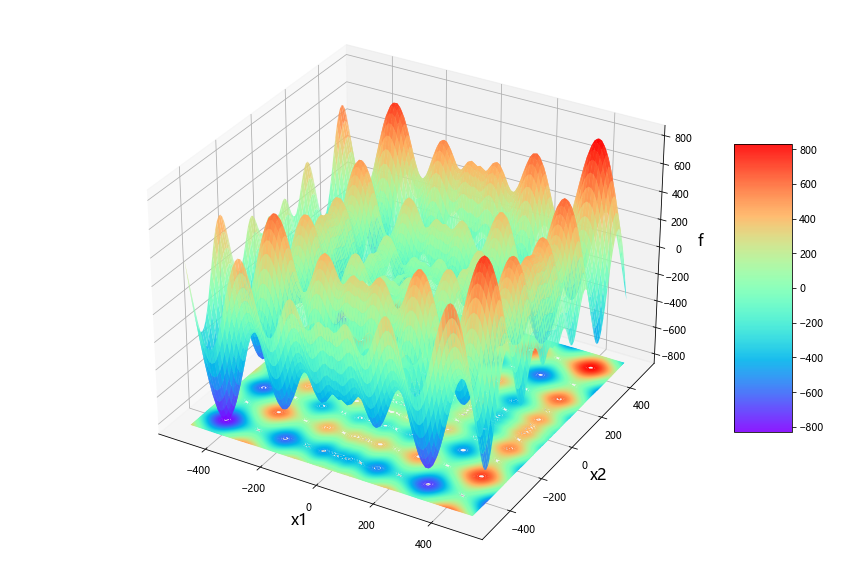
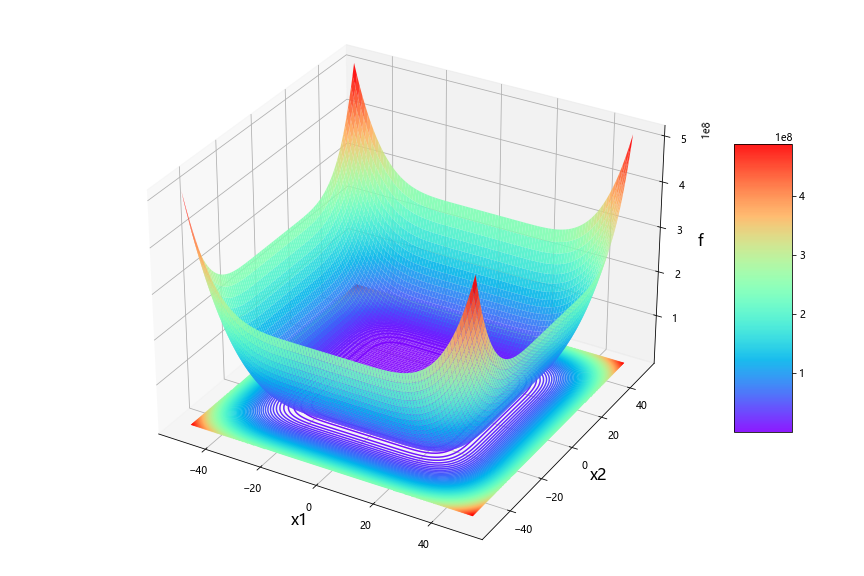
二、6种算法求解23个函数
(1)23个函数简介

参考文献:
[1] Yao X, Liu Y, Lin G M. Evolutionary programming made faster[J]. IEEE transactions on evolutionary computation, 1999, 3(2):82-102.
(2)部分python代码
from FunInfo import Get_Functions_details
from WOA import WOA
from GWO import GWO
from PSO import PSO
from GA import GA
from DBO import DBO
from RFO import RFO
import matplotlib.pyplot as plt
from func_plot import func_plot
plt.rcParams['font.sans-serif']=['Microsoft YaHei']
#主程序
function_name =12 #测试函数1-23
SearchAgents_no = 50#种群大小
Max_iter = 100#迭代次数
lb,ub,dim,fobj=Get_Functions_details(function_name)#获取问题信息
BestX1,BestF1,curve1 = WOA(SearchAgents_no, Max_iter,lb,ub,dim,fobj)#问题求解
BestX2,BestF2,curve2 = GWO(SearchAgents_no, Max_iter,lb,ub,dim,fobj)#问题求解
BestX3,BestF3,curve3 = PSO(SearchAgents_no, Max_iter,lb,ub,dim,fobj)#问题求解
BestX4,BestF4,curve4 = GA(SearchAgents_no, Max_iter,lb,ub,dim,fobj)#问题求解
BestX5,BestF5,curve5 = DBO(SearchAgents_no, Max_iter,lb,ub,dim,fobj)#问题求解
BestX6,BestF6,curve6 = RFO(SearchAgents_no, Max_iter,lb,ub,dim,fobj)#问题求解
#画函数图
func_plot(lb,ub,dim,fobj,function_name)#画函数图
#画收敛曲线图
Labelstr=['WOA','GWO','PSO','GA','DBO','RFO']
Colorstr=['r','g','b','k','c','m']
if BestF1>0:
plt.semilogy(curve1,color=Colorstr[0],linewidth=2,label=Labelstr[0])
plt.semilogy(curve2,color=Colorstr[1],linewidth=2,label=Labelstr[1])
plt.semilogy(curve3,color=Colorstr[2],linewidth=2,label=Labelstr[2])
plt.semilogy(curve4,color=Colorstr[3],linewidth=2,label=Labelstr[3])
plt.semilogy(curve5,color=Colorstr[4],linewidth=2,label=Labelstr[4])
plt.semilogy(curve6,color=Colorstr[5],linewidth=2,label=Labelstr[5])
else:
plt.plot(curve1,color=Colorstr[0],linewidth=2,label=Labelstr[0])
plt.plot(curve2,color=Colorstr[1],linewidth=2,label=Labelstr[1])
plt.plot(curve3,color=Colorstr[2],linewidth=2,label=Labelstr[2])
plt.plot(curve4,color=Colorstr[3],linewidth=2,label=Labelstr[3])
plt.plot(curve5,color=Colorstr[4],linewidth=2,label=Labelstr[4])
plt.plot(curve5,color=Colorstr[5],linewidth=2,label=Labelstr[5])
plt.xlabel("Iteration")
plt.ylabel("Fitness")
plt.xlim(0,Max_iter)
plt.title("F"+str(function_name))
plt.legend()
plt.savefig(str(function_name)+'.png')
plt.show()
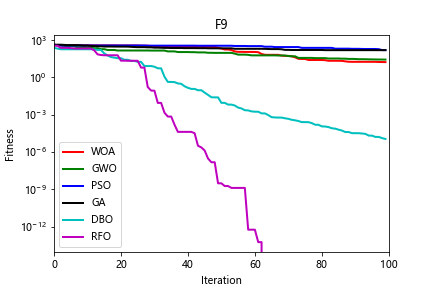
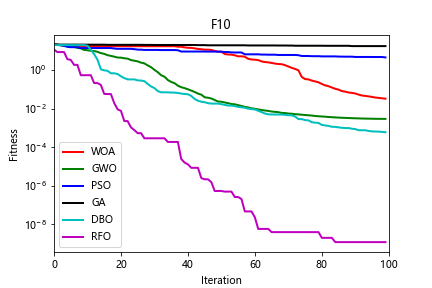
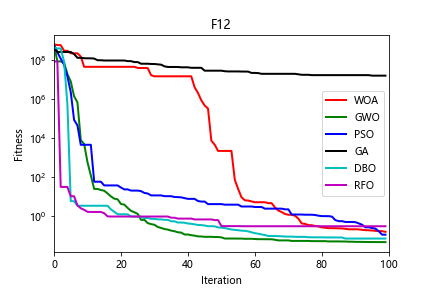
#(3)部分结果


三、完整python代码