Prometheus与Springboot
背景
最近公司签了个新项目,客户要求我们除了交付产品,还需将产品与他们已有的Prometheus监控系统对接,以实现服务的统一监控和预警。公司之前没有Prometheus相关的技术积累,不清楚这个集成有多大难度,占多少工作量,就让我评估一下。空口白牙的,我哪敢随便评估?所以我决定先在本地把Prometheus跑起来,再看看它是怎么与Springboot进行集成的,下文就是我的实践成果。
Prometheus介绍
Prometheus是一个开源的系统监控和报警工具,最初由SoundCloud构建。自2012年成立以来,许多公司和组织都采用了Prometheus,该项目拥有非常活跃的开发者和用户社区。它现在是一个开源项目,独立于任何公司进行维护。为强调这一点,并明确项目的治理结构,Prometheus于2016年加入了云原生计算基金会,成为继Kubernetes之后的第二个托管项目。
Prometheus具有以下特点:
1)具有由指标名称和键/值对标识的时间序列数据的多维数据模型;
2)灵活的查询语言(PromQL):可以对采集的metrics指标进行加法,乘法,连接等操作;
3)可以直接在本地部署,不依赖其他分布式存储;
4)通过基于HTTP的pull方式采集时序数据;
5)可以通过中间网关pushgateway的方式把时间序列数据推送到prometheus server端;
6)可通过服务发现或者静态配置来发现目标服务对象(targets)。
7)有多种可视化图像界面,如Grafana等。
8)高效的存储,每个采样数据占3.5 bytes左右,300万的时间序列,30s间隔,保留60天,消耗磁盘大概200G。
9)高可用,可以对数据做异地备份,联邦集群,部署多套prometheus,pushgateway上报数据。
这里特别说明一下Prometheus的存储的数据结构,它将指标信息与记录时的时间戳,以及可选的键值对(标签)一起存储,例如,指标名称为 api_http_requests_total,标签为 method ="POST" 和 handler="/messages" 的时间序列可以表示为: api_http_requests_total{method="POST", handler="/messages"}
Prometheus 生态系统由多个组件组成,其中许多是可选的:
1)Prometheus Server: 用于收集和存储时间序列数据。
2)Client Library: 客户端库,检测应用程序代码,当Prometheus抓取实例的HTTP端点时,客户端库会将所有跟踪的metrics指标的当前状态发送到prometheus server端。
3)Exporters: prometheus支持多种exporter,通过exporter可以采集metrics数据,然后发送到prometheus server端,所有向promtheus server提供监控数据的程序都可以被称为exporter
4)Alertmanager: 从 Prometheus server 端接收到 alerts 后,会进行去重,分组,并路由到相应的接收方,发出报警,常见的接收方式有:电子邮件,微信,钉钉, slack等。
5)Grafana:监控仪表盘,可视化监控数据
6)pushgateway: 各个目标主机可上报数据到pushgateway,然后prometheus server统一从pushgateway拉取数据。
大多数 Prometheus 组件都是用Go编写的,因此很容易构建和部署为静态二进制文件。
其架构图如下:
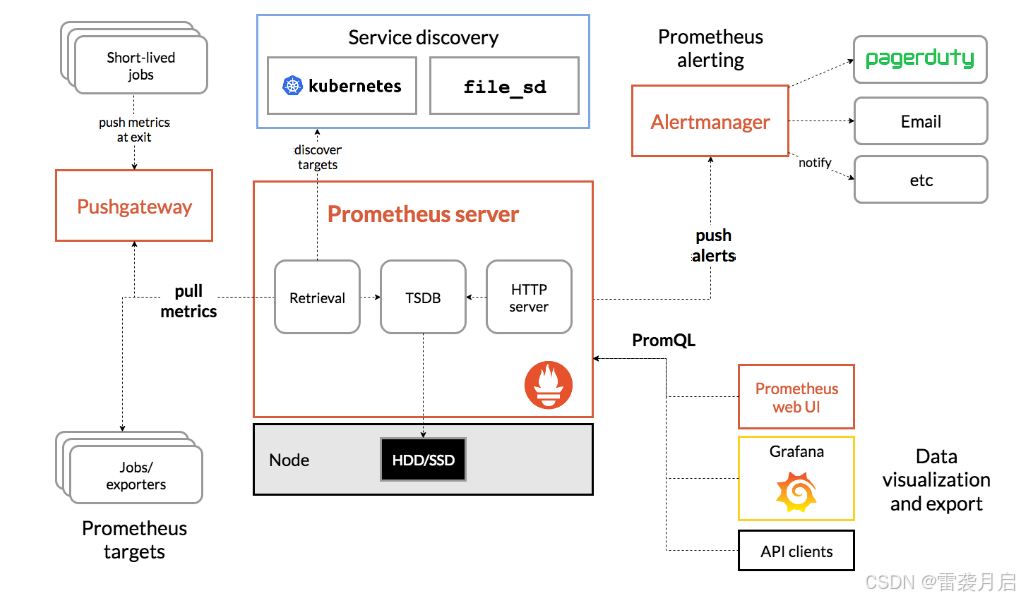
Prometheus非常适合记录任何纯数字时间序列。它既适合以机器为中心的监控,也适合高度动态的面向服务架构的监控。在微服务的世界里,它对多维数据收集和查询的支持是一个特别的优势。其设计目标是可靠性,在发生故障时,可以使用该系统快速诊断问题。每个Prometheus服务器都是独立的,不依赖于网络存储或其他远程服务。当基础设施的其他部分出现故障时,可以无需设置广泛的基础设施就能使用它。
但如果需要100%的准确性(例如按请求计费),那么Prometheus就不是一个好的选择,因为收集的数据可能不够详细和完整。在这种情况下,最好使用其他系统来收集和分析计费数据,并使用Prometheus 进行其余监控。
Window环境部署Prometheus
读了上面的介绍,相信大家对Prometheus有一定的了解,下面咱们在Windows环境里部署Prometheus,通过实践来加深印象。
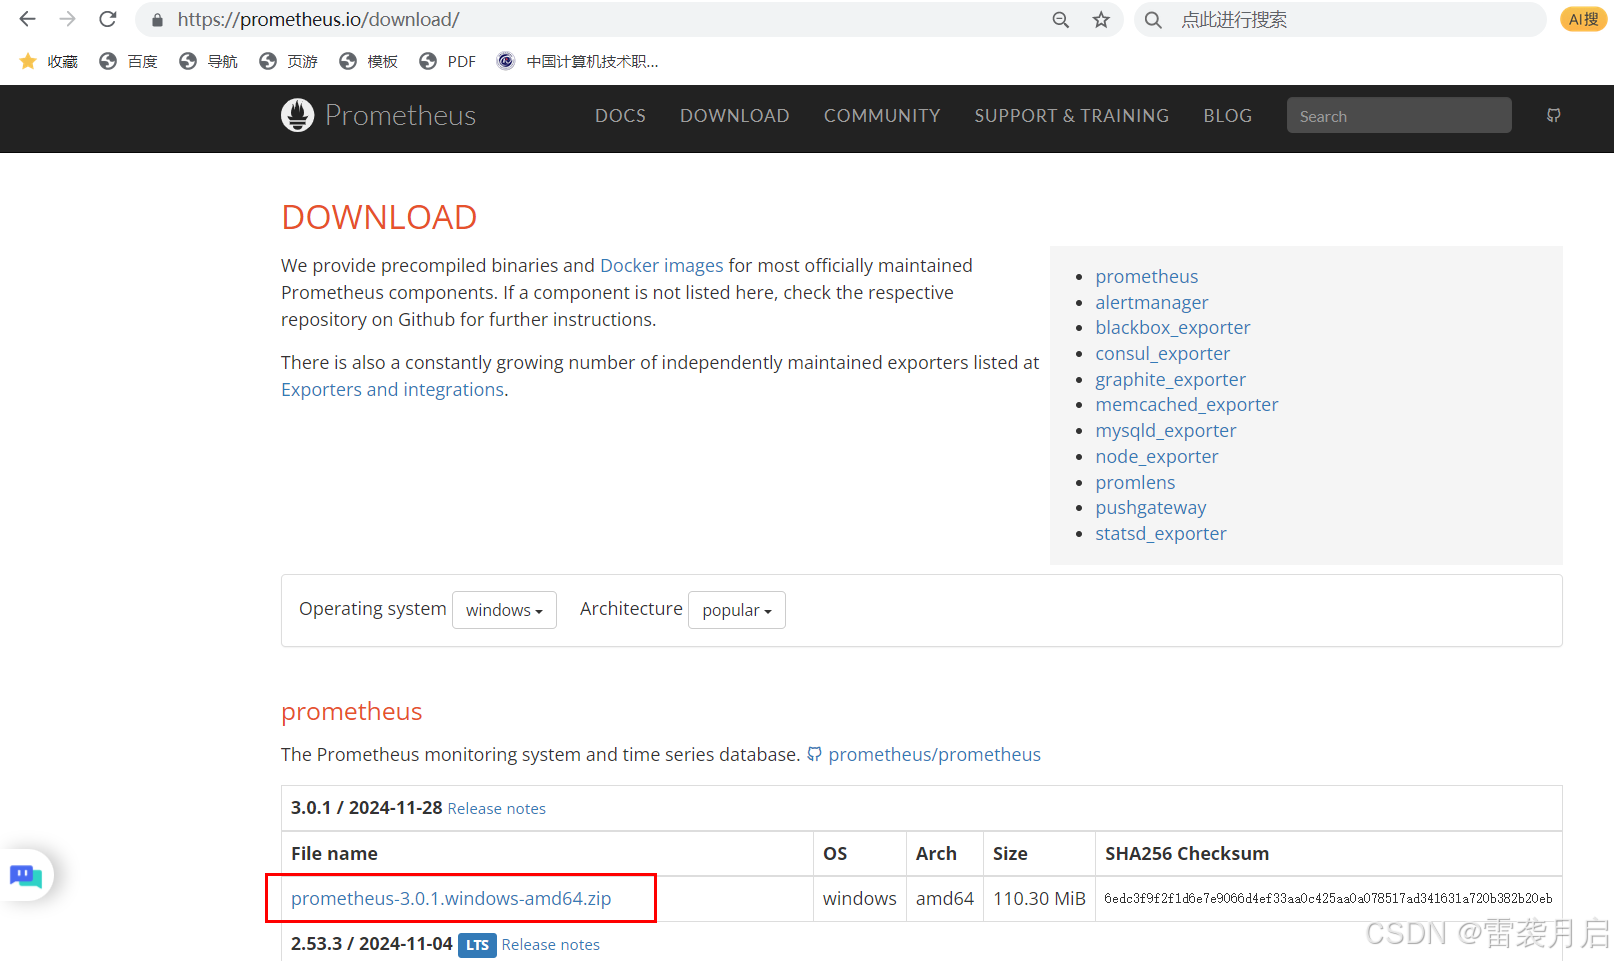
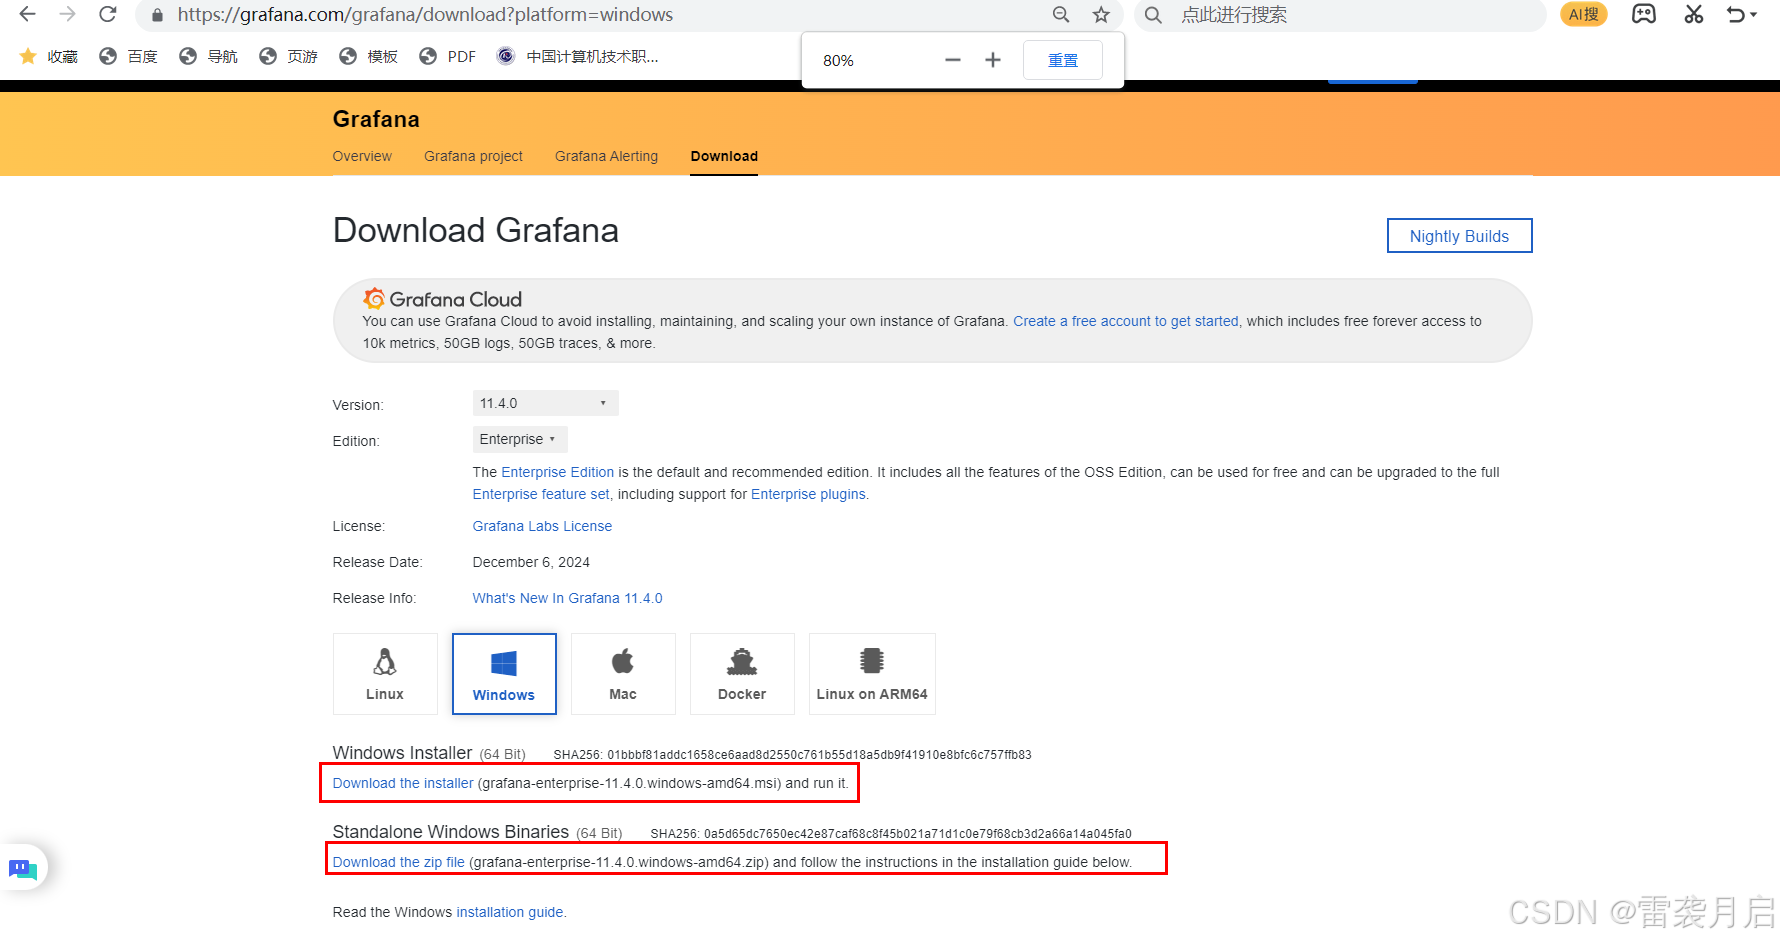
1、下载Prometheus, grafana(点击名称直接链接到下载地址),prometheus自带的图形功能比较弱,因此通常需要搭配grafana来增强其可视化功能。
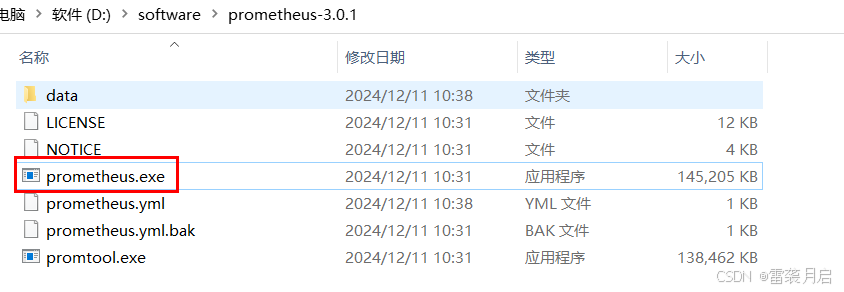
2、本地解压下载包,进入Promethues文件夹,点击启动。
进入grafana的conf文件夹,复制sample.ini,改名为custom.ini,并且做以下修改(修改服务器端口,默认是3000,也可以不改):
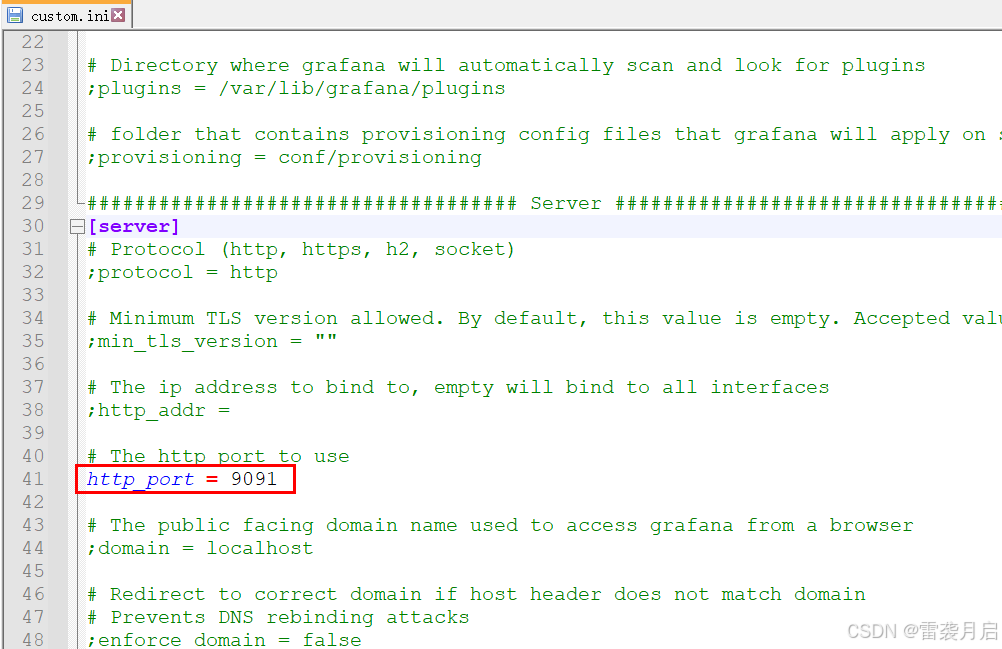
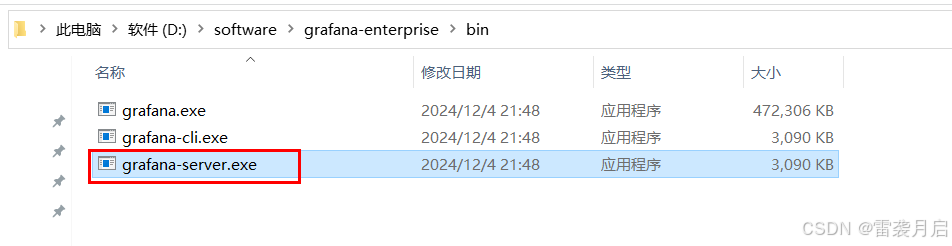
修改完之后,点击grafana文件夹/bin/grafana-server.exe启动。
这里解释一下,grafana后端的配置文件可以是多个以.ini结尾的配置文件,主要从三个配置文件读取配置:默认是/conf/defaults.ini,其次是用户配置/conf/custom.ini,可以在命令行启动grafana时通过--config参数重新指定配置文件来覆盖。如果是以deb或者rpm安装的,则默认的配置文件是/etc/grafana/grafana.ini,这个文件是在init.d的启动脚本中通过--config参数指定的。如果不加 –config参数,Grafana默认会去读conf/custom.ini配置文件。
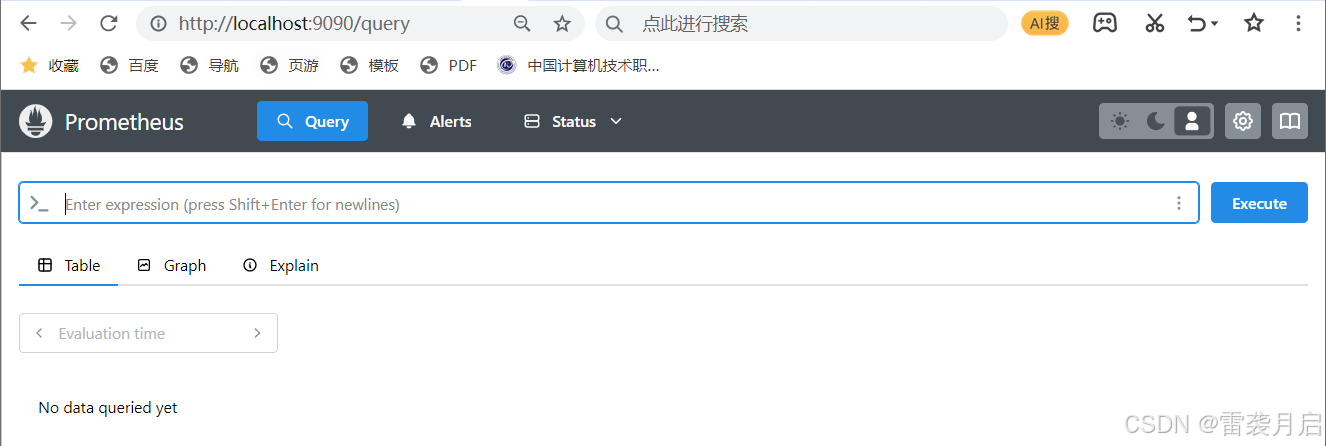
3、通过http://localhost:9090 检验prometheus的启动情况,如下:
通过http://localhost:9091 来检验grafana的启动情况,如下:
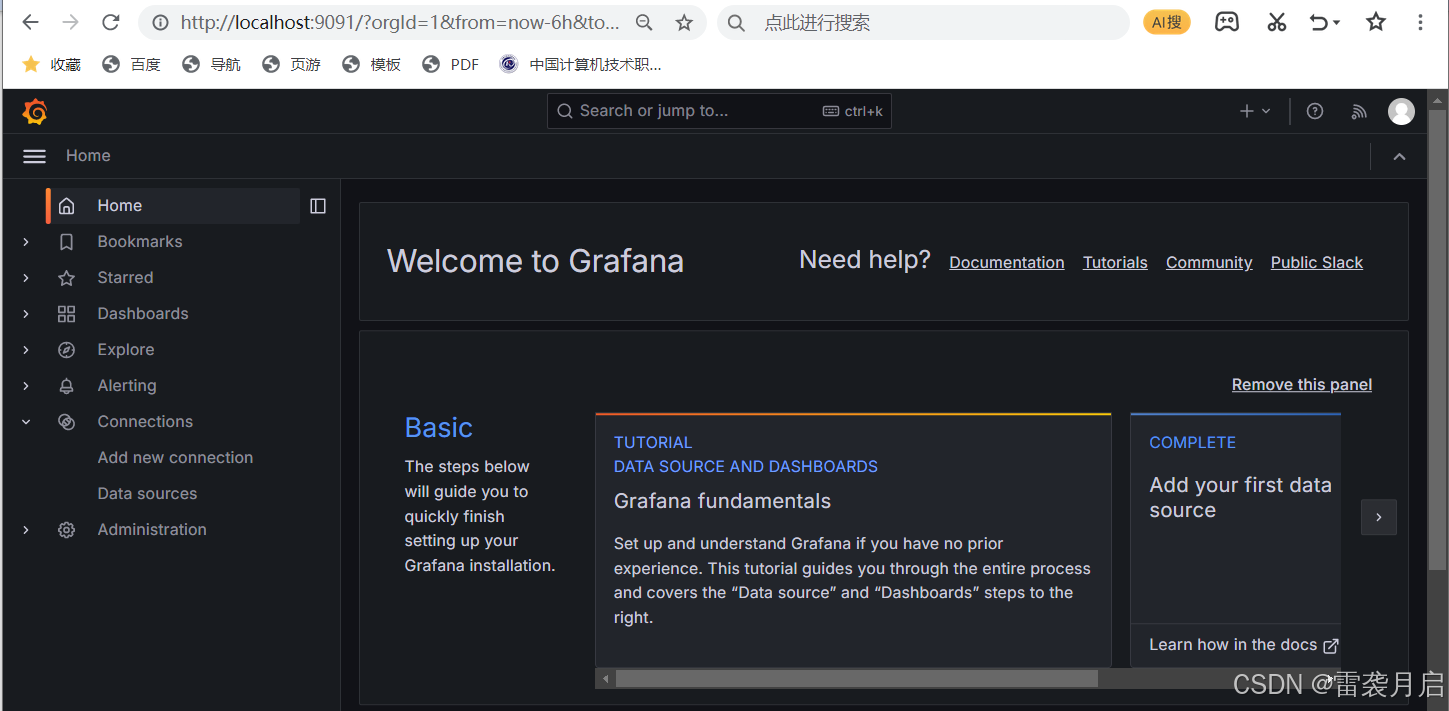
至此,prometheus和grafana就安装和启动成功了,是不是炒鸡简单?
SpringBoot集成Prometheus
接下来咱们创建一个简单的Springboot项目,并通过Prometheus对它进行监控。
1、创建一个SpringBoot项目,仅保留基本的测试方法。
pom.xml
<?xml version="1.0" encoding="UTF-8"?>
<project xmlns="http://maven.apache.org/POM/4.0.0" xmlns:xsi="http://www.w3.org/2001/XMLSchema-instance"
         xsi:schemaLocation="http://maven.apache.org/POM/4.0.0 https://maven.apache.org/xsd/maven-4.0.0.xsd">
    <modelVersion>4.0.0</modelVersion>
    <packaging>jar</packaging>
    <parent>
        <groupId>org.springframework.boot</groupId>
        <artifactId>spring-boot-starter-parent</artifactId>
        <version>2.3.2.RELEASE</version>
        <relativePath/> <!-- lookup parent from repository -->
    </parent>
    <groupId>com.leixi.hub</groupId>
    <artifactId>leixi-prometheus-client</artifactId>
    <version>1.0</version>
    <name>leixi-prometheus-client</name>
    <properties>
        <java.version>1.8</java.version>
    </properties>
    <dependencies>
        <dependency>
            <groupId>org.springframework.boot</groupId>
            <artifactId>spring-boot-starter-web</artifactId>
        </dependency>
        <dependency>
            <groupId>org.springframework.boot</groupId>
            <artifactId>spring-boot-starter-actuator</artifactId>
        </dependency>
        <dependency>
            <groupId>io.micrometer</groupId>
            <artifactId>micrometer-registry-prometheus</artifactId>
            <version>1.9.0</version>
        </dependency>

    </dependencies>

    <build>
        <plugins>
            <plugin>
                <groupId>org.springframework.boot</groupId>
                <artifactId>spring-boot-maven-plugin</artifactId>
            </plugin>
        </plugins>
    </build>
</project>
application.yml
server:
  port: 19200
  servlet:
    context-path: /leixi

spring:
  application:
    name: leixi-prometheus
management:     #配置开启 Actuator 服务  Spring Boot Actuator 会自动配置一个 URL 为 /actuator/Prometheus 的 HTTP 服务来供 Prometheus 抓取数据,不过默认该服务是关闭的
  endpoints:
    web:
      exposure:
        include: "*"
  metrics:      #将该工程应用名称添加到计量器注册表的 tag 中去,方便后边 Prometheus 根据应用名称来区分不同的服务
    tags:
      application: ${spring.application.name}
Application.java修改:
package com.leixi.basic;

import io.micrometer.core.instrument.MeterRegistry;
import org.springframework.beans.factory.annotation.Value;
import org.springframework.boot.SpringApplication;
import org.springframework.boot.actuate.autoconfigure.metrics.MeterRegistryCustomizer;
import org.springframework.boot.autoconfigure.SpringBootApplication;
import org.springframework.context.annotation.Bean;

/**
 *
 * @author 雷袭月启
 * @since 2023/12/10 22:00
 */
@SpringBootApplication
public class Application {

    public static void main(String[] args) {
        SpringApplication.run(Application.class, args);
    }

    @Bean
    MeterRegistryCustomizer<MeterRegistry> configurer(
            @Value("${spring.application.name}") String applicationName) {
        return (registry) -> registry.config().commonTags("application", applicationName);
    }

}
添加几个Controller方法备用,待会用于测试:
package com.leixi.basic.controller;
import org.slf4j.Logger;
import org.slf4j.LoggerFactory;
import org.springframework.web.bind.annotation.GetMapping;
import org.springframework.web.bind.annotation.RestController;

import java.util.ArrayList;
import java.util.HashMap;
import java.util.List;
import java.util.Map;

/**
 *
 * @author 雷袭月启
 * @since 2024/12/5 19:39
 */
@RestController
public class DemoController {
    private final static Logger logger = LoggerFactory.getLogger(DemoController.class);


    @GetMapping("/demo")
    public Object demo(String str) {
        logger.info("进入测试方法,参数是 :{} ", str);
        return "测试方法参数 " + str;
    }

    @GetMapping("/demoDataBuild")
    public Object demoDataBuild(Integer number) {
        List<Map> list = new ArrayList<>();
        for (int i=0; i<= number; i++) {
            Map map = new HashMap();
            for(int j=0; j<=i; j++) {
                map.put(i + "" + j, "第"+i +"行载入信息: "+j);
            }
            list.add(map);
        }
        return list;
    }
}
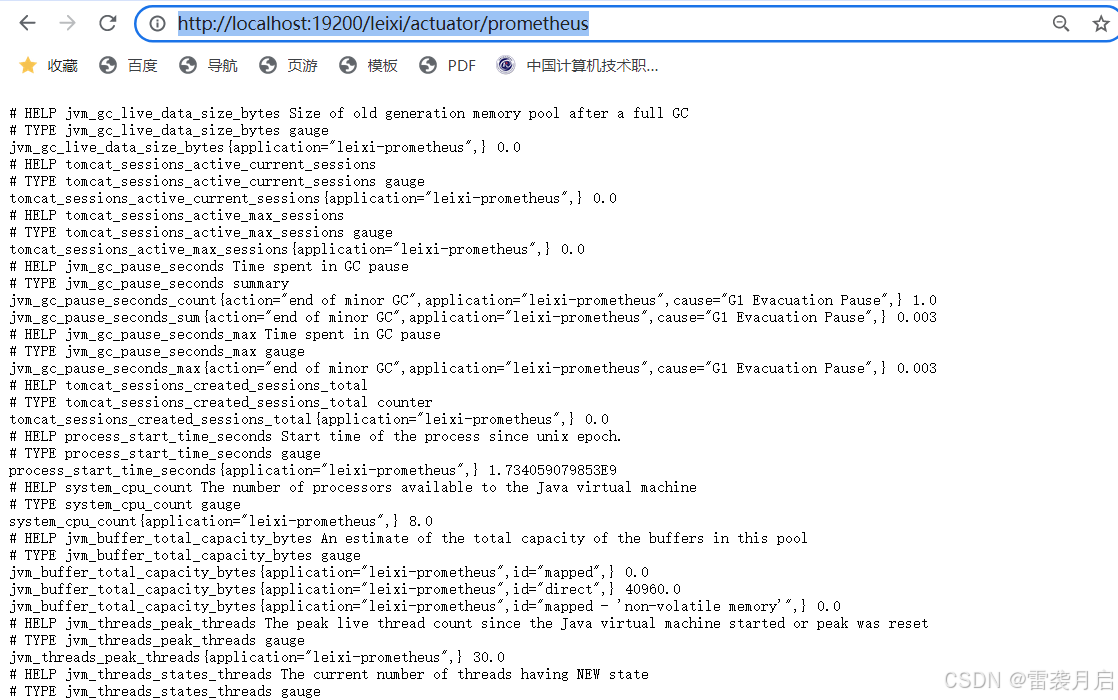
4、启动服务,访问:http://localhost:19200/leixi/actuator/prometheus即可看到该服务的一些度量指标。
5、接下来,在\prometheus-3.0.1\prometheus.yml中添加该springboot服务的监控配置
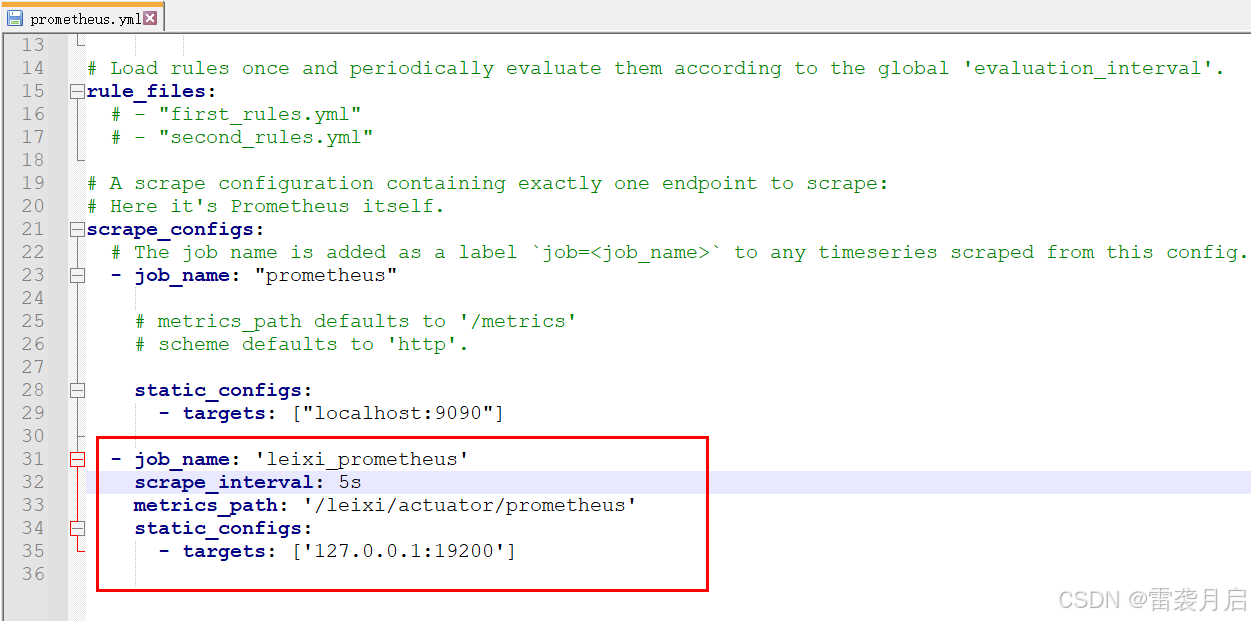
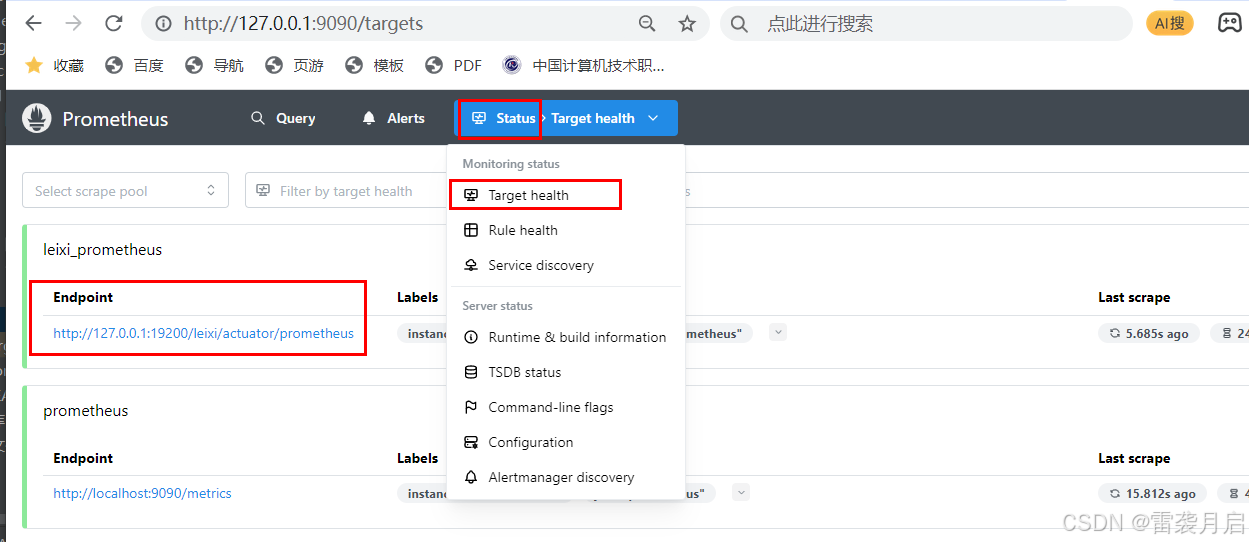
重启promethues,再次通过http://localhost:9090进入控制台,通过Status->Target Health可以看到刚刚添加的服务:
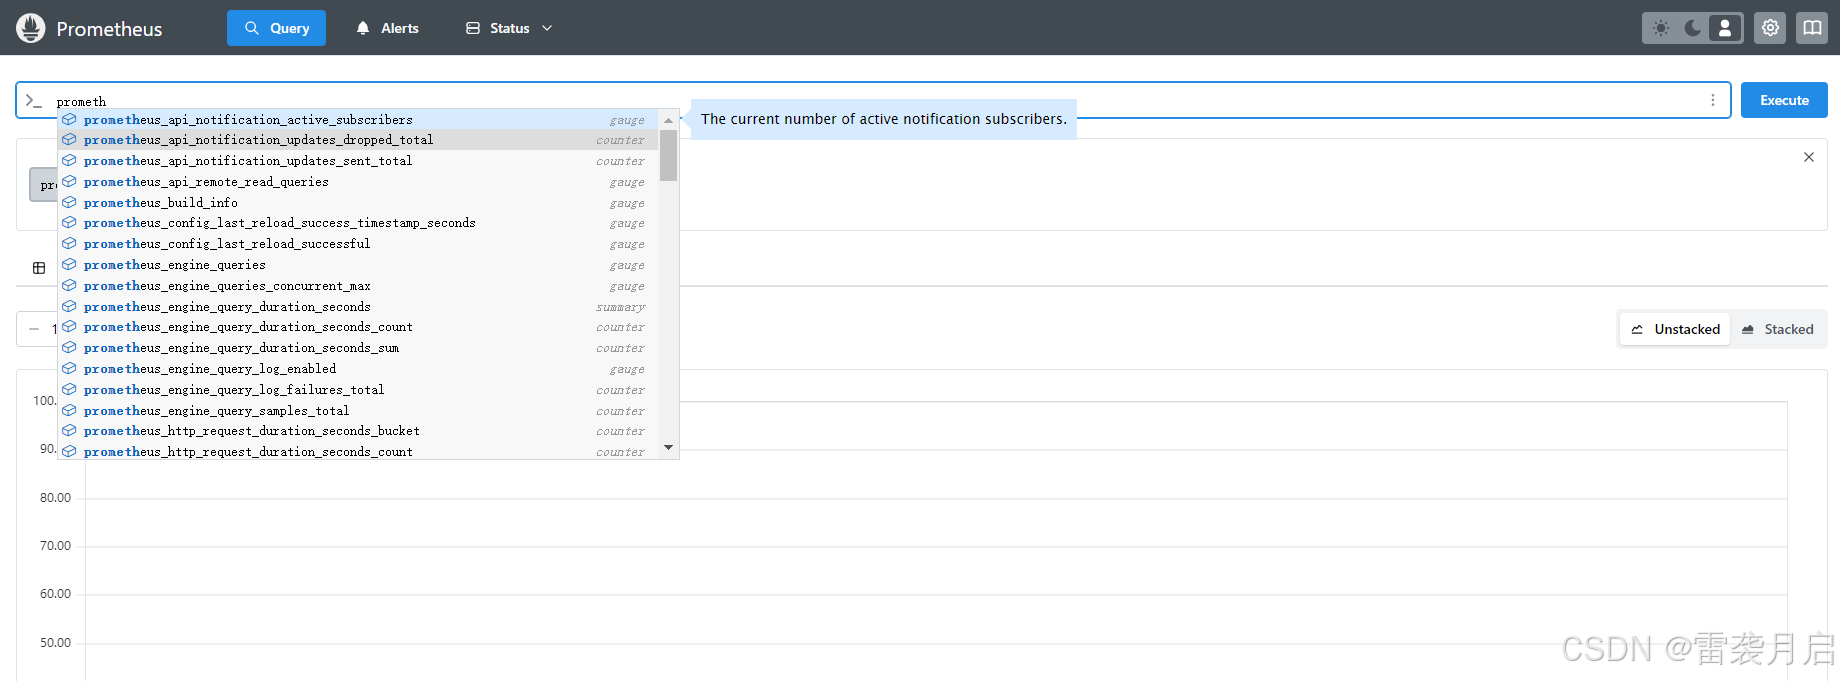
也可以在Query页签中根据相关指标来查询:
6、接下来是让Prometheus和Grafana关联起来,通过在Grafana里的Data Source来创建Prometheus数据源。
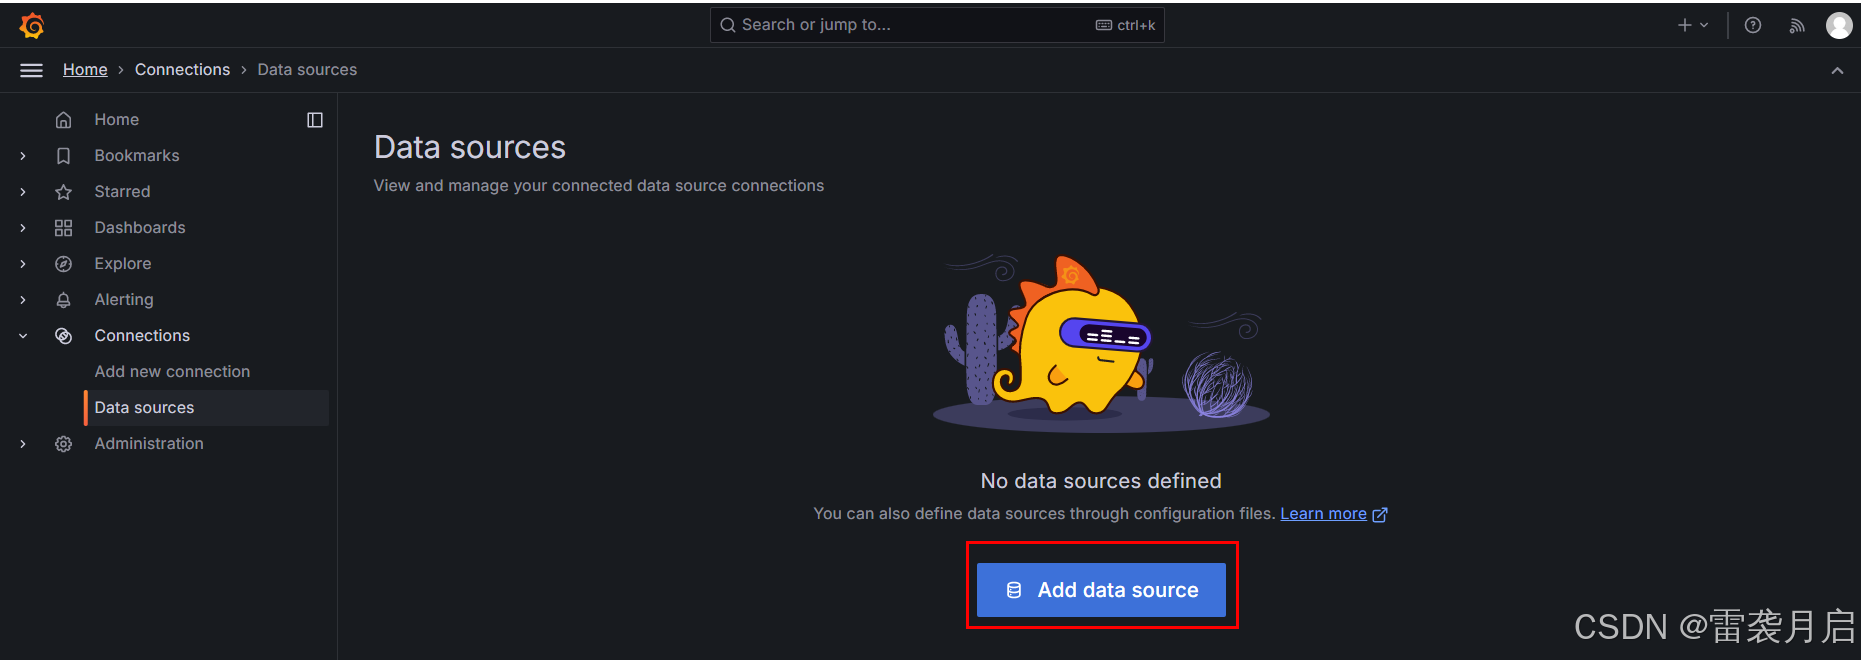
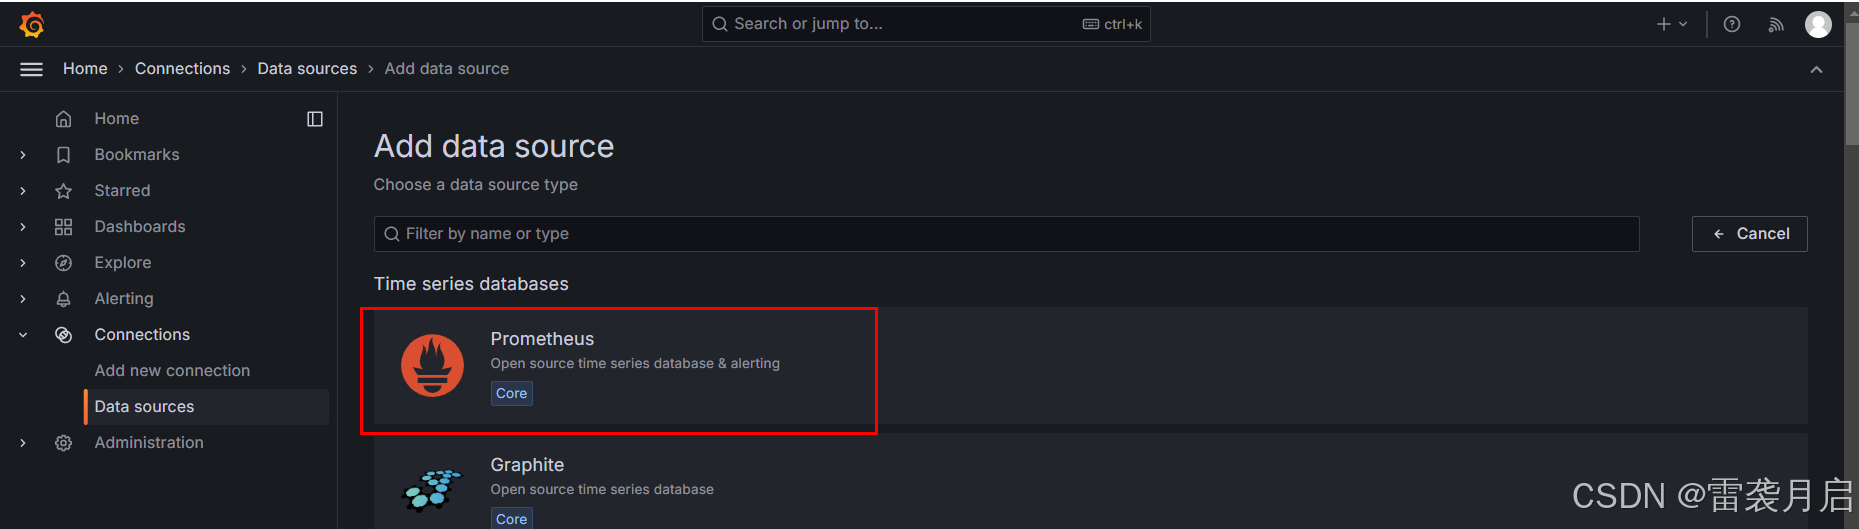
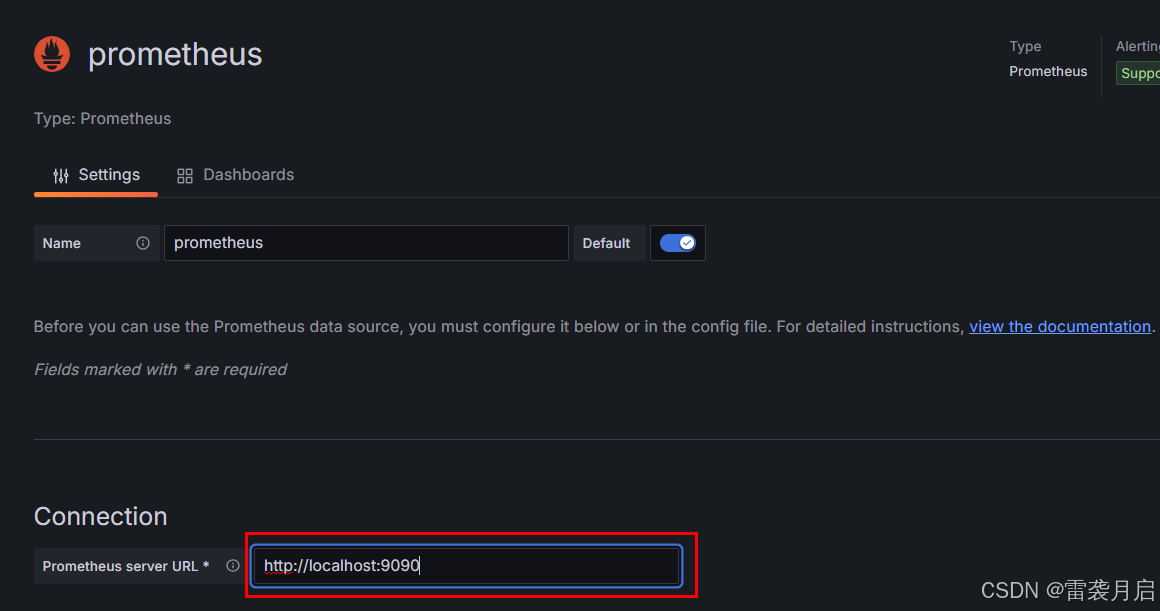
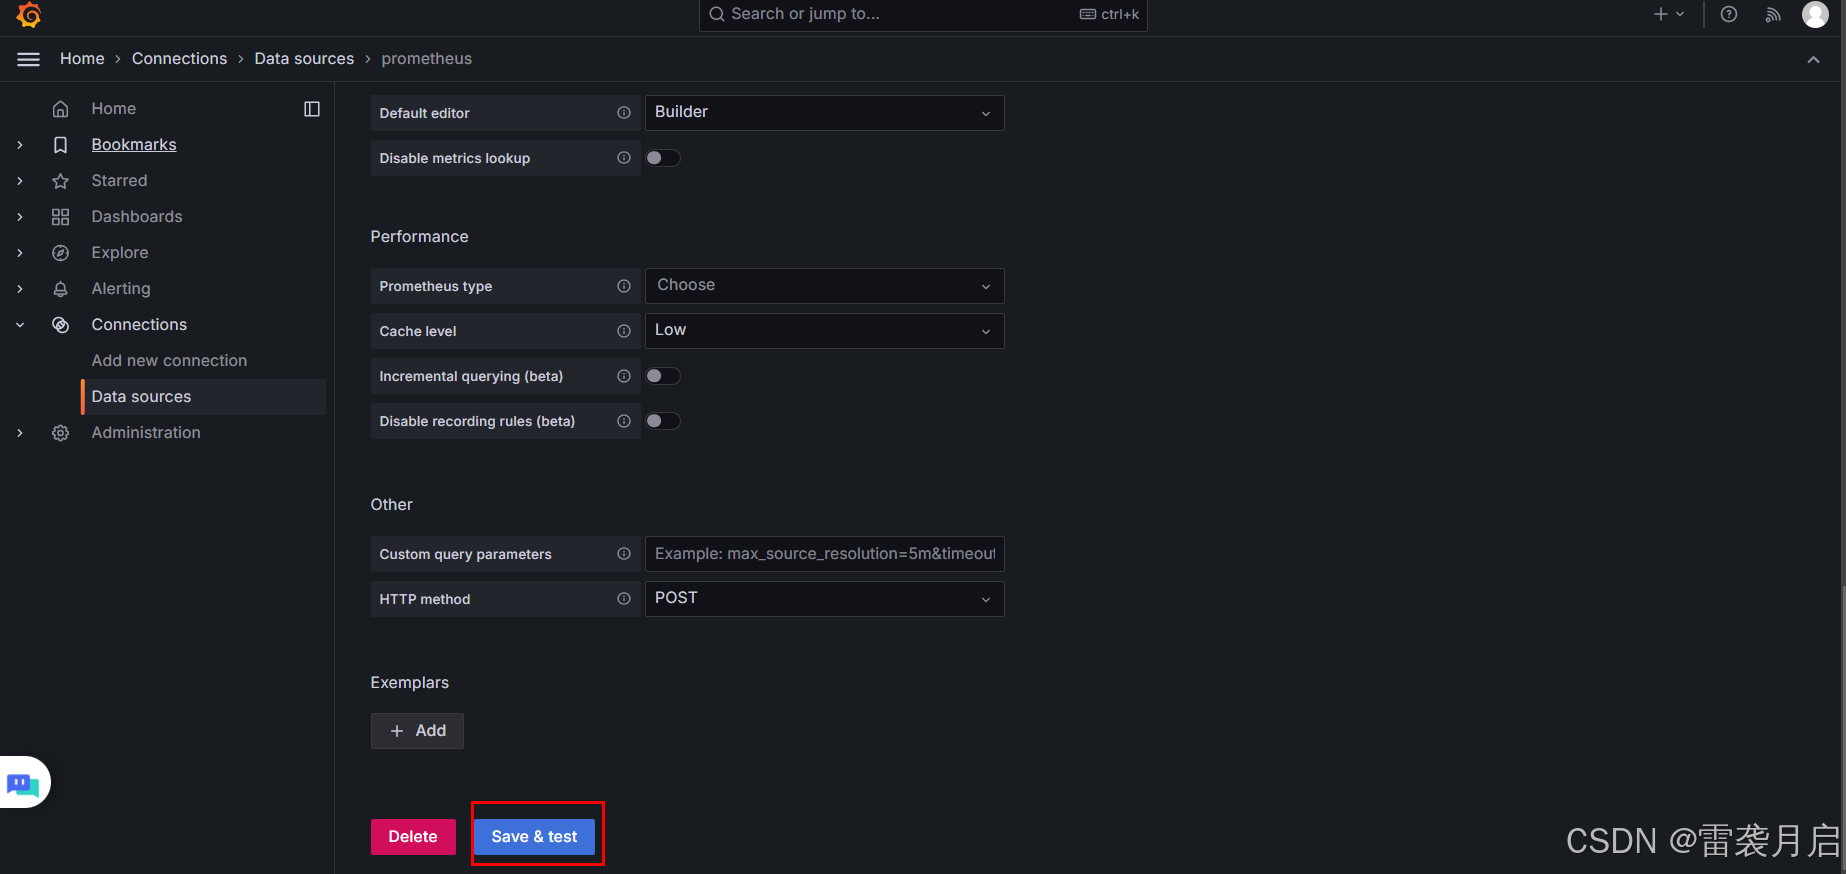
只需要配上prometheus的地址即可
7、配置微服务的监控仪表盘,如下:
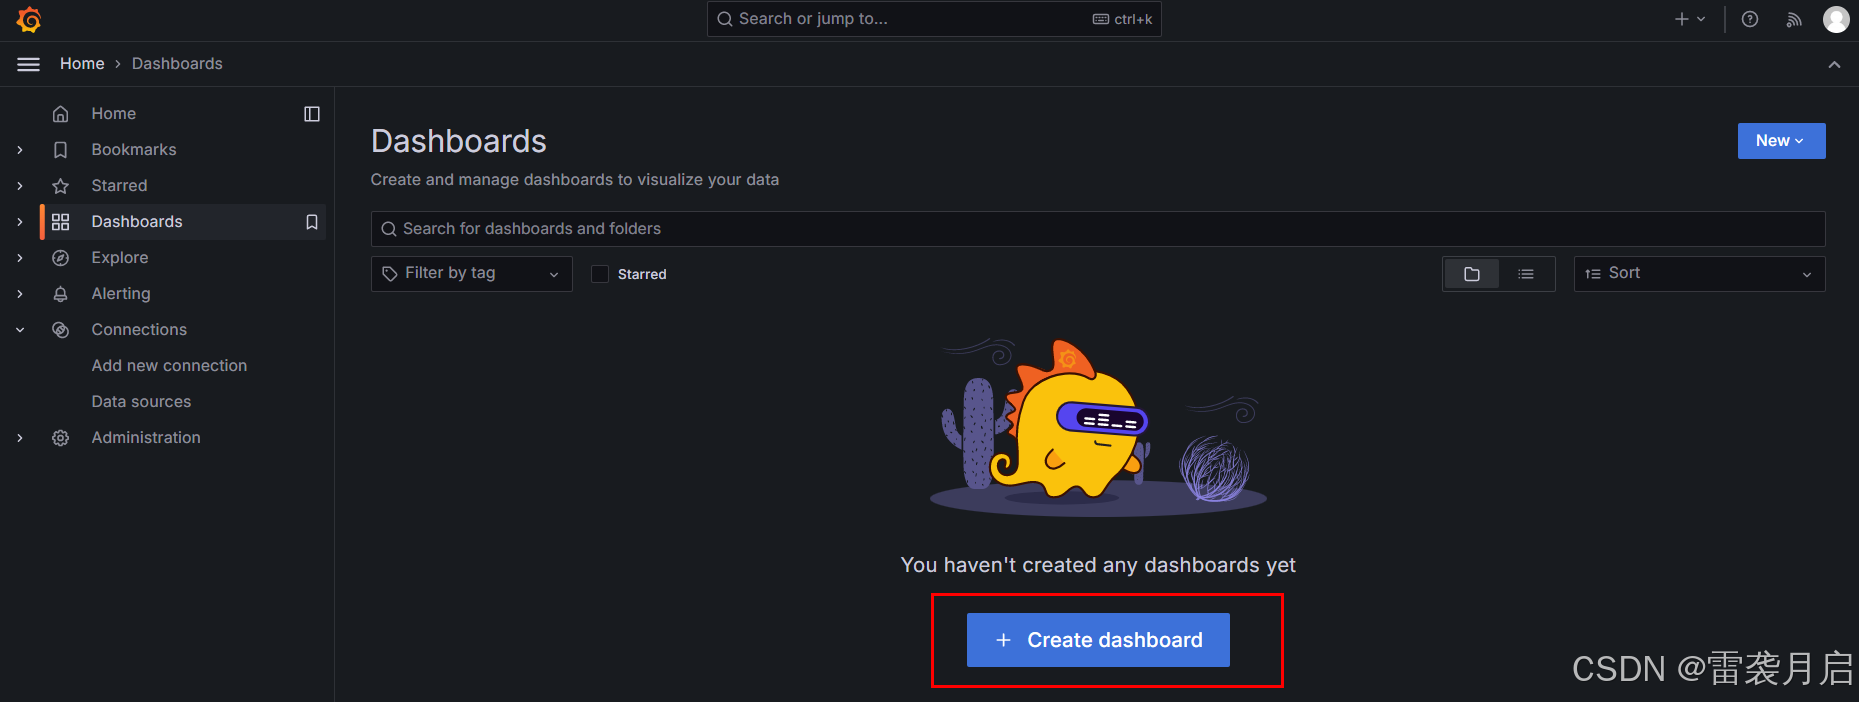
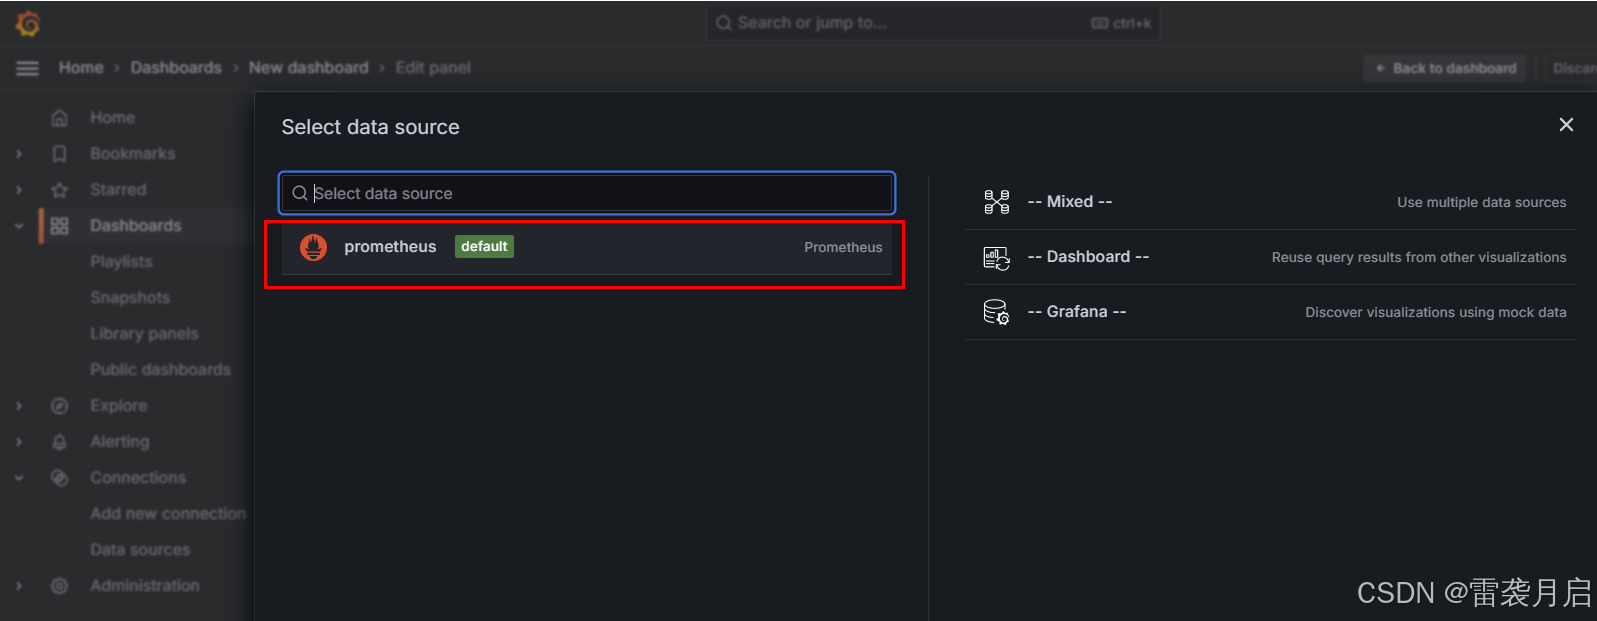
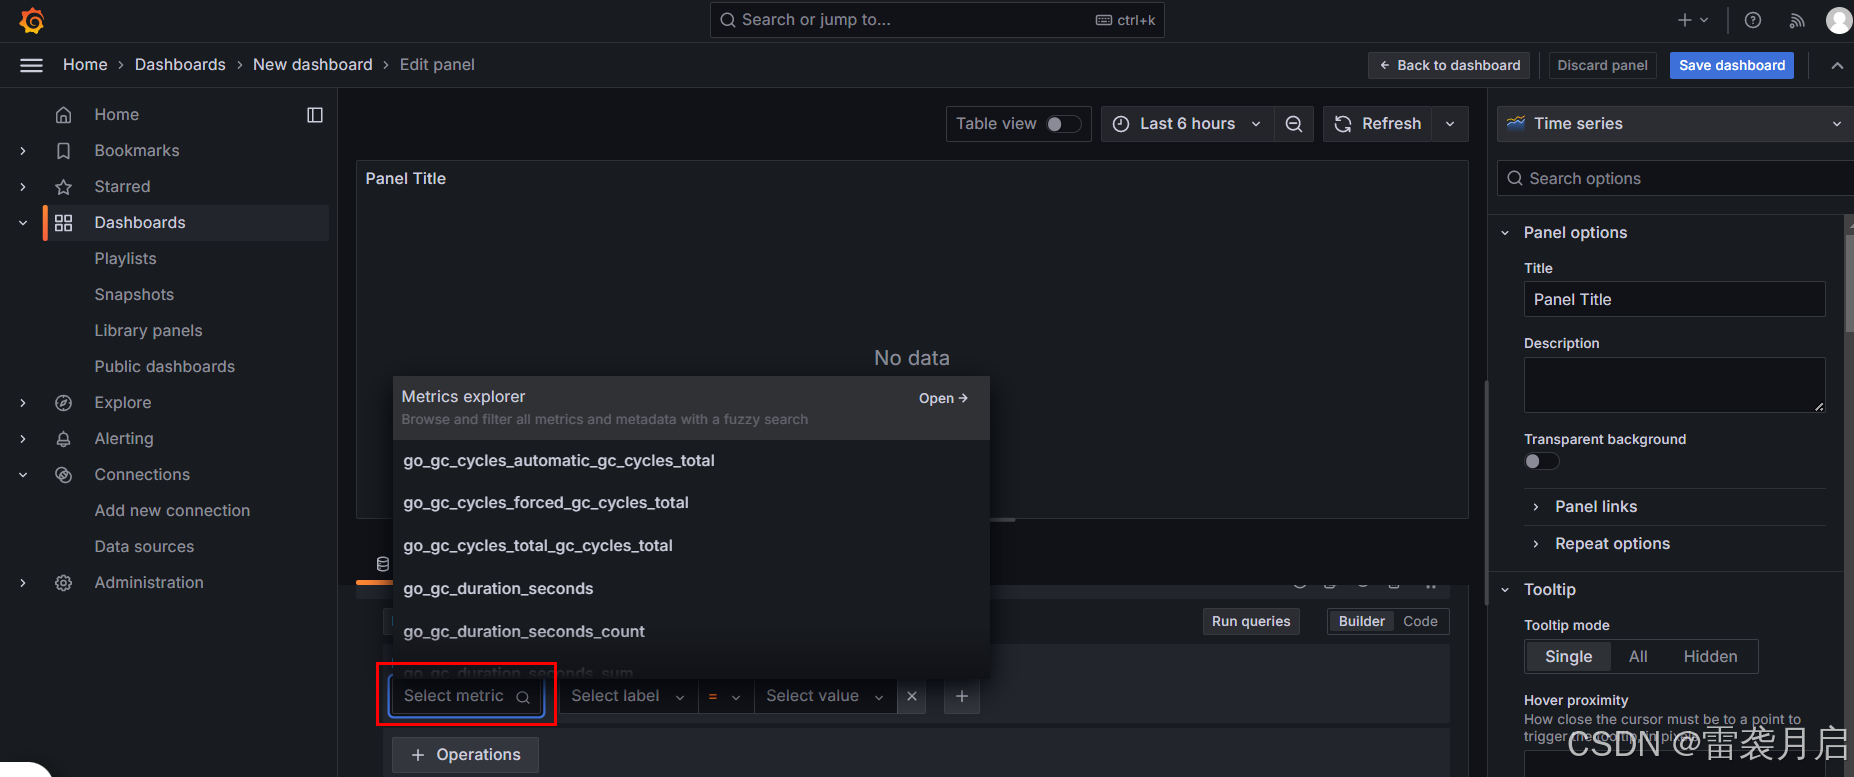
这里可以选择相关指标:
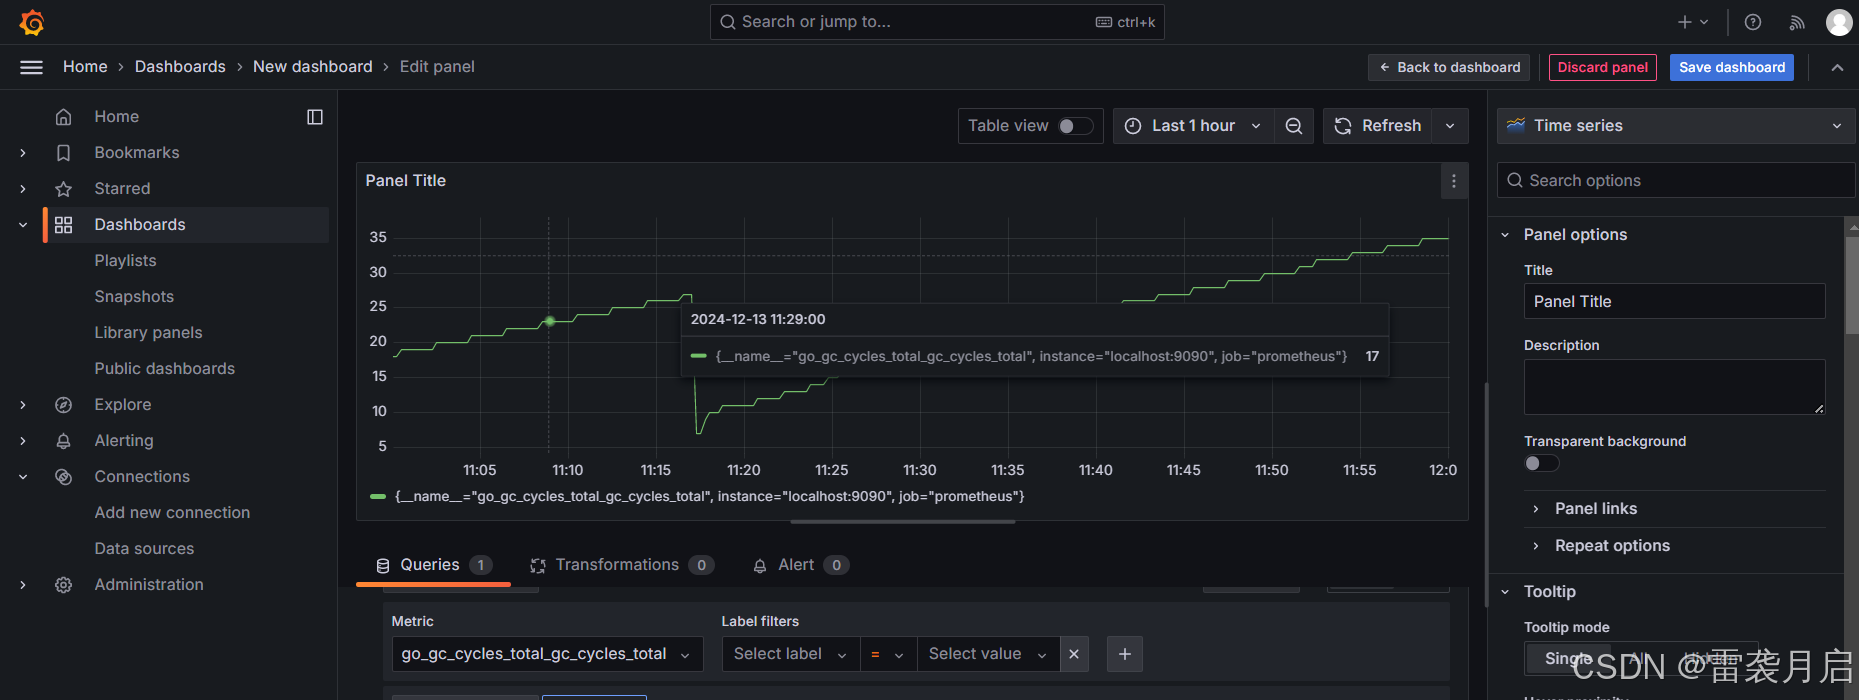
8、保存仪表盘之后,通过以下链接进行测试,再通过Grafana查看服务的GC,内存占用情况:
http://localhost:19200/leixi/demoDataBuild?number=1000
http://127.0.0.1:19200/leixi/demo?str=test
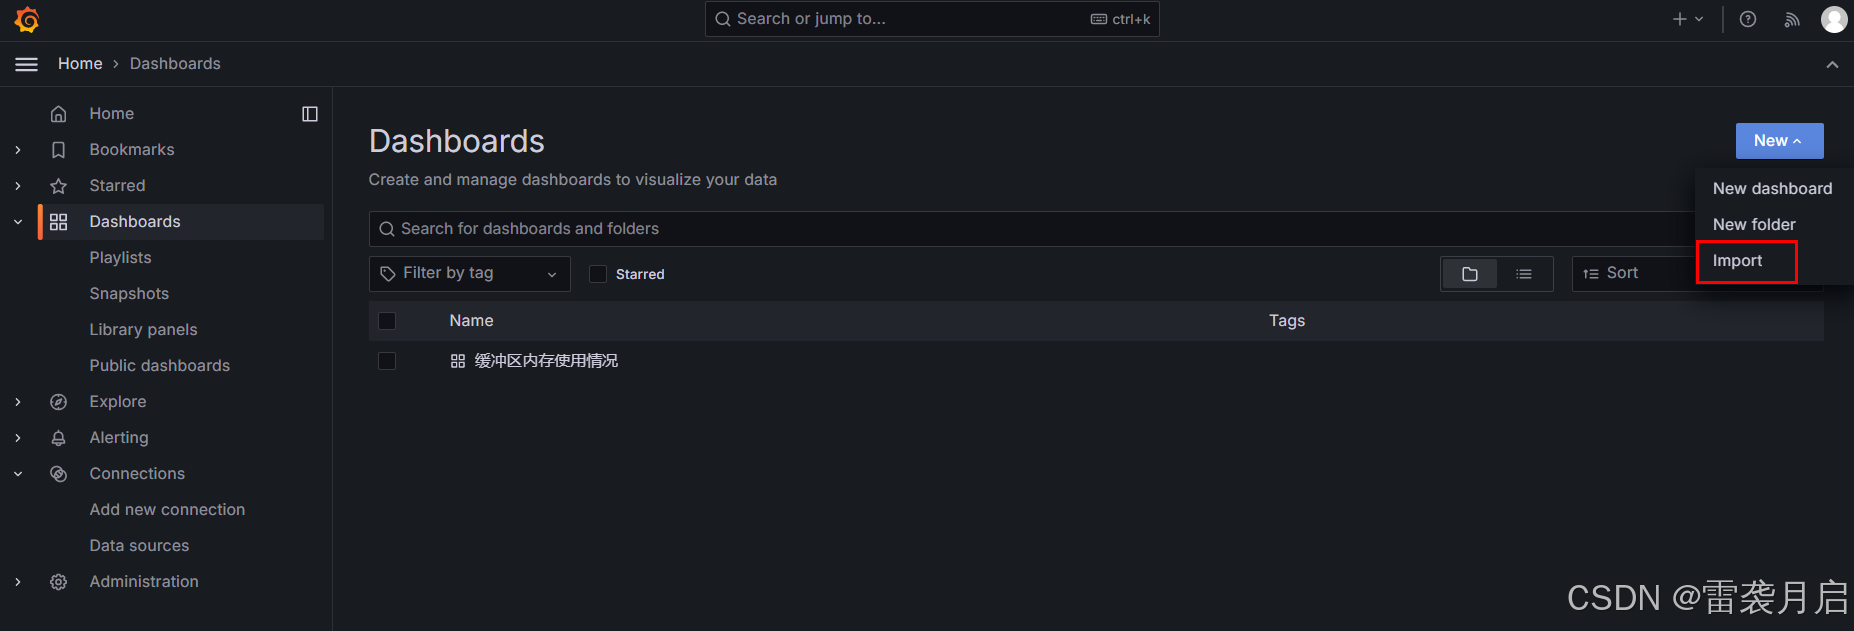
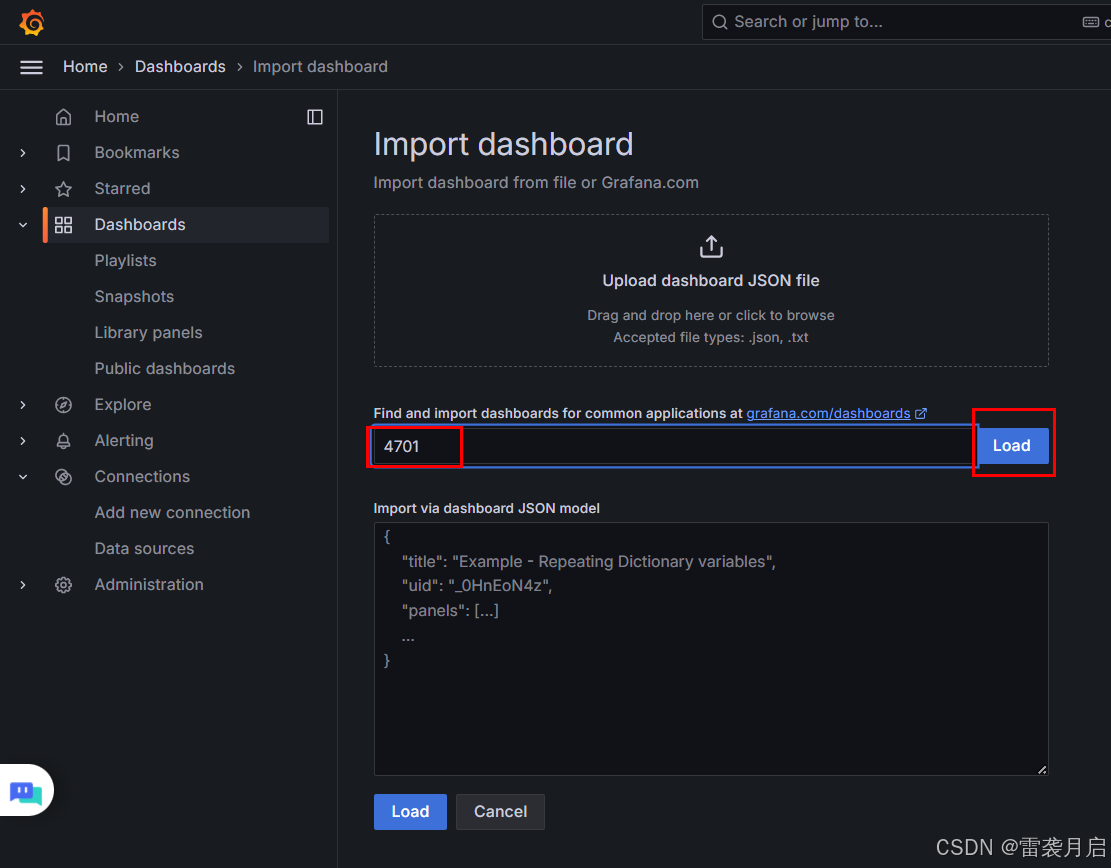
也可以通过这里的Import,导入JVM监控模板:
输入ID 4701,点击Load
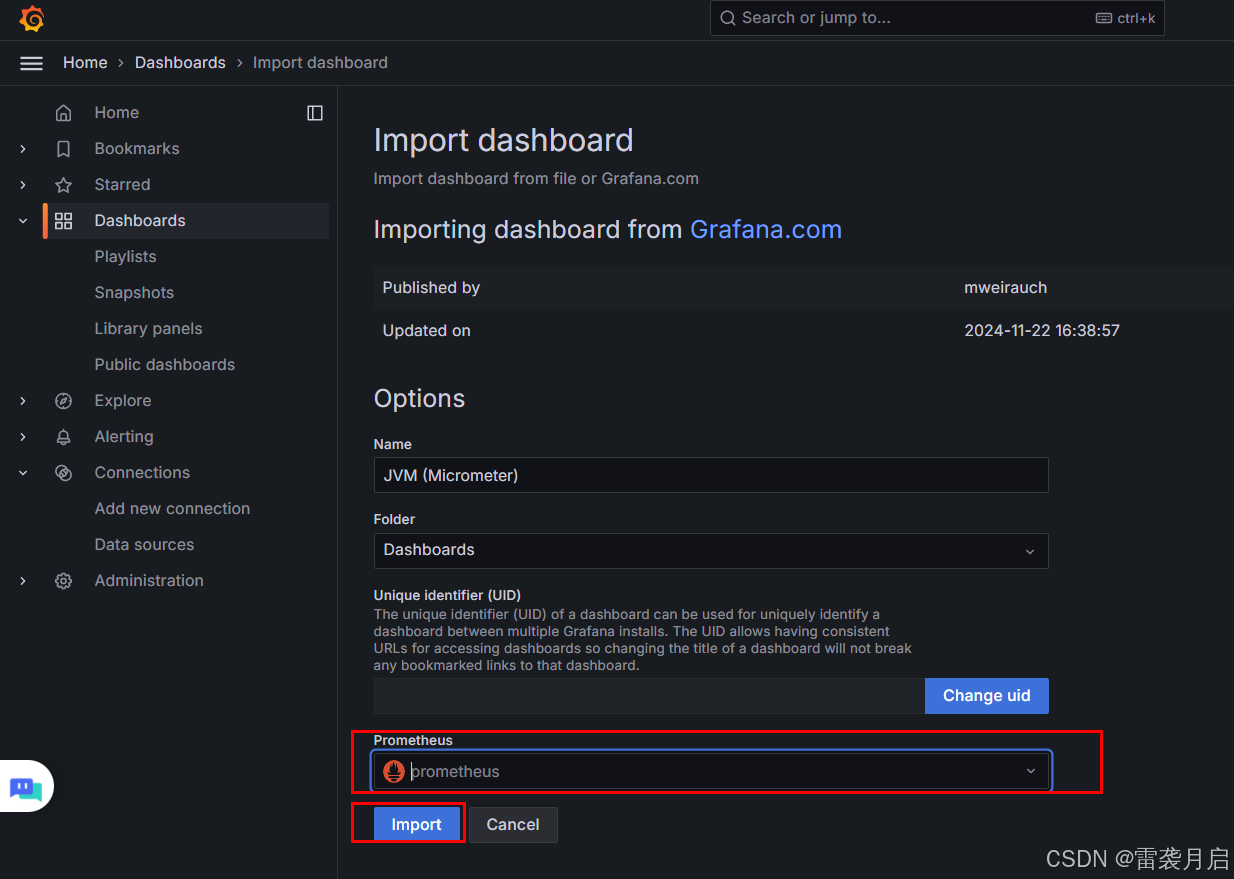
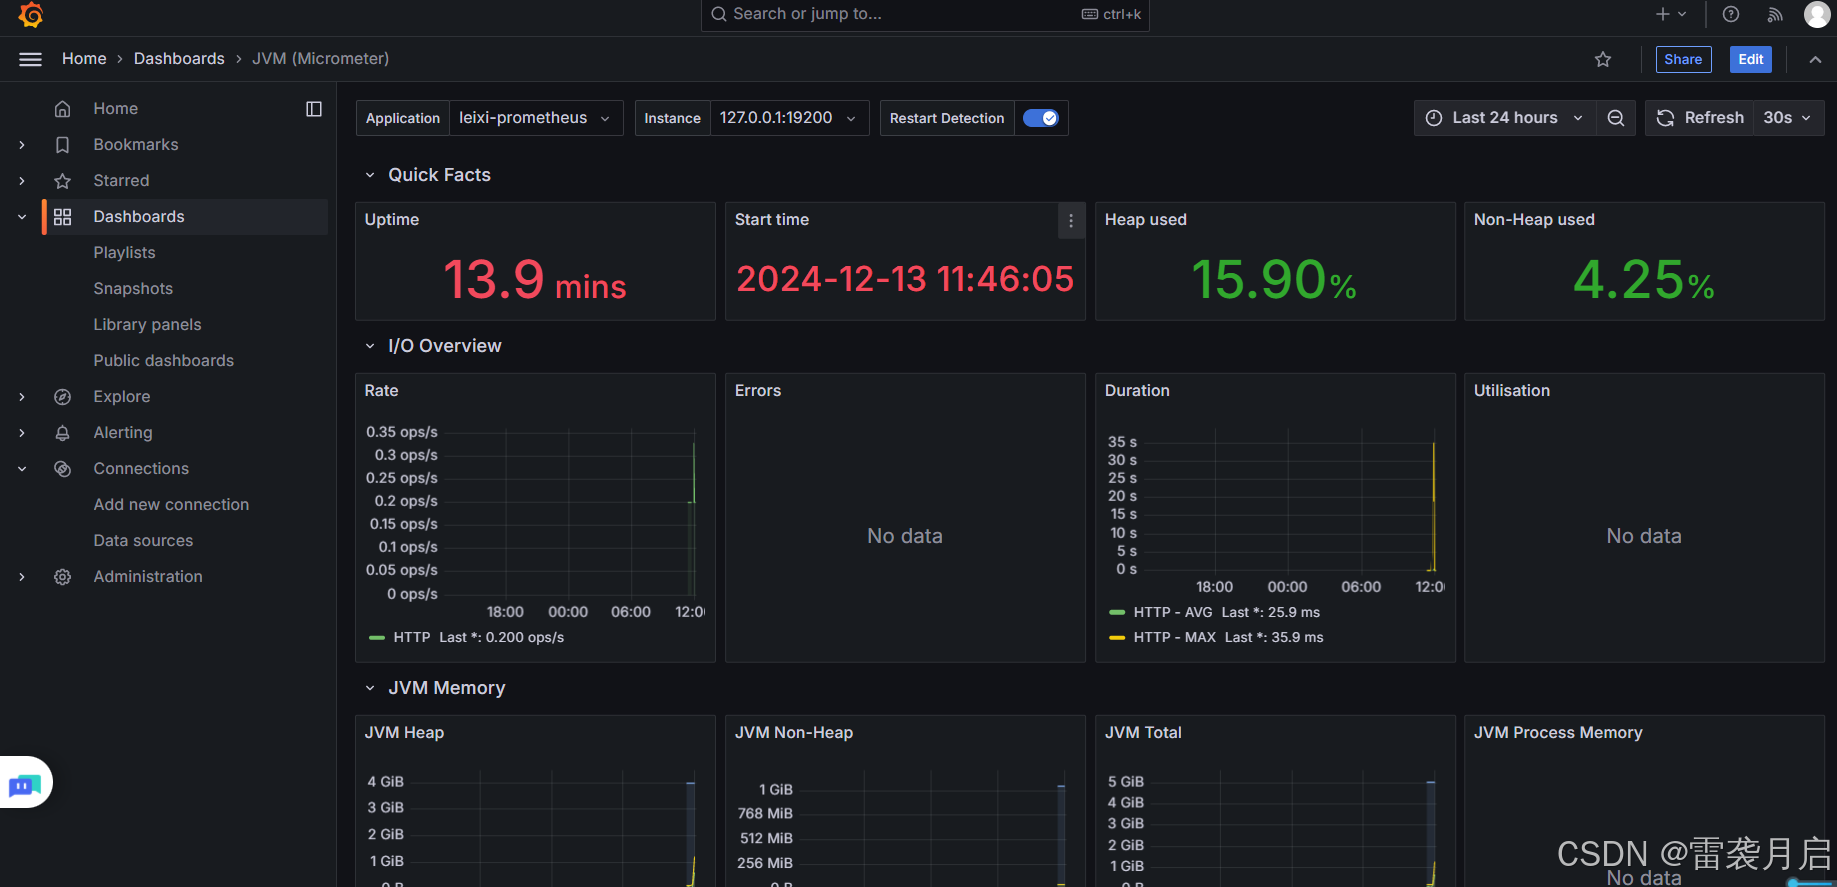
这样,即可看到服务的整体JVM仪表盘了:
后记与致谢
以上就是今天的全部内容了,其实有关Prometheus和Grafana的使用,Linux部署,配置等,能讲的内容有很多,今天着重描述它在Windows环境中的搭建,以及对Springboot微服务的监控,就没有做太多扩展,雷袭在整理这篇博客时,也学习和参考了很多资料,以下是对我帮助很大的,大家可以参考下,感谢大佬们指路!
Prometheus介绍-CSDN博客
Prometheus部署、操作_prometheus安装部署-CSDN博客
Windows环境下搭建Prometheus + Grafana监控Java服务
SpringBoot使用prometheus监控
配置grafana详解_grafana.ini-CSDN博客