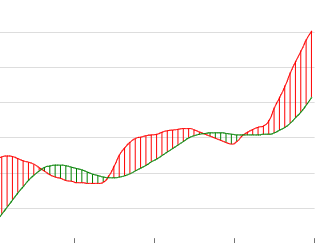
echarts实现两条折线区域中间有线连接,custom + renderItem(初级版)
实现的效果:
很粗略的一个版本,就是折线之间实现两个点位之间线连接

代码:
- 需要按照实际数据、样式去修改
- 需要其他样式就需要看文档了
series: [{name: '红',type: 'line',data: lineDataOne,smooth: true,symbol: 'emptyCircle',symbolSize: 6,lineStyle: {width: 1,color: 'red'},itemStyle: {opacity: 0, // 不要点color: 'red'},z: 2},{name: '绿',type: 'line',data: lineDataTwo,smooth: true,symbol: 'emptyCircle',symbolSize: 6,lineStyle: {width: 1,color: 'green'},itemStyle: {opacity: 0, // 不要点color: 'green'},z: 2},{name: '区域',type: 'custom',renderItem: function(params, api) {let categoryIndex = api.value(0)let topValue = api.value(1)let bottomValue = api.value(2)// 获取点的像素坐标let topPoint = api.coord([categoryIndex, topValue])let bottomPoint = api.coord([categoryIndex, bottomValue])// 只填充两条线之间的区域return {type: 'rect',shape: {x: topPoint[0] - 1, // 轻微宽度使区域连续y: topPoint[1],width: 1,height: bottomPoint[1] - topPoint[1]},style: {fill: topValue > bottomValue ? '#FF0000' : // 红色区域'green' // 绿色区域}}},dimensions: ['x', 'top', 'bottom'],encode: {x: 0,y: [1, 2]},data: xAxisData.map((x, i) => [x, lineDataOne[i], lineDataTwo[i]]),z: 0},]
