【Flask】测试平台开发,数据看板开发-第二十一篇
概述:
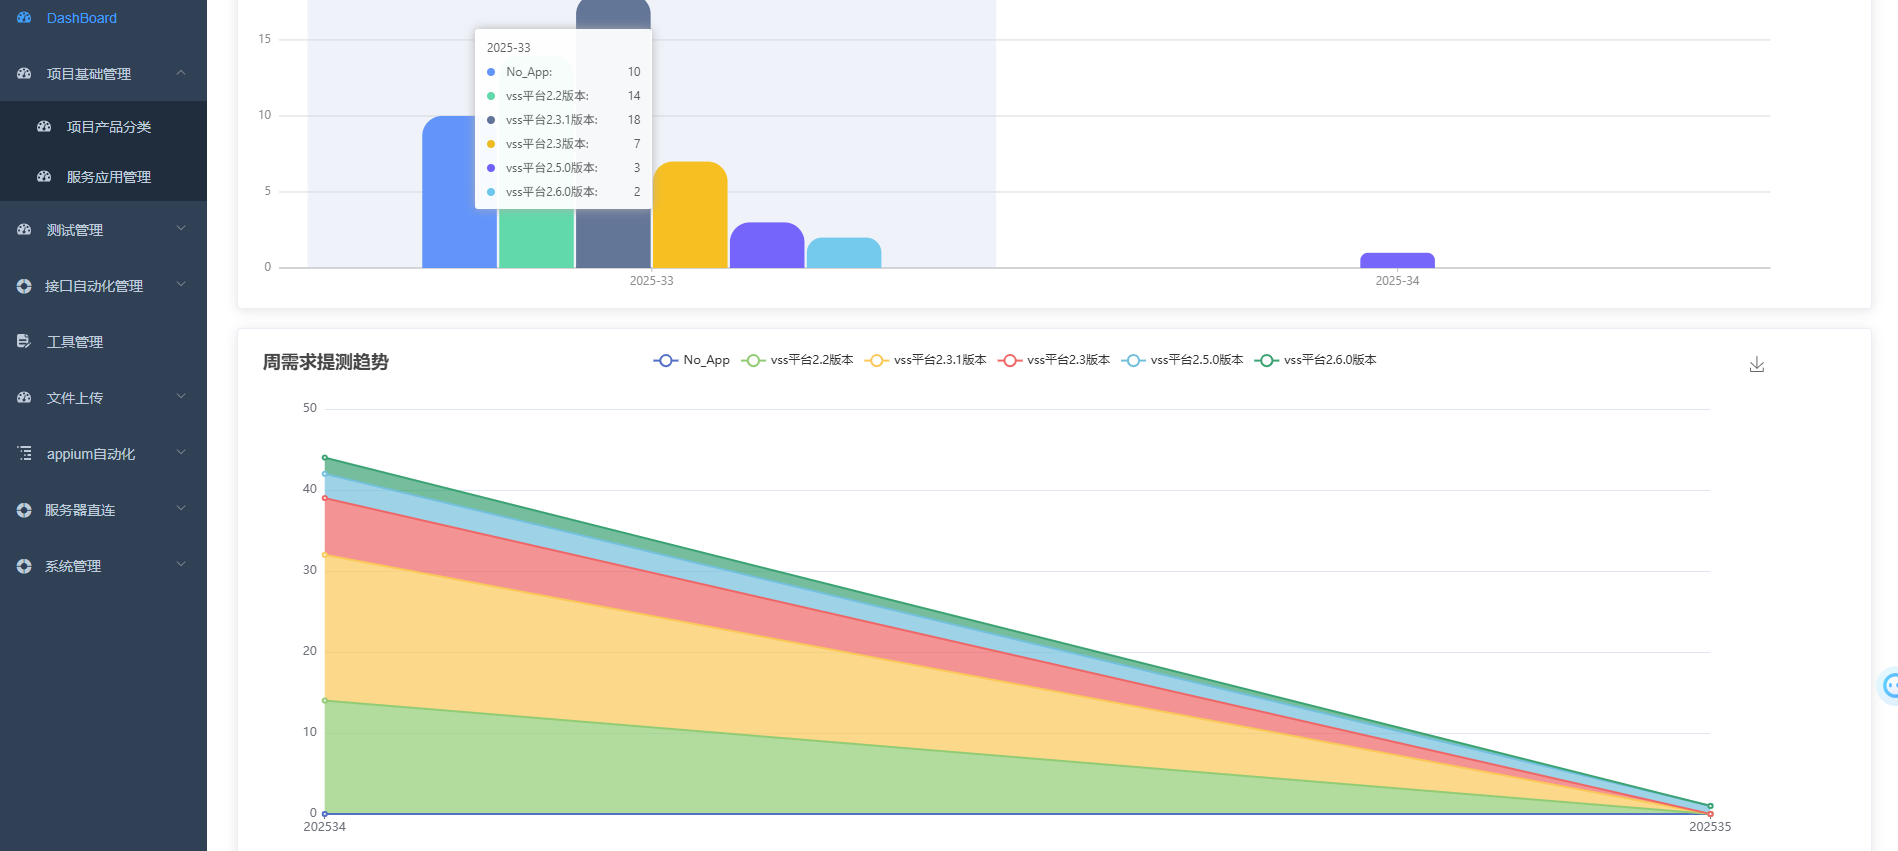
在前面我们已经实现了我们的产品创建管理,应用管理管理,需求提测管理但是每周提测了多少需求,创建了哪些产品,我们是不是看着不是很直观,接下来我们就需要开发一个数据看板功能,实现能够看到产品下创建的需求,提测数据
先看看实现效果
后端接口源码:
# -*- coding:utf-8 -*-
# application.py
import datetime
import tracebackfrom flask import Blueprint, current_app
from dbutils.pooled_db import PooledDB
from apis.product import connectDB
from configs import config, format
from flask import request
import pymysql.cursors
import json
# from utils.jwt import login_required# 使用数据库连接池的方式链接数据库,提高资源利用率
pool = PooledDB(pymysql, mincached=2, maxcached=5, host=config.MYSQL_HOST, port=config.MYSQL_PORT,user=config.MYSQL_USER, passwd=config.MYSQL_PASSWORD, database=config.MYSQL_DATABASE,cursorclass=pymysql.cursors.DictCursor)test_dashboard = Blueprint("test_dashboard", __name__)@test_dashboard.route("/api/dashboard/stacked", methods=['POST'])
def get_request_stacked():connection = Nonetry:connection = pool.connection()with connection.cursor() as cursor:sql_select = '''SELECT DATE_FORMAT(request.createDate,"%Y%u") weeks, apps.note, COUNT(apps.id) counts FROM request LEFT JOIN apps ON request.appId = apps.id GROUP BY weeks, apps.note;'''cursor.execute(sql_select)table_data = cursor.fetchall()  # 数据库返回的结果,包含 note 为 NULL 的行# === 核心修复:处理 NULL 值 ===weeks = []notes = []key_value = {}for row in table_data:# 1. 处理 weeks 可能为 NULL 的情况(如 createDate 为 NULL 时)week = row['weeks'] or 'No_Week'  # 转为默认字符串# 2. 处理 note 为 NULL 的情况(关键修复!)note = row['note'] or 'No_App'    # 将 NULL 转为 'Unknown_App'counts = row['counts'] or 0            # 确保 counts 不为 NULL# 后续逻辑保持不变,但使用处理后的 week 和 noteif week not in weeks:weeks.append(week)if note not in notes:notes.append(note)# 使用处理后的 week 和 note 拼接键名,避免 NULL 导致的 TypeErrorkey_value[f"{week}_{note}"] = counts  # 建议用下划线分隔,避免歧义(如 week=202534, note=23 变为 20253423)weeks.sort()  # 排序周数# 生成 series 数据(保持不变,但 note 已无 NULL)series = {}for note in notes:series[note] = []for week in weeks:# 使用处理后的键名(带下划线)series[note].append(key_value.get(f"{week}_{note}", 0))resp_data = {'weeks': weeks,'notes': notes,  # 已包含处理后的 'Unknown_App''series': series}resp = format.resp_format_successresp['data'] = resp_datareturn respexcept Exception as e:# current_app.logger.error(f"Error in get_request_stacked: {str(e)}")  # 记录错误日志,方便调试resp = format.resp_format_errorresp['message'] = "Failed to process stacked data"return resp, 500finally:if connection:connection.close()  # 释放连接from datetime import datetime  # 正确的导入方式
@test_dashboard.route("/api/dashboard/metadata", methods=['POST'])
def get_request_stacked_metadata():connection = Nonetry:# === 1. 解析请求体 ===if not request.data:return {"code": 40001, "message": "Request body is empty", "data": [], "total": 0}, 400body = request.get_json()if body is None:return {"code": 40002, "message": "Invalid JSON format", "data": [], "total": 0}, 400current_app.logger.info(f"Request body: {body}")date_range = body.get('date', [])start_date_param = body.get('start_date')end_date_param = body.get('end_date')# 初始化变量start_date = Noneend_date = Nonevalid = False# === 2. 日期参数处理 ===if date_range and len(date_range) == 2:start_str, end_str = date_range[0], date_range[1]date_format = '%Y-%m-%d %H:%M:%S'try:# 使用正确的 datetime.datetime.strptimedatetime.strptime(start_str, date_format)datetime.strptime(end_str, date_format)if start_str <= end_str:start_date = start_strend_date = end_strvalid = Truecurrent_app.logger.info(f"Valid date range: {start_date} to {end_date}")except ValueError:current_app.logger.warning("Invalid date format in date_range")valid = Falseelif start_date_param and end_date_param:date_format = '%Y-%m-%d %H:%M:%S'try:datetime.strptime(start_date_param, date_format)datetime.strptime(end_date_param, date_format)if start_date_param <= end_date_param:start_date = start_date_paramend_date = end_date_paramvalid = Truecurrent_app.logger.info(f"Valid date params: {start_date} to {end_date}")except ValueError:current_app.logger.warning("Invalid date format in start_date/end_date")valid = Falseelse:current_app.logger.info("No date filter applied, querying all data")# === 3. 构建SQL查询 ===connection = pool.connection()with connection.cursor() as cursor:# 临时禁用ONLY_FULL_GROUP_BYtry:cursor.execute("SET SESSION sql_mode=(SELECT REPLACE(@@sql_mode,'ONLY_FULL_GROUP_BY',''))")except Exception as mode_error:current_app.logger.warning(f"Could not modify SQL mode: {mode_error}")if valid and start_date and end_date:# 带日期过滤的查询sql = """SELECT CONCAT(YEAR(r.createDate), '-', LPAD(WEEK(r.createDate), 2, '0')) as week_key, \COALESCE(a.note, 'No_App')                                   AS app_name, \COUNT(*)                                                          as request_countFROM request rLEFT JOIN apps a ON r.appId = a.idWHERE r.createDate BETWEEN %s AND %sGROUP BY YEAR (r.createDate), WEEK(r.createDate), a.noteORDER BY week_key, app_name \"""current_app.logger.info(f"Executing filtered query: {start_date} to {end_date}")cursor.execute(sql, (start_date, end_date))else:# 查询所有数据的查询sql = """SELECT CONCAT(YEAR(r.createDate), '-', LPAD(WEEK(r.createDate), 2, '0')) as week_key, \COALESCE(a.note, 'No_App')                                   AS app_name, \COUNT(*)                                                          as request_countFROM request rLEFT JOIN apps a ON r.appId = a.idGROUP BY YEAR (r.createDate), WEEK(r.createDate), a.noteORDER BY week_key, app_name \"""current_app.logger.info("Executing full data query")cursor.execute(sql)table_data = cursor.fetchall()current_app.logger.info(f"Query returned {len(table_data)} rows")# === 4. 处理返回数据 ===cleaned_data = []for row in table_data:cleaned_data.append({'weeks': row.get('week_key', 'No_Week'),'note': row.get('app_name', 'No_App'),'counts': row.get('request_count', 0)})# 成功响应return {"code": 20000,"message": "success","data": cleaned_data,"total": len(cleaned_data)}except json.JSONDecodeError:return {"code": 40000, "message": "Invalid JSON format", "data": [], "total": 0}, 400except Exception as e:current_app.logger.error(f"Metadata API Error:\n"f"Error: {str(e)}\n"f"Stacktrace: {traceback.format_exc()}")return {"code": 50000,"message": "Internal server error","data": [],"total": 0}, 500finally:if connection:try:connection.close()except Exception:pass
前端图标部分主要分别是 Echats 和 G2Plot 组件,从个人使用上来讲前者应用更广、自定义开发更灵活,后者使用上更简单尤其是在数据绑的格式和方式上更友好,在我们使用 Element vue admin 集成分支项目中有关图表的例子基础就是Echats,比如其中的混合图表(柱形+折线)
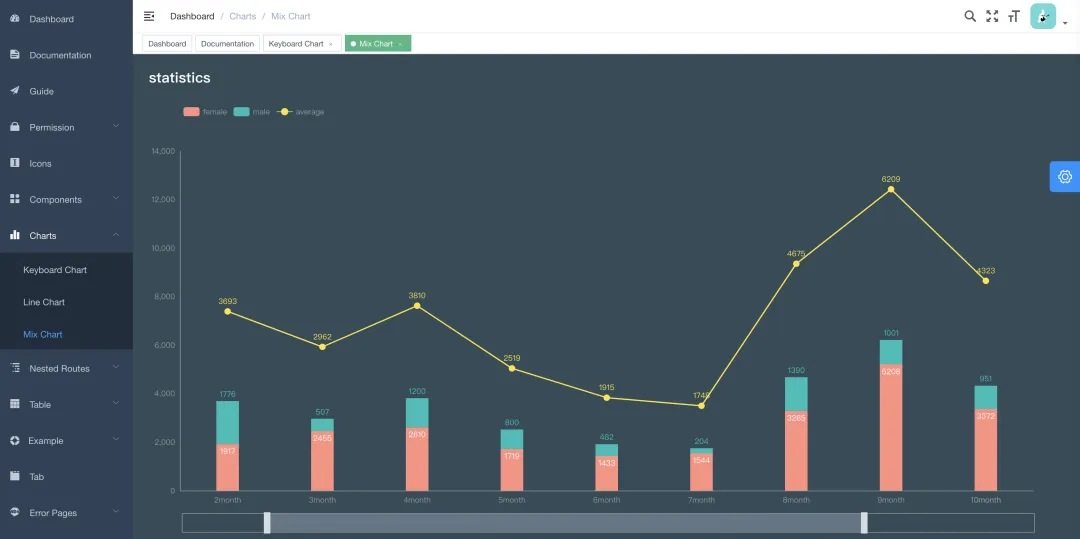
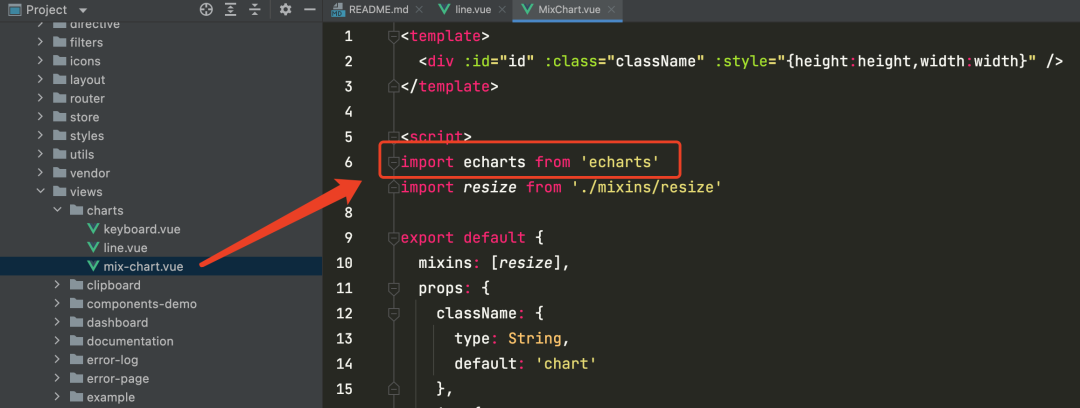
对应源代码中代码位置依据可从 /views/chats 看到导入的是 echats 也就是说此组件的使用方式,同样是通过添加依赖和导入使用。
结合提测平台的后台数据,接下来就体验下 Echarts 的图表的如何使用。
VUE项目使用步骤
步骤一:项目进行依赖安装
npm install echarts --save执行完成后可以在 package.json 的 dependencies 配置项目看到 "echarts": "^5.2.2"引依赖被添加。
步骤二:页面添加组件引用和定义一个容器
<template><div class="app-container"><div ref="pieChartDemo" style="width: 600px;height:400px;"></div></div>
</template><script>
import * as echarts from 'echarts'
...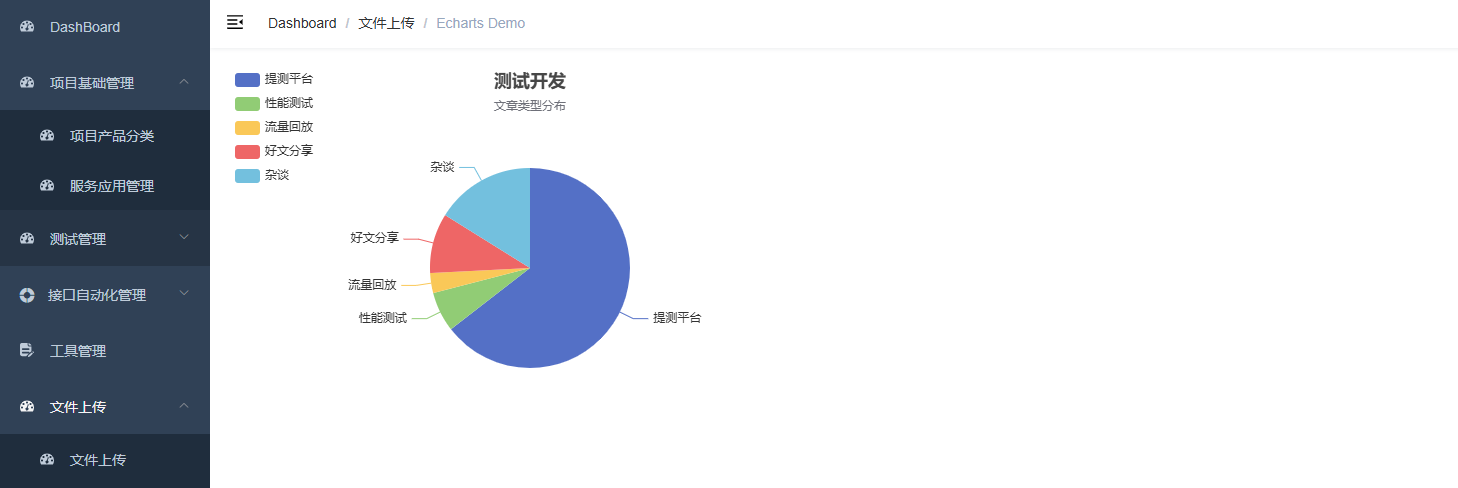
</script>步骤三:使用 echarts.init 方法初始化一个 echarts 实例并通过setOption方法生成一个简单饼图,余下配置代码如下(注意查看几处注解说明):
export default {name: 'EchartsDemo',// 使用mounted在页面控件加载在完成后mounted方法进行echart初始化非createdmounted() {this.initPieChart()},methods: {initPieChart() {// 采用的是vue ref的方式获取容器var chartDom = this.$refs['pieChartDemo']var myChart = echarts.init(chartDom)var option = {title: {text: '测试开发',subtext: '文章类型分布',left: 'center'},tooltip: {trigger: 'item'},legend: {orient: 'vertical',left: 'left'},series: [{name: 'Access From',type: 'pie',radius: '50%',data: [{ value: 20, name: '提测平台' },{ value: 2, name: '性能测试' },{ value: 1, name: '流量' },{ value: 3, name: '分享' },{ value: 5, name: '其他' }]}]}option && myChart.setOption(option);}}
}
堆叠面积图
在掌握了Echar表的渲染方法和接口数据格式化的充分准备之后,就可以直接上在 src/views/dashboard/index.vue 编写代码,注意实现里有个额外的 series 数据处理,已经标注在代码注解里了。
<template><div class="dashboard-container"><div ref="LineChartBoard" style="width: 95%;height:500px;"></div></div>
</template><script>
import * as echarts from 'echarts'
import { requestStacked } from '@/api/board'export default {name: 'Dashboard',mounted() {this.getApList()},methods: {getApList() {requestStacked().then(resp => {this.initStackedChart(resp.data)})},initStackedChart(data) {const chartDom = this.$refs['LineChartBoard']const myChart = echarts.init(chartDom)const series = []// 唯一处理需要额外逻辑处理的地方,根据接口数据动态生成series数据for (var key in data.series) {series.push({name: key,type: 'line',stack: 'Total',areaStyle: {},emphasis: {focus: 'series'},data: data.series[key]})}var option = {title: {text: '周需求提测趋势'},tooltip: {trigger: 'axis',axisPointer: {type: 'cross',label: {backgroundColor: '#6a7985'}}},legend: {// 数据标题展示data: data.note},toolbox: {feature: {saveAsImage: {}}},grid: {left: '3%',right: '4%',bottom: '3%',containLabel: true},xAxis: [{type: 'category',boundaryGap: false,data: data.weeks}],yAxis: [{type: 'value'}],series: series}option && myChart.setOption(option)}}
}
</script>
完整的vue前端源码
<template><div class="dashboard-container"><div class="filter-container"><el-form :inline="true" :model="searchValue"><el-form-item label="日期选择"><el-date-pickerv-model="searchValue.date"type="daterange"value-format="yyyy-MM-dd HH:mm:ss"range-separator="至"start-placeholder="开始日期"end-placeholder="结束日期"></el-date-picker></el-form-item><el-form-item><el-button type="primary" @click="searchBoard">刷新查询</el-button></el-form-item><el-form-item><el-switchv-model="stackedColumnMode"@change="changeBoardMode"active-text="分组模式"inactive-text="累积模式"></el-switch></el-form-item></el-form></div><el-card class="box-card"><div slot="header" class="clearfix"><span>周需求分组量</span></div><div id="ColumnBoard" style="width: 95%;height:360px;" /></el-card><br><el-card class="box-card"><div ref="LineChartBoard" style="width: 95%;height:500px;" /></el-card></div>
</template><script>
import * as echarts from 'echarts'
import { Column } from '@antv/g2plot'import { requestStacked, requestMetaData } from '@/api/board'export default {name: 'Dashboard',created() {this.getAppList()this.getMetaDate()},mounted() {this.stackedColumnPlot = new Column('ColumnBoard', {data: this.stackedColumnData,xField: 'weeks',yField: 'counts',seriesField: 'note',isGroup: this.stackedColumnMode ? 'true' : 'false',columnStyle: {radius: [20, 20, 0, 0]}})this.stackedColumnPlot.render()},data() {return {stackedColumnPlot: undefined,stackedColumnData: [],stackedColumnMode: true,searchValue: {date: []}}},methods: {getAppList() {requestStacked().then(resp => {this.initStackedChart(resp.data)})},getMetaDate() {const params = {date: this.searchValue.date}requestMetaData(params).then(resp => {this.stackedColumnData = resp.datathis.stackedColumnPlot.changeData(this.stackedColumnData)this.initStackedColumn(resp.data)})},// initStackedColumn(data) {//   const stackedColumnPlot = new Column('ColumnBoard', {//     data,//     xField: 'weeks',//     yField: 'counts',//     seriesField: 'note',//     isGroup: 'true',//     columnStyle: {//       radius: [20, 20, 0, 0]//     }//   })//   stackedColumnPlot.render()// },initStackedChart(data) {const chartDom = this.$refs['LineChartBoard']const myChart = echarts.init(chartDom)const series = []// 唯一处理需要额外逻辑处理的地方,根据接口数据动态生成series数据for (var key in data.series) {series.push({name: key,type: 'line',stack: 'Total',areaStyle: {},emphasis: {focus: 'series'},data: data.series[key]})}var option = {title: {text: '周需求提测趋势'},tooltip: {trigger: 'axis',axisPointer: {type: 'cross',label: {backgroundColor: '#6a7985'}}},legend: {data: data.note},toolbox: {feature: {saveAsImage: {}}},grid: {left: '3%',right: '4%',bottom: '3%',containLabel: true},xAxis: [{type: 'category',boundaryGap: false,data: data.weeks}],yAxis: [{type: 'value'}],series: series}option && myChart.setOption(option)},searchBoard() {this.getMetaDate()},// 更改显示类型changeBoardMode() {const options = {isGroup: this.stackedColumnMode}this.stackedColumnPlot.update(options)}}
}
</script><style lang="scss" scoped>
.dashboard {&-container {margin: 30px;}&-text {font-size: 30px;line-height: 46px;}
}
</style>
最终实现后就是我们一开始截图后的实现效果